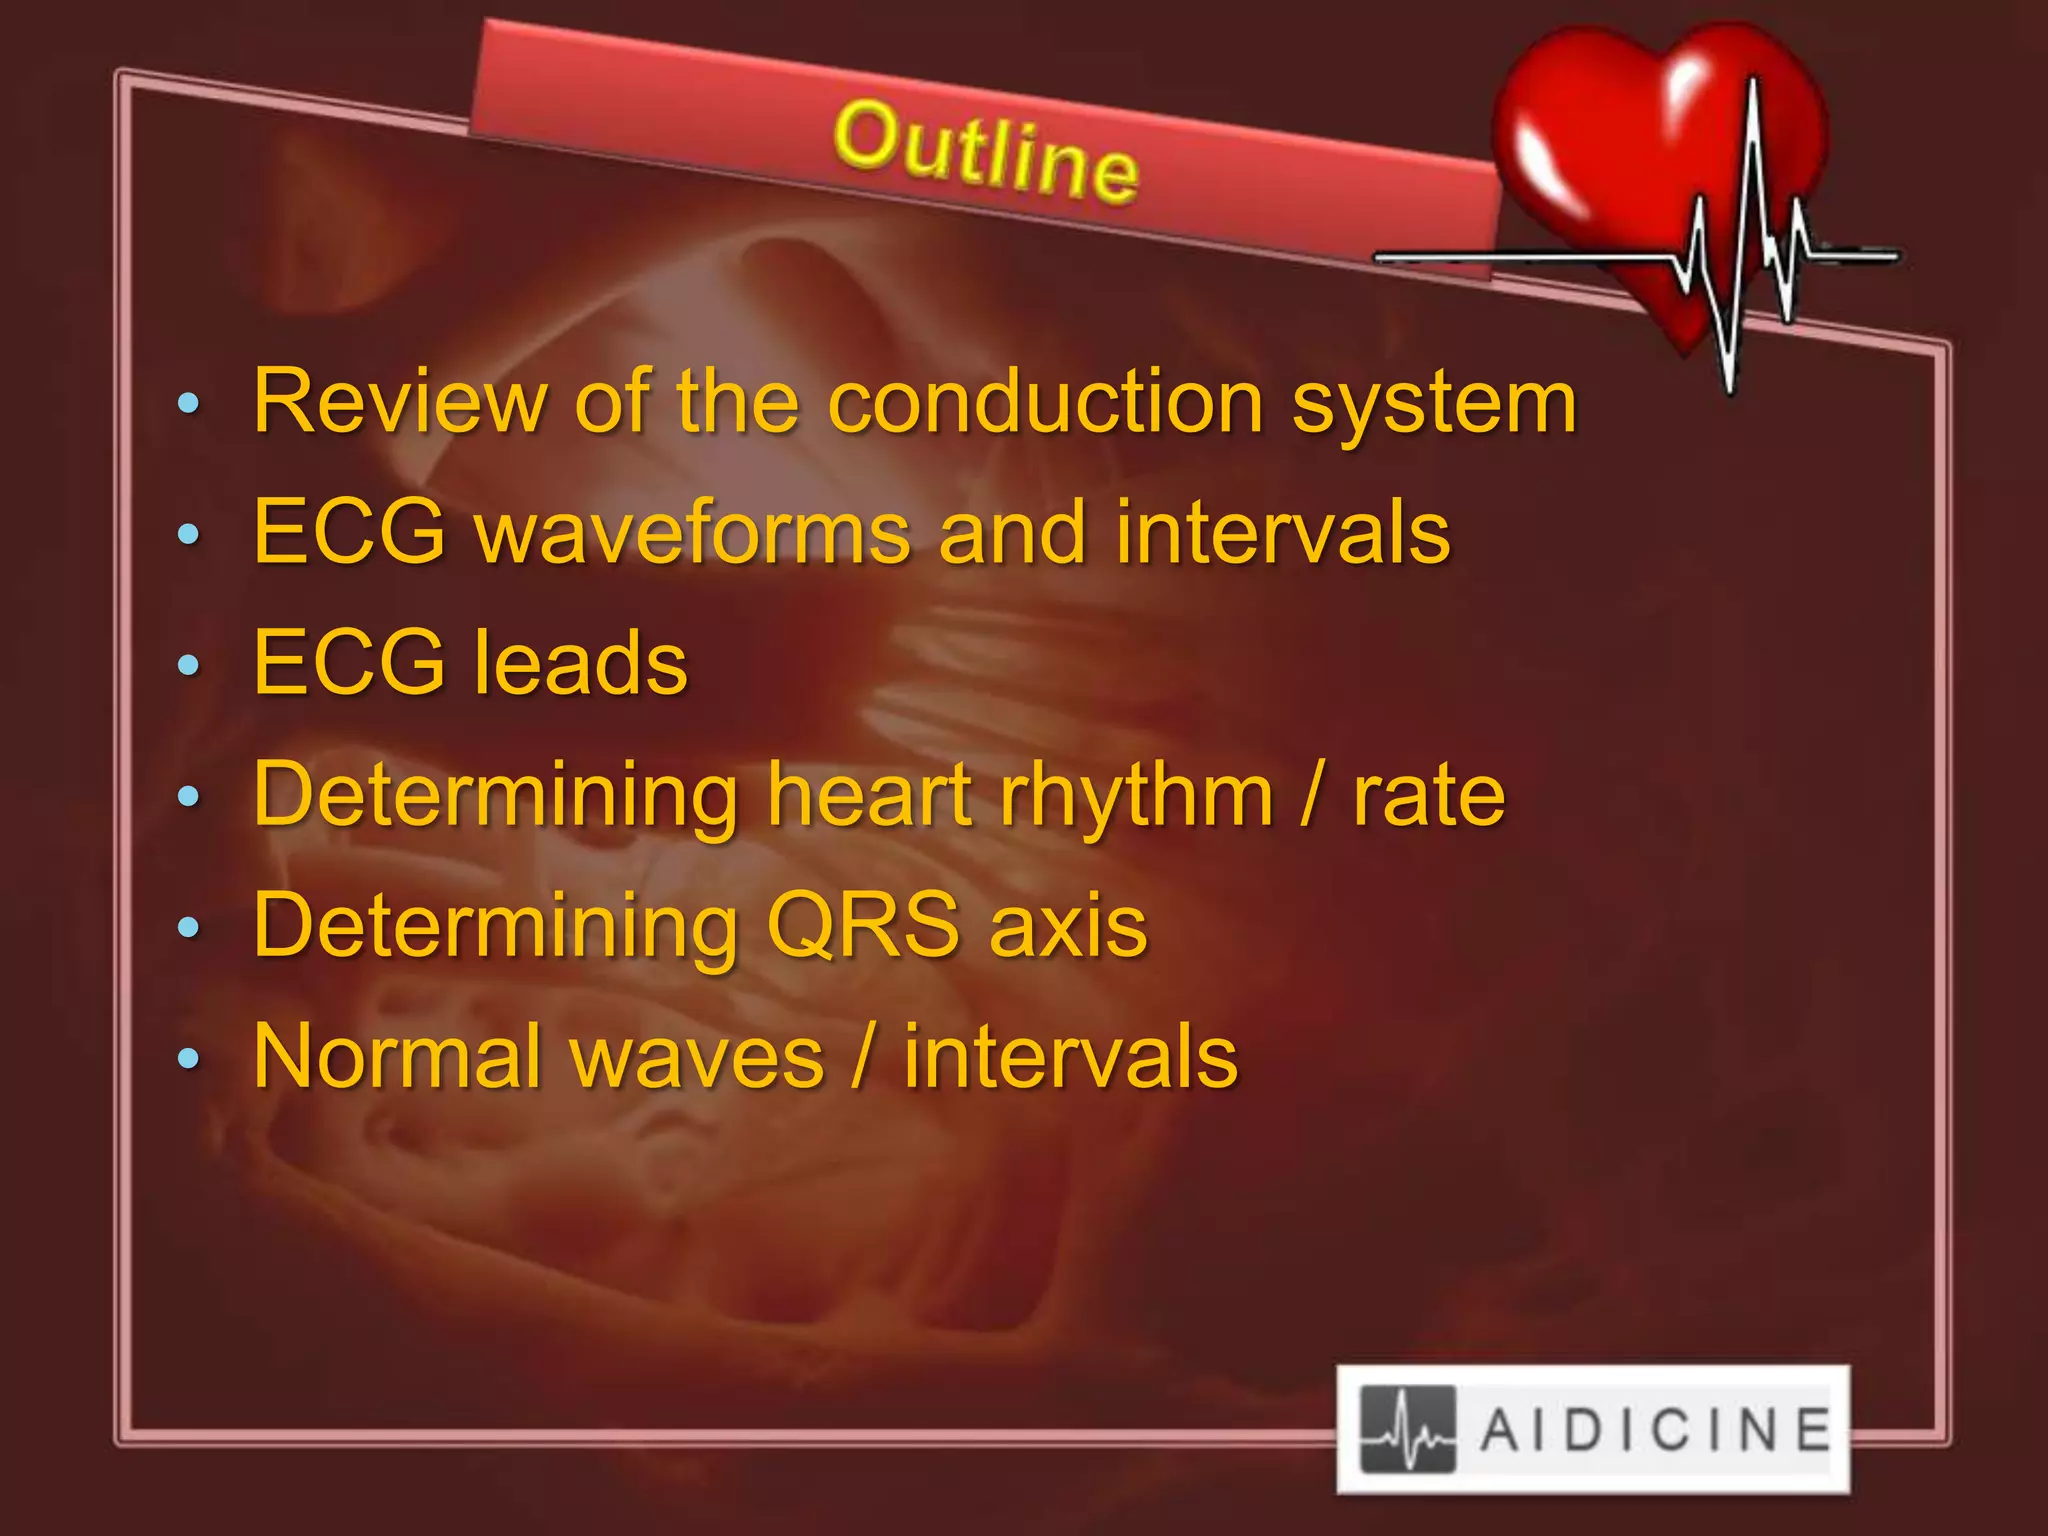
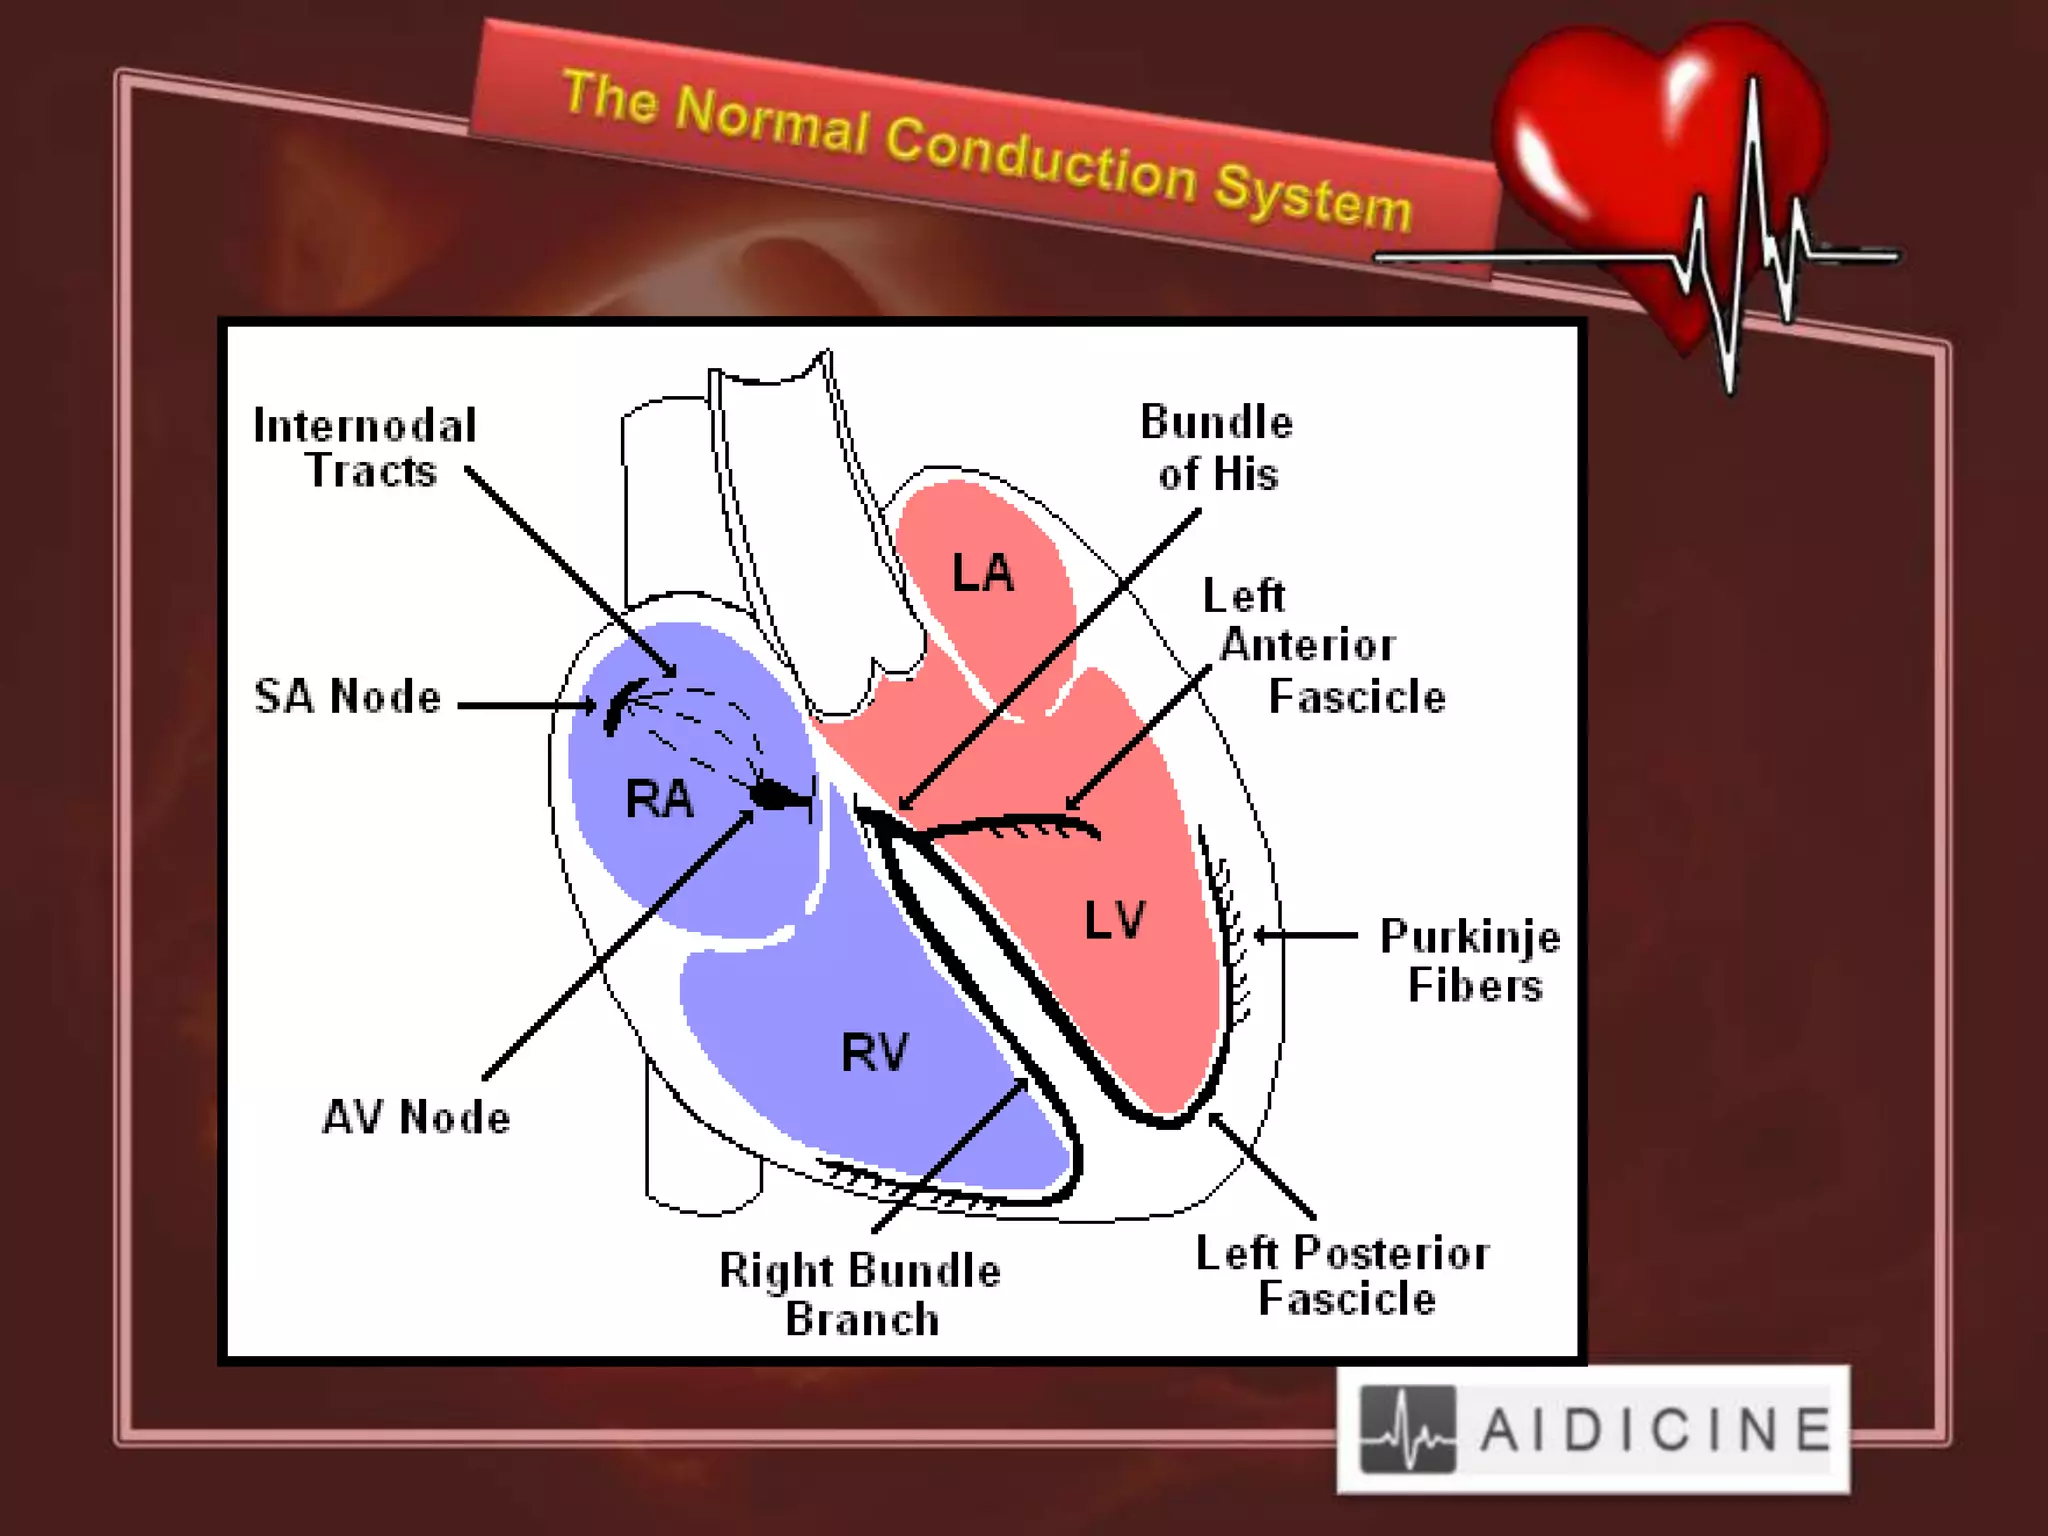
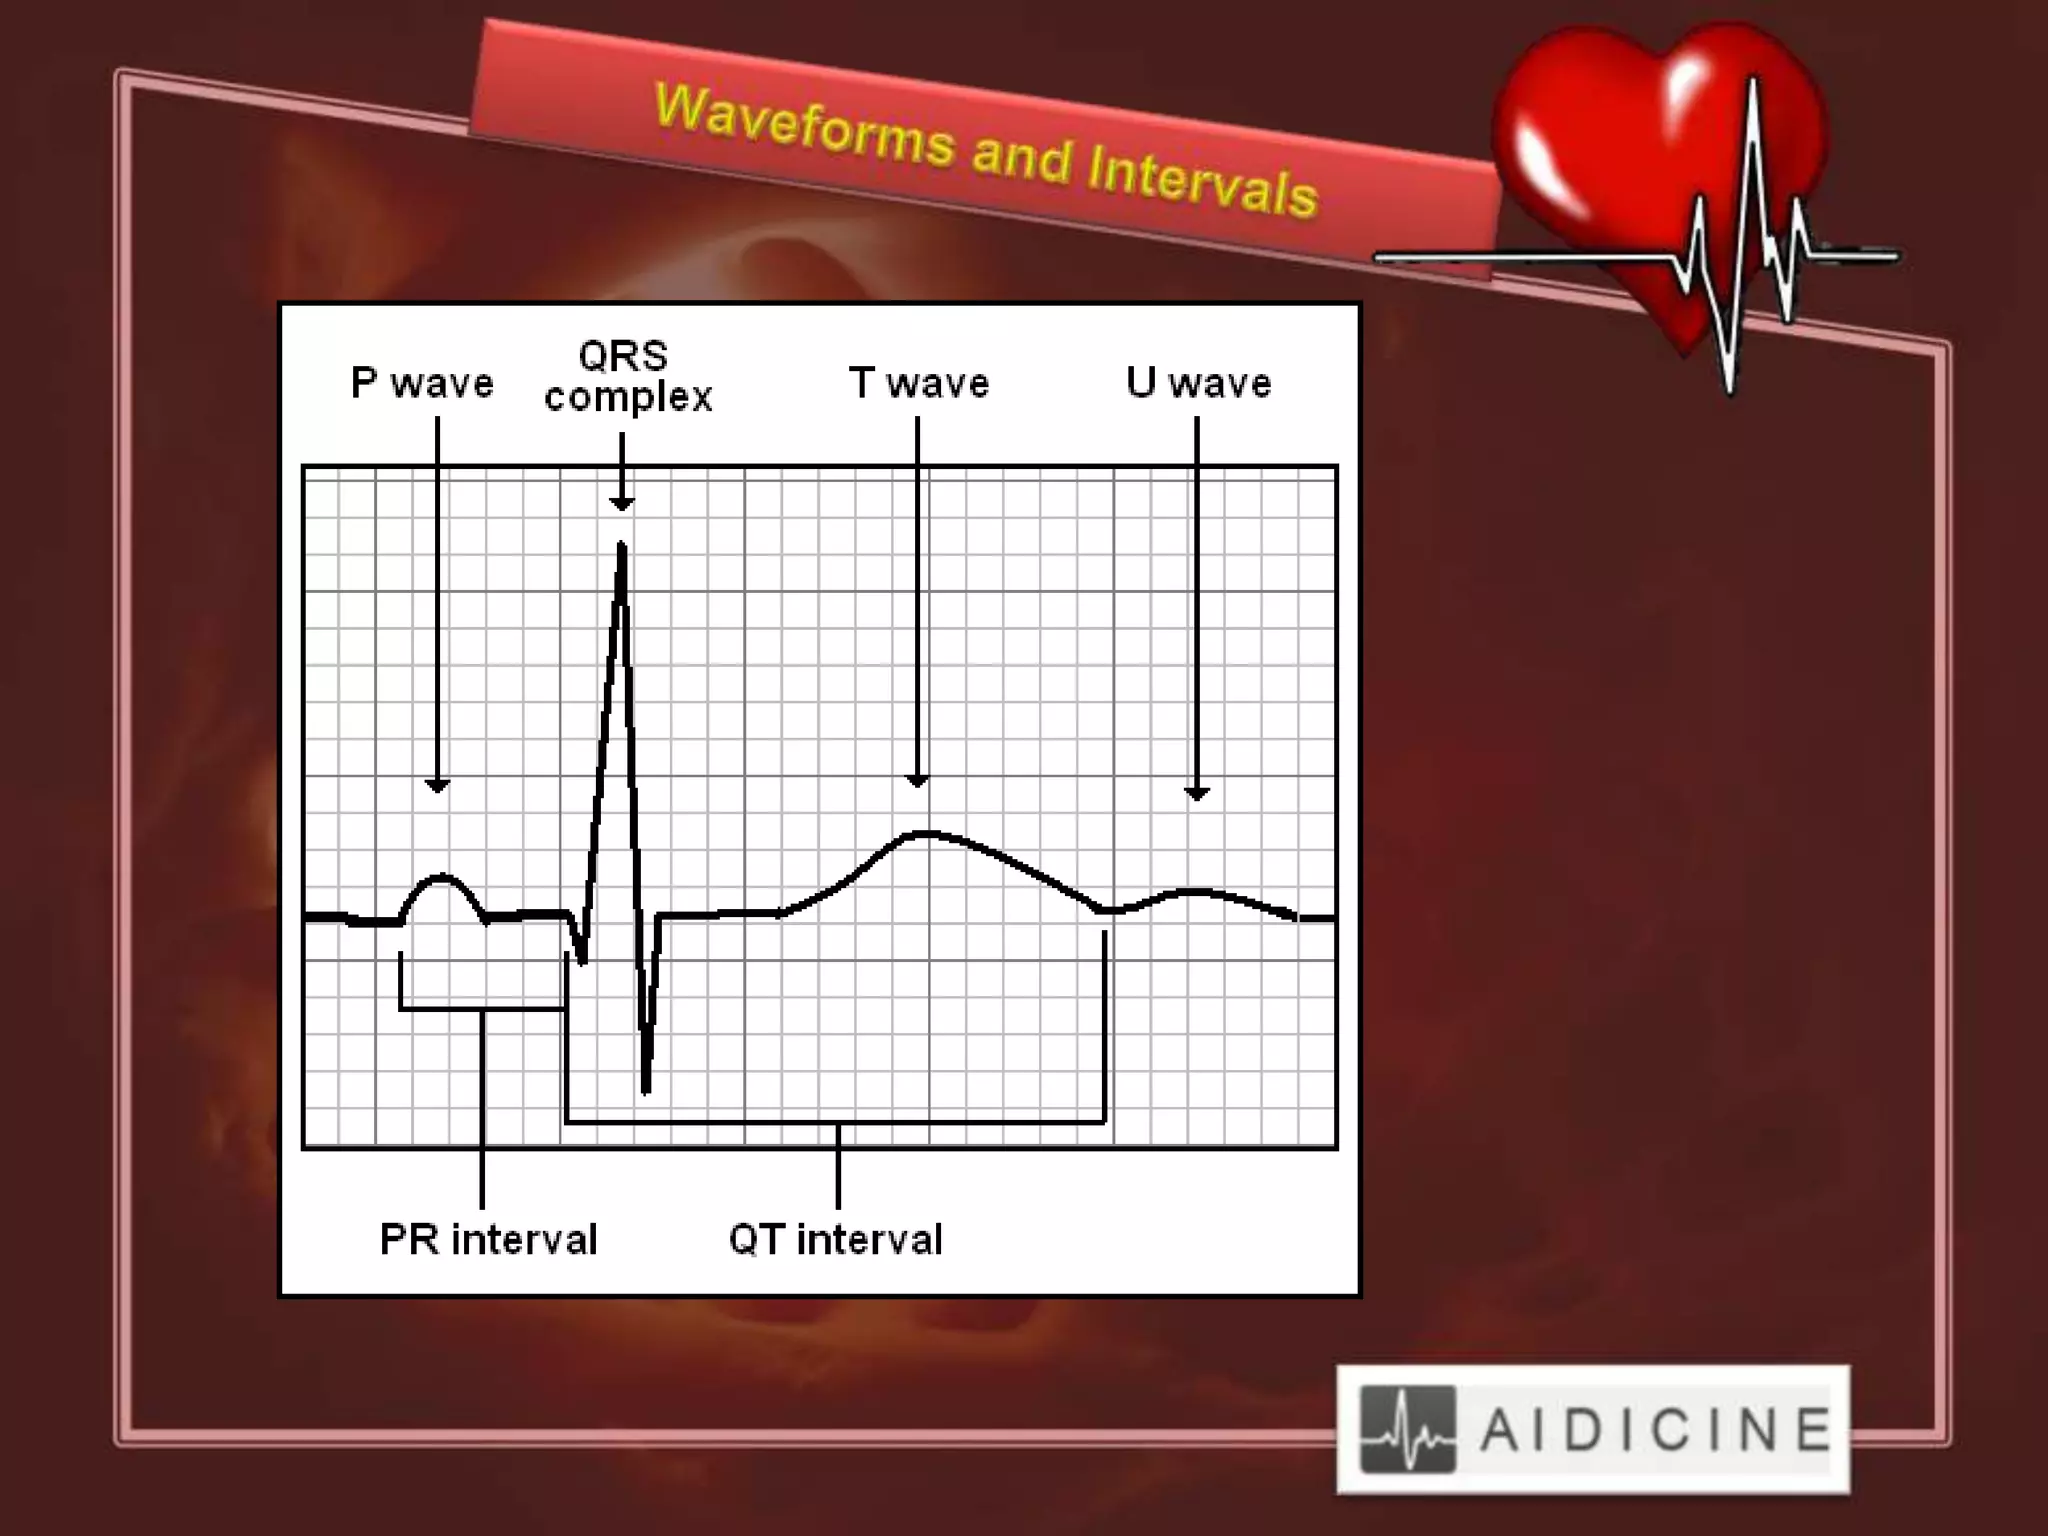
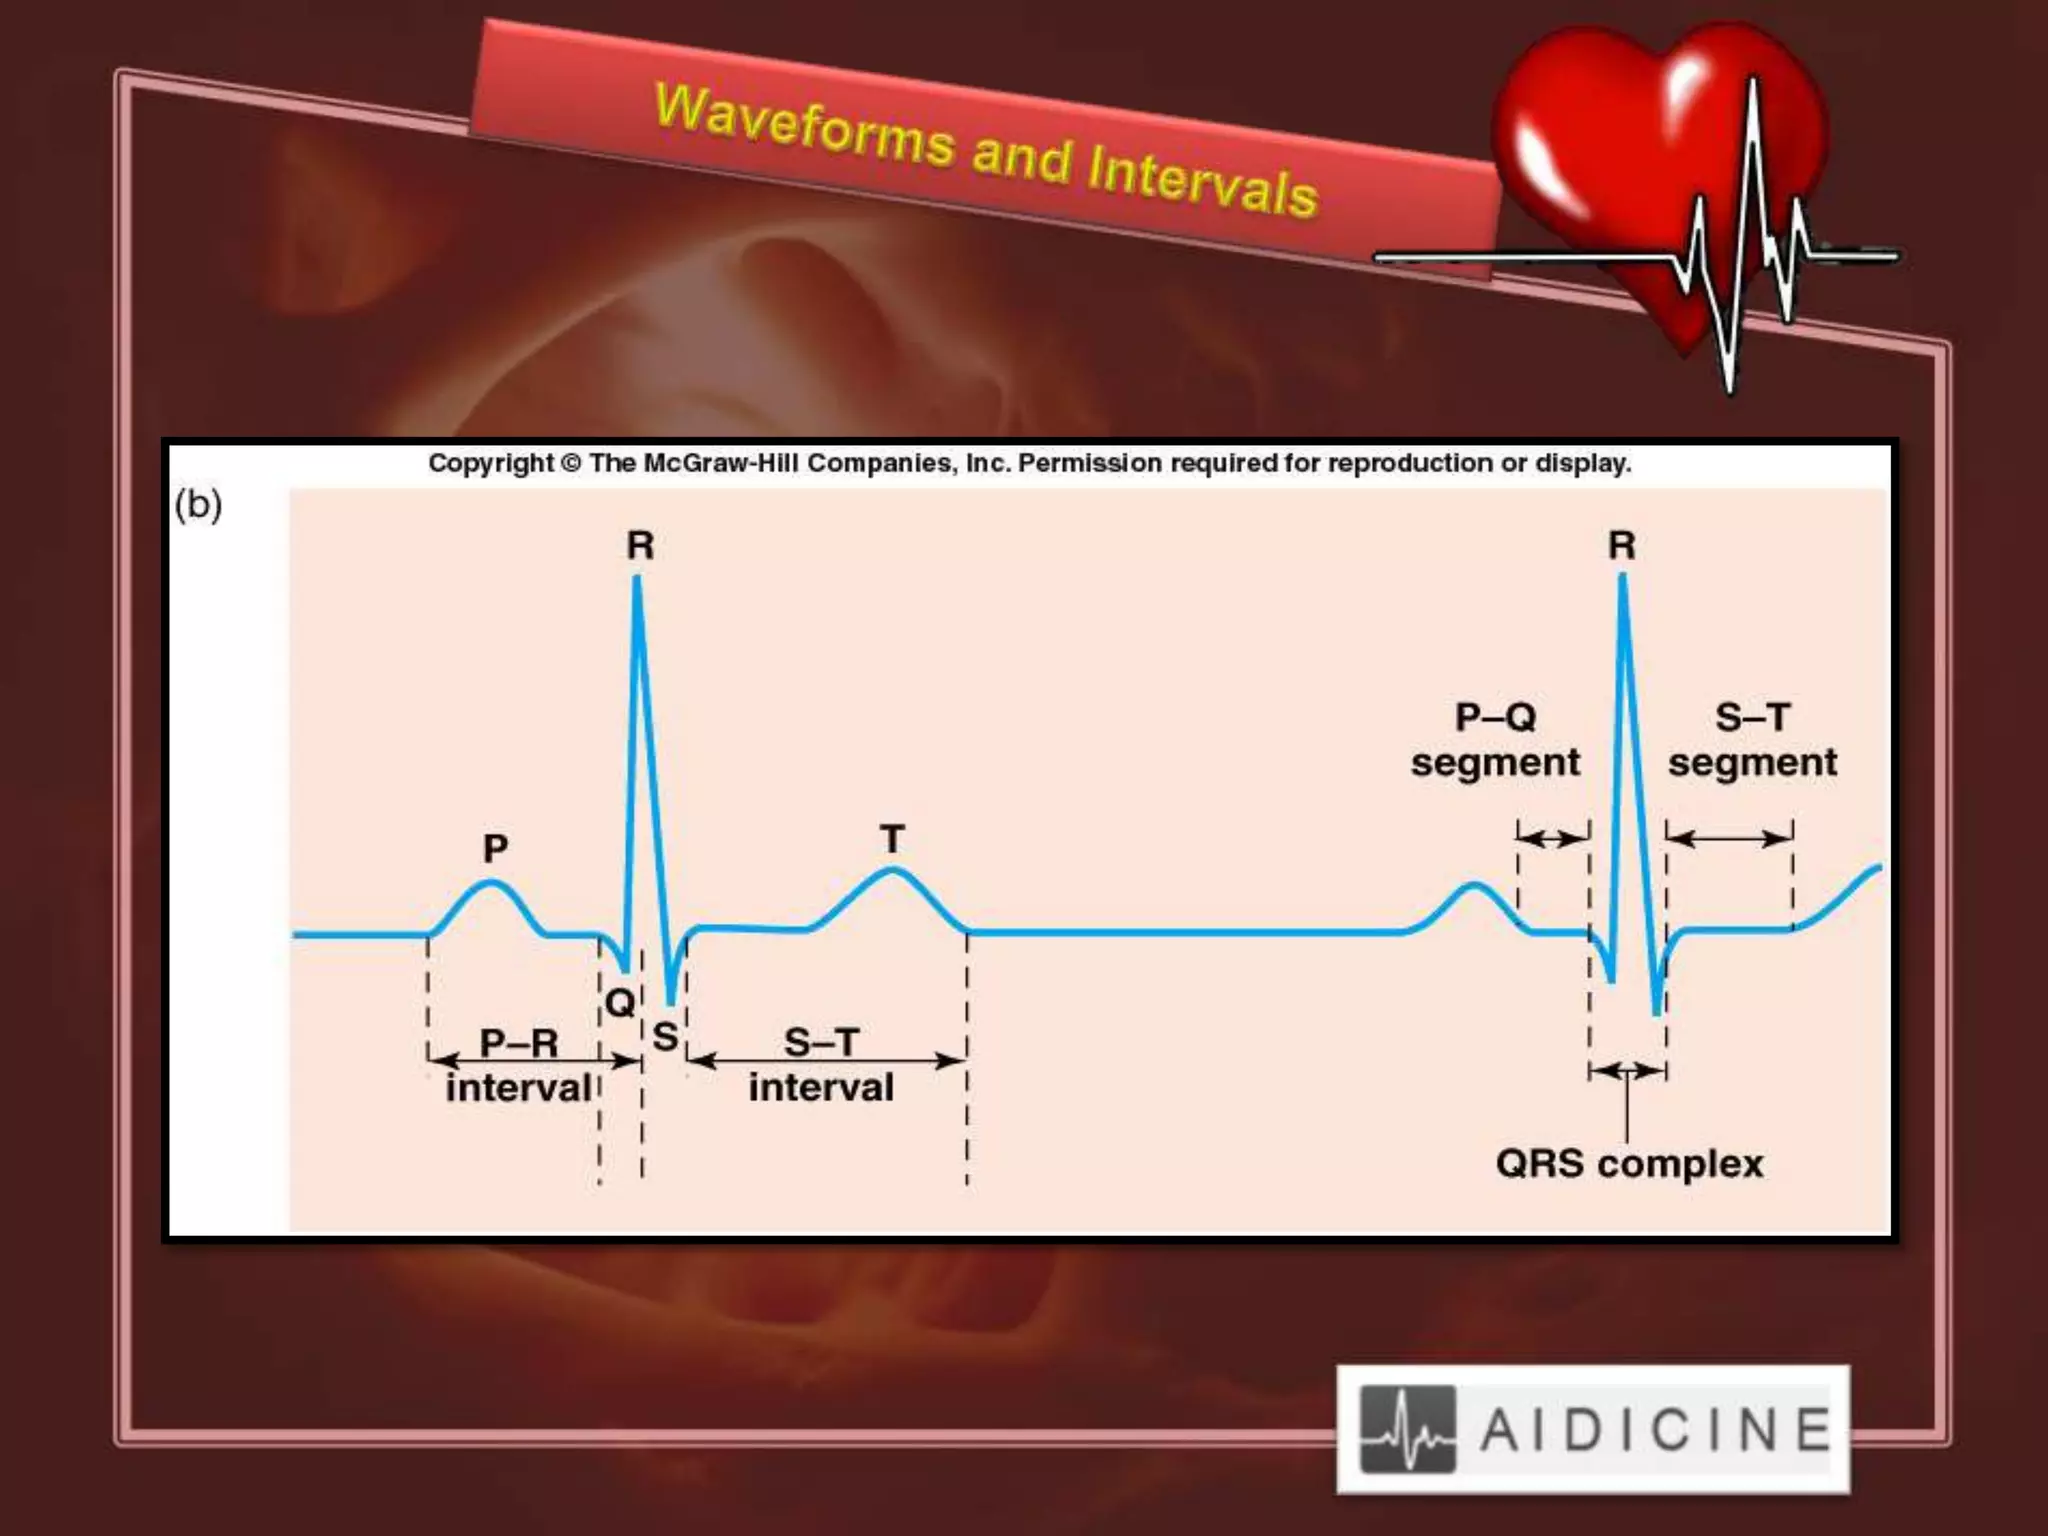
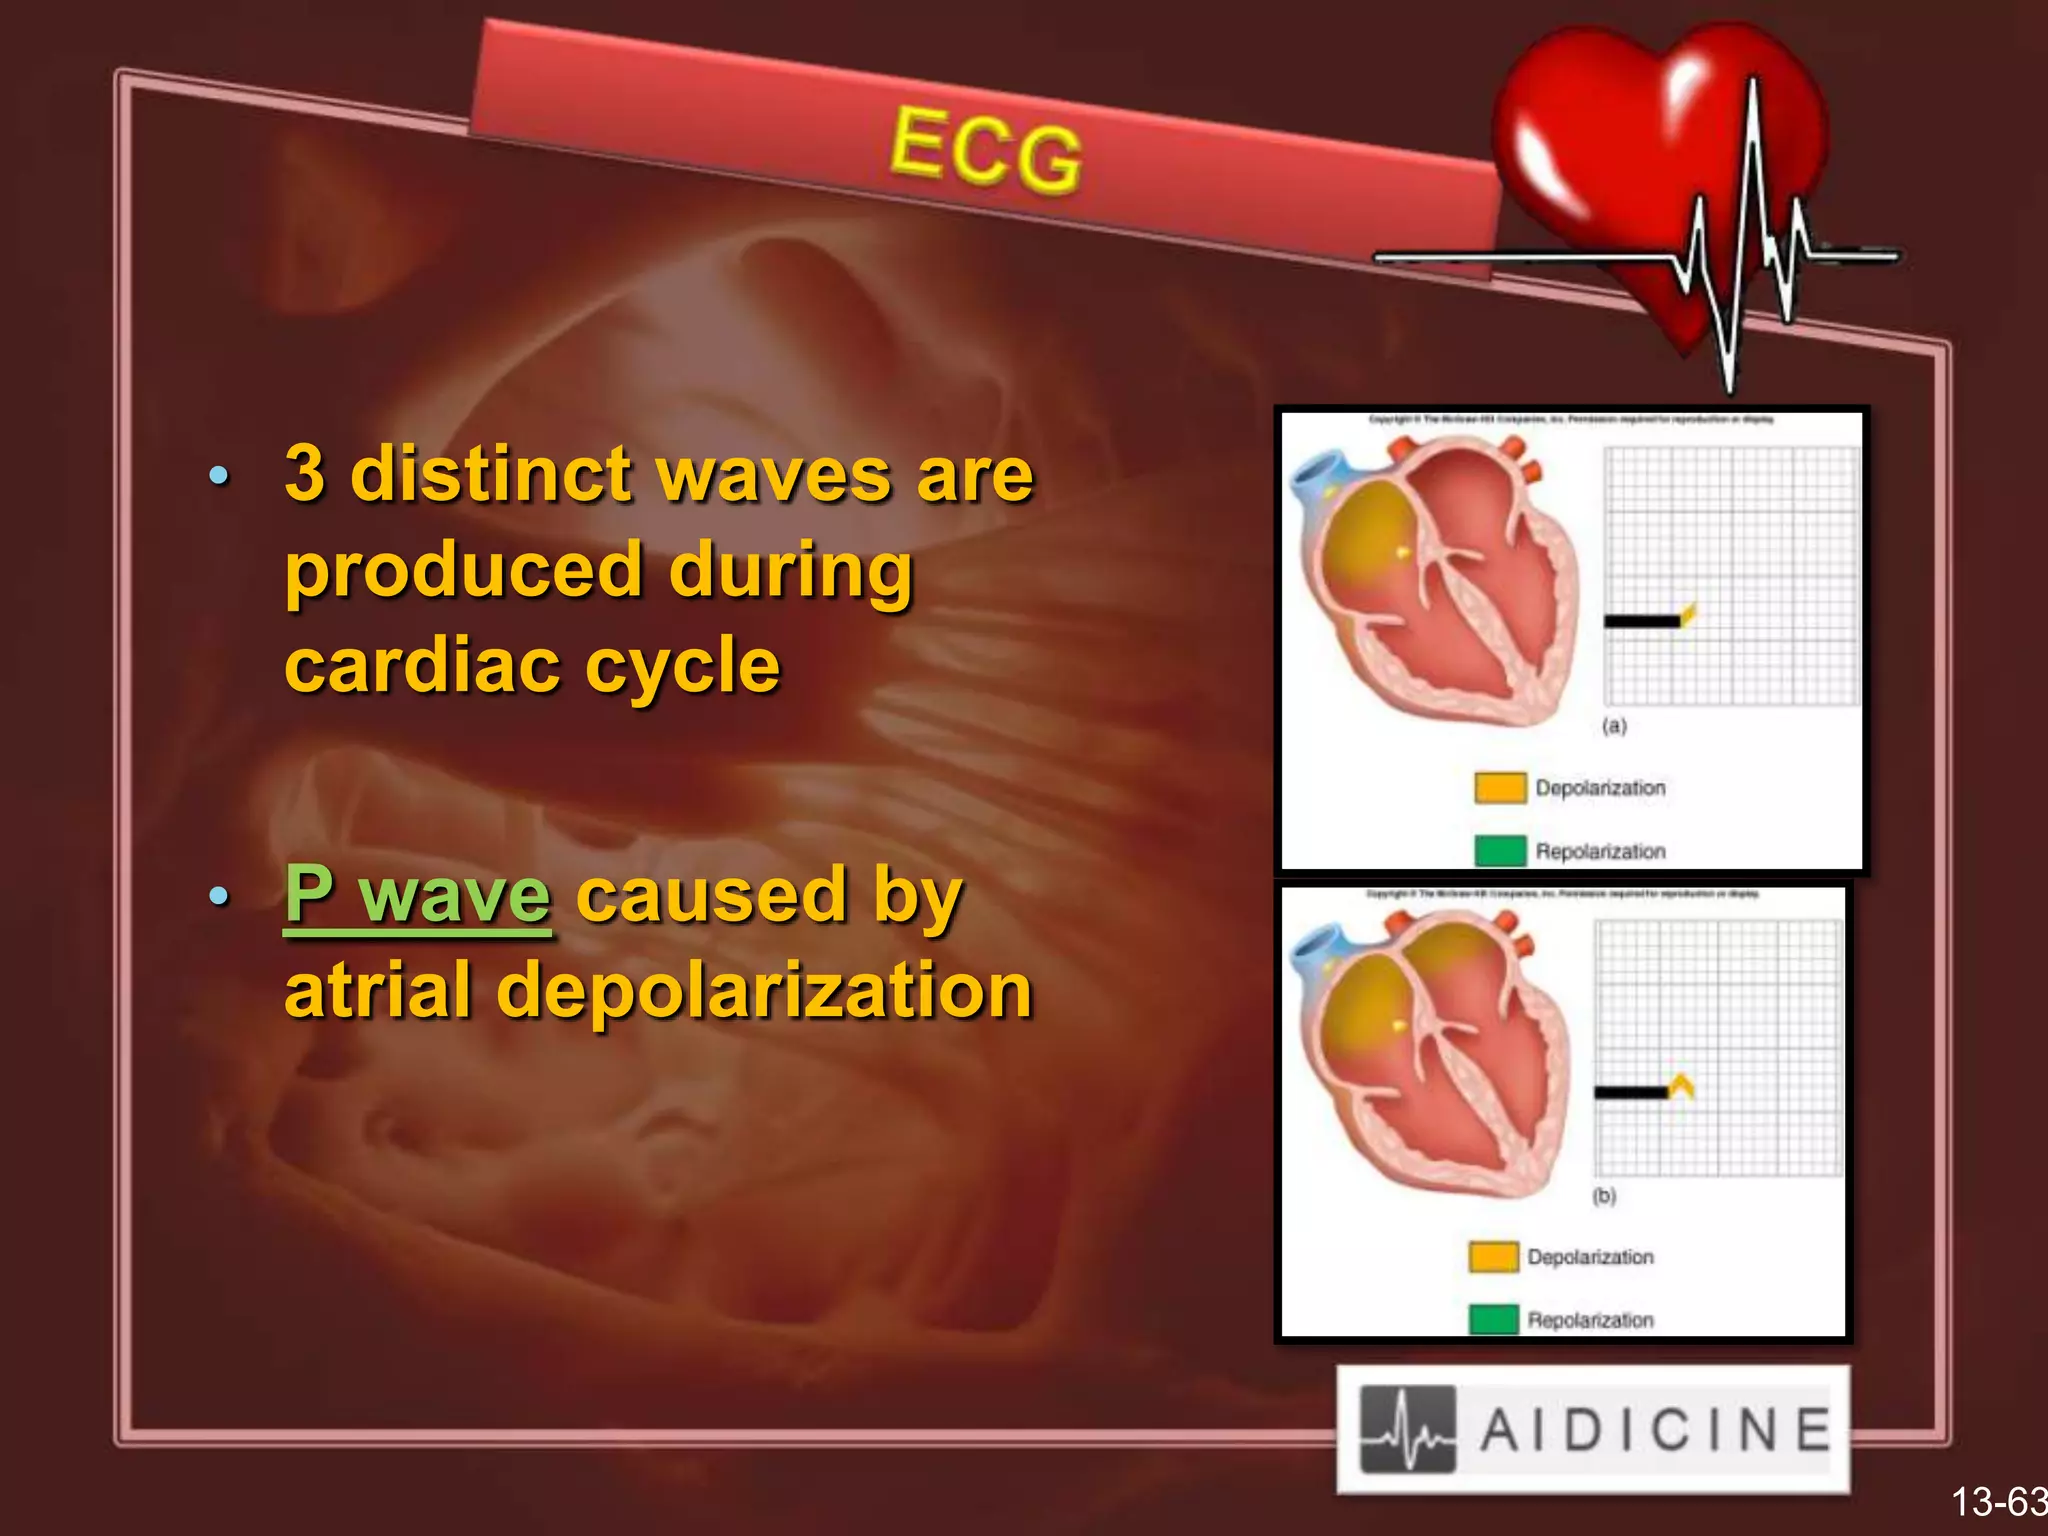
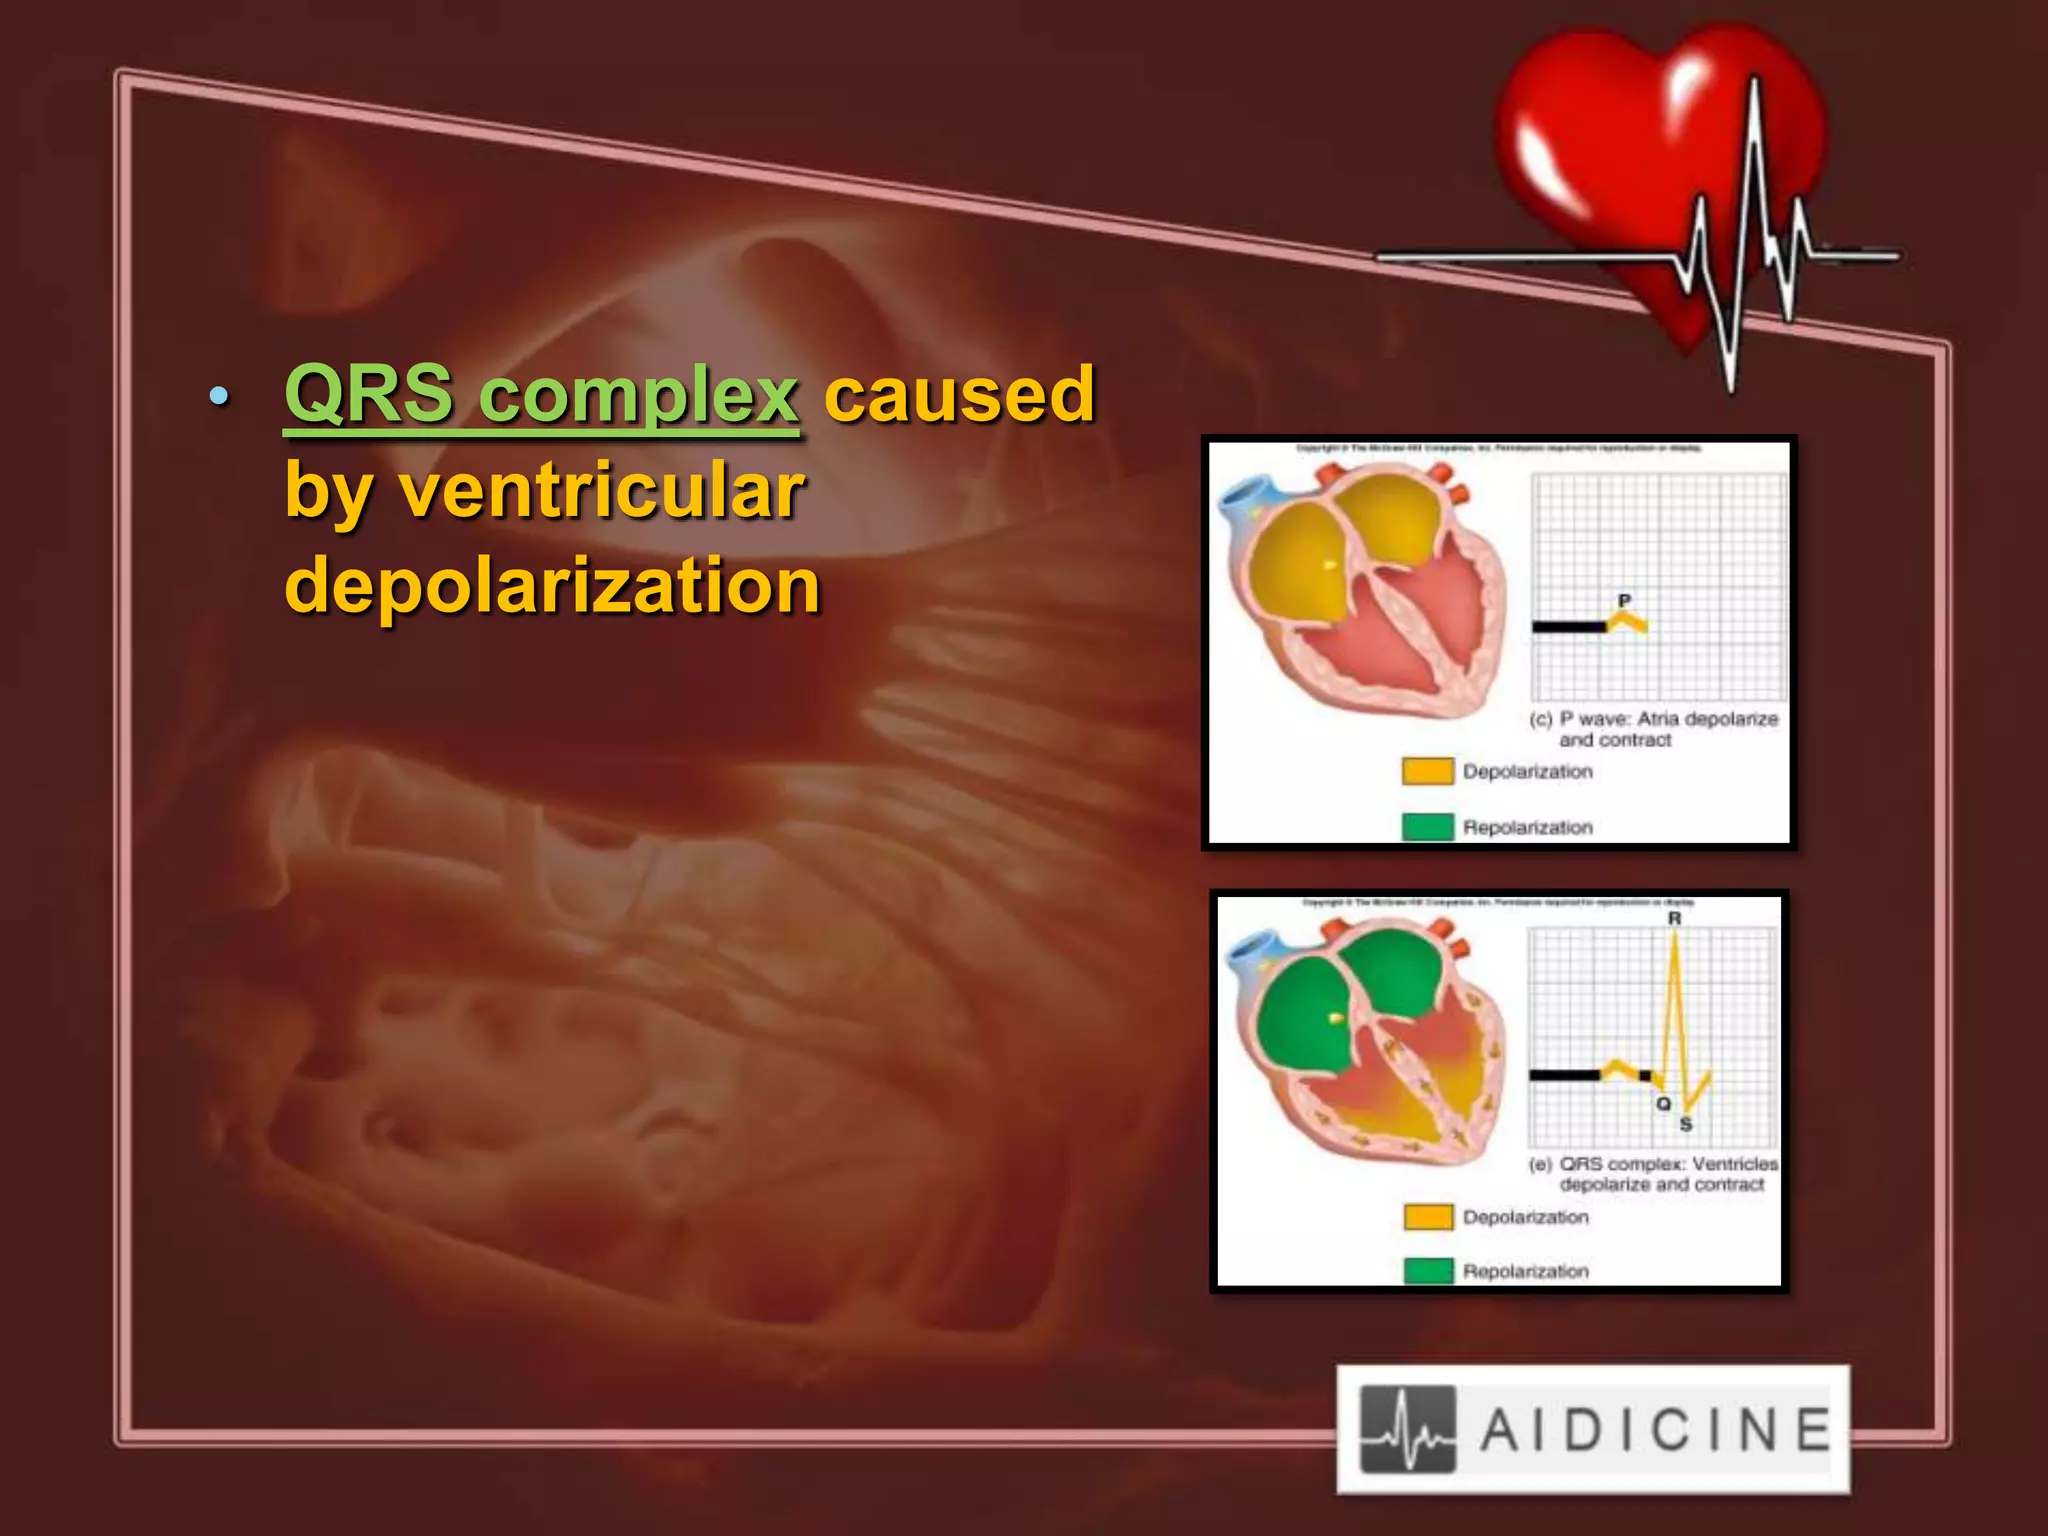
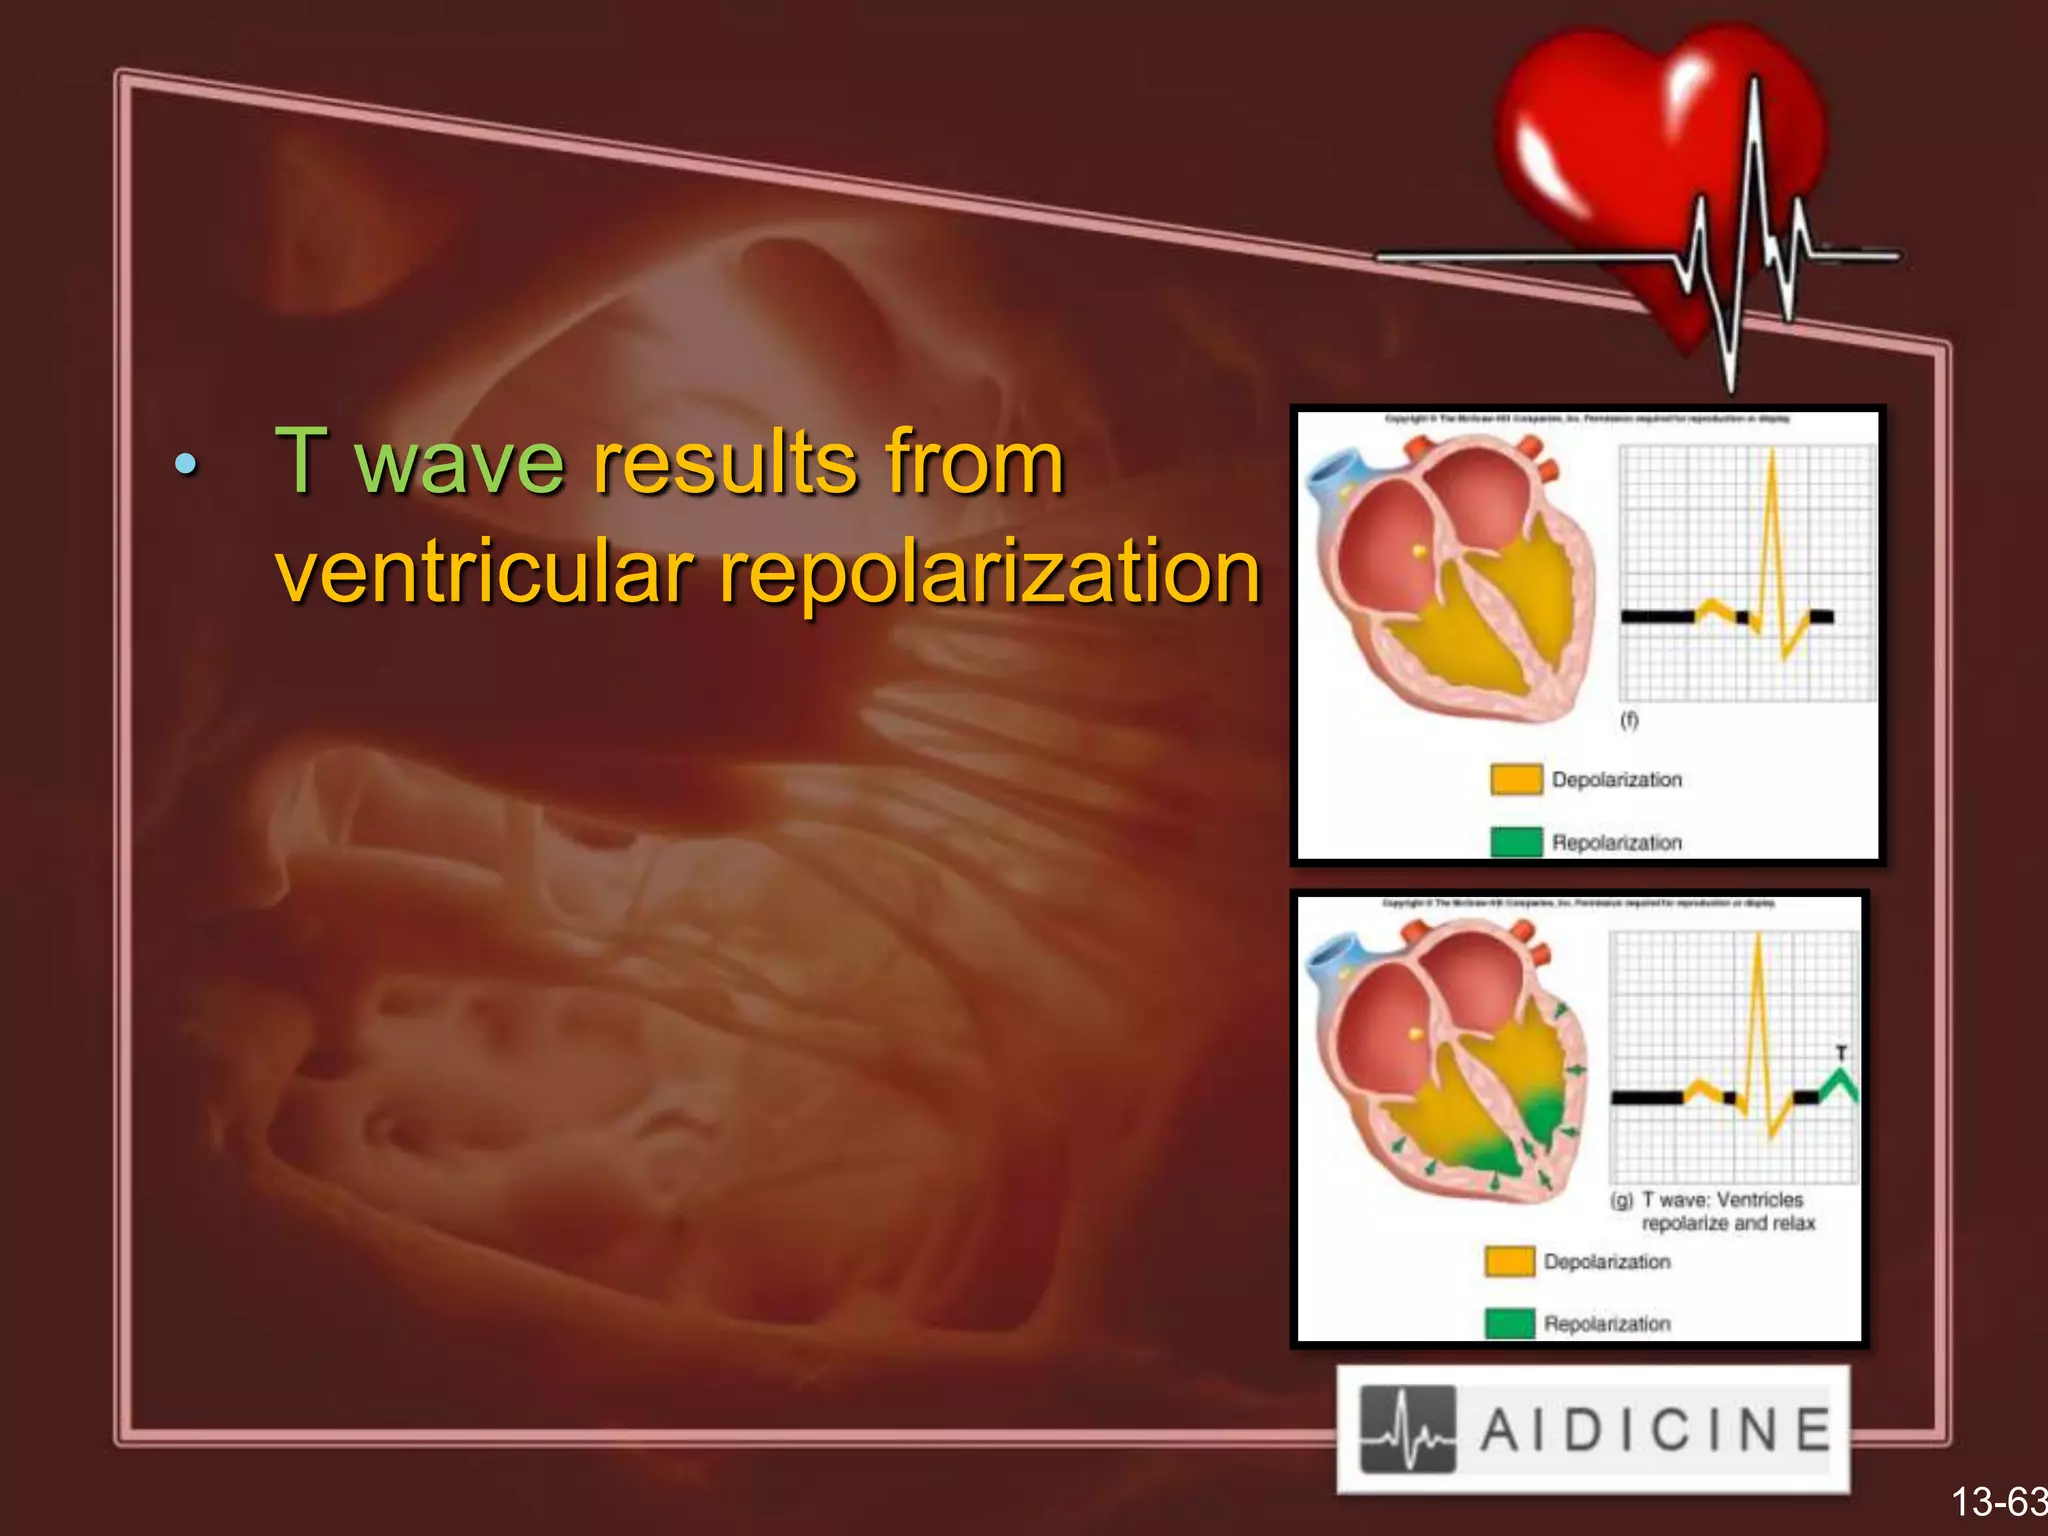
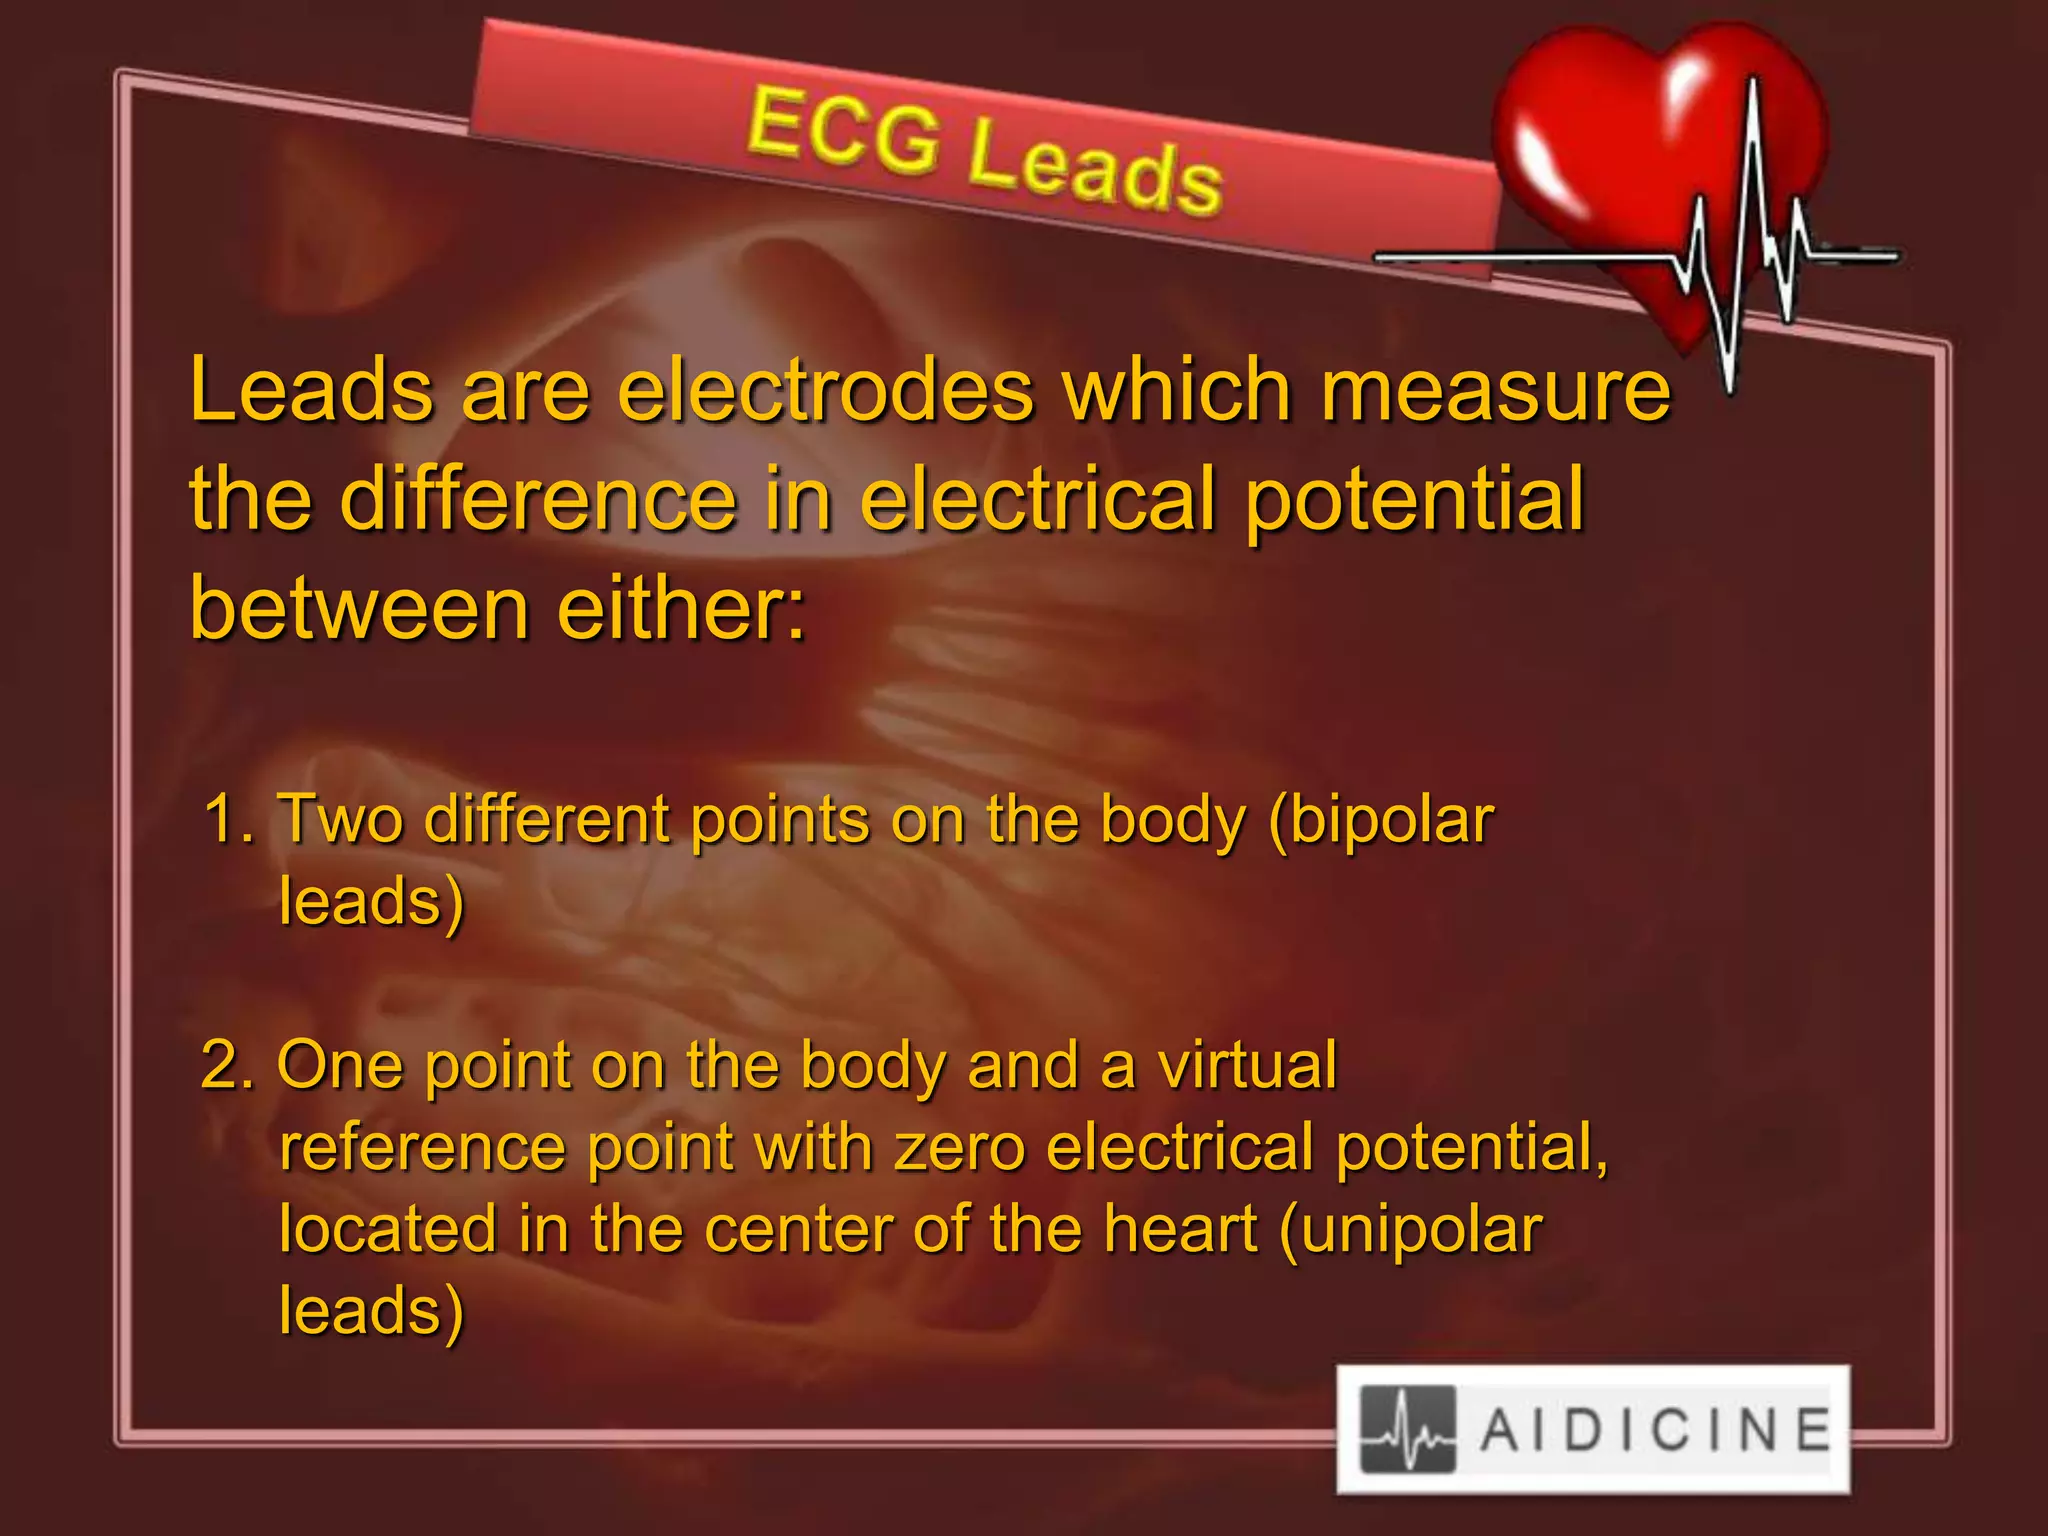
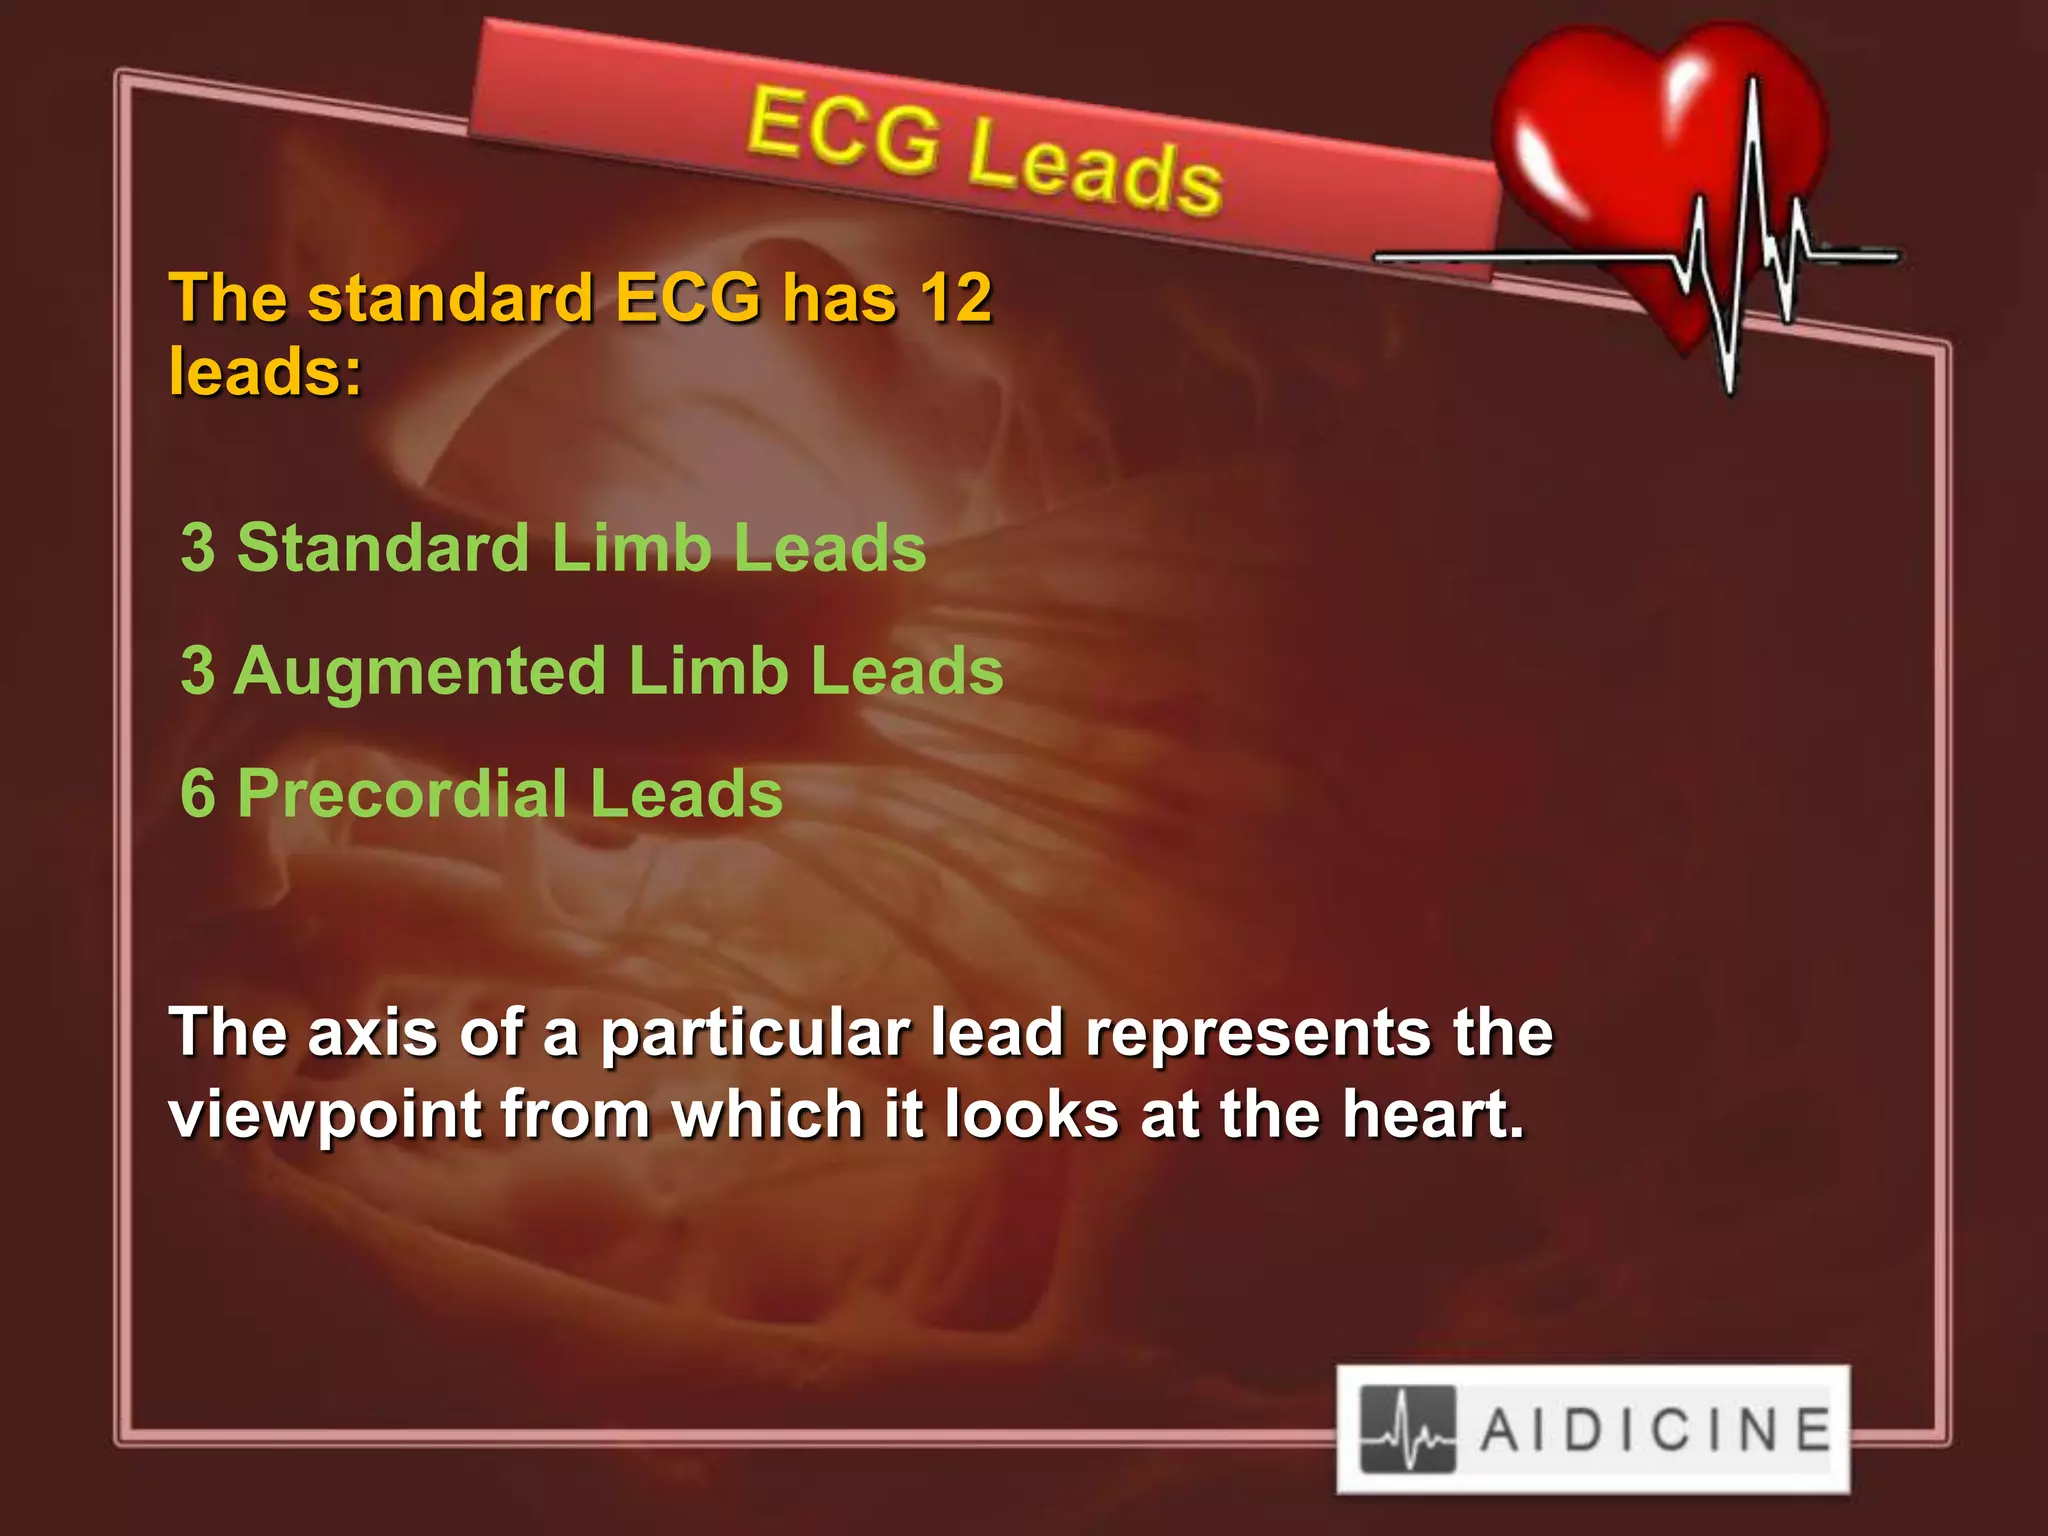
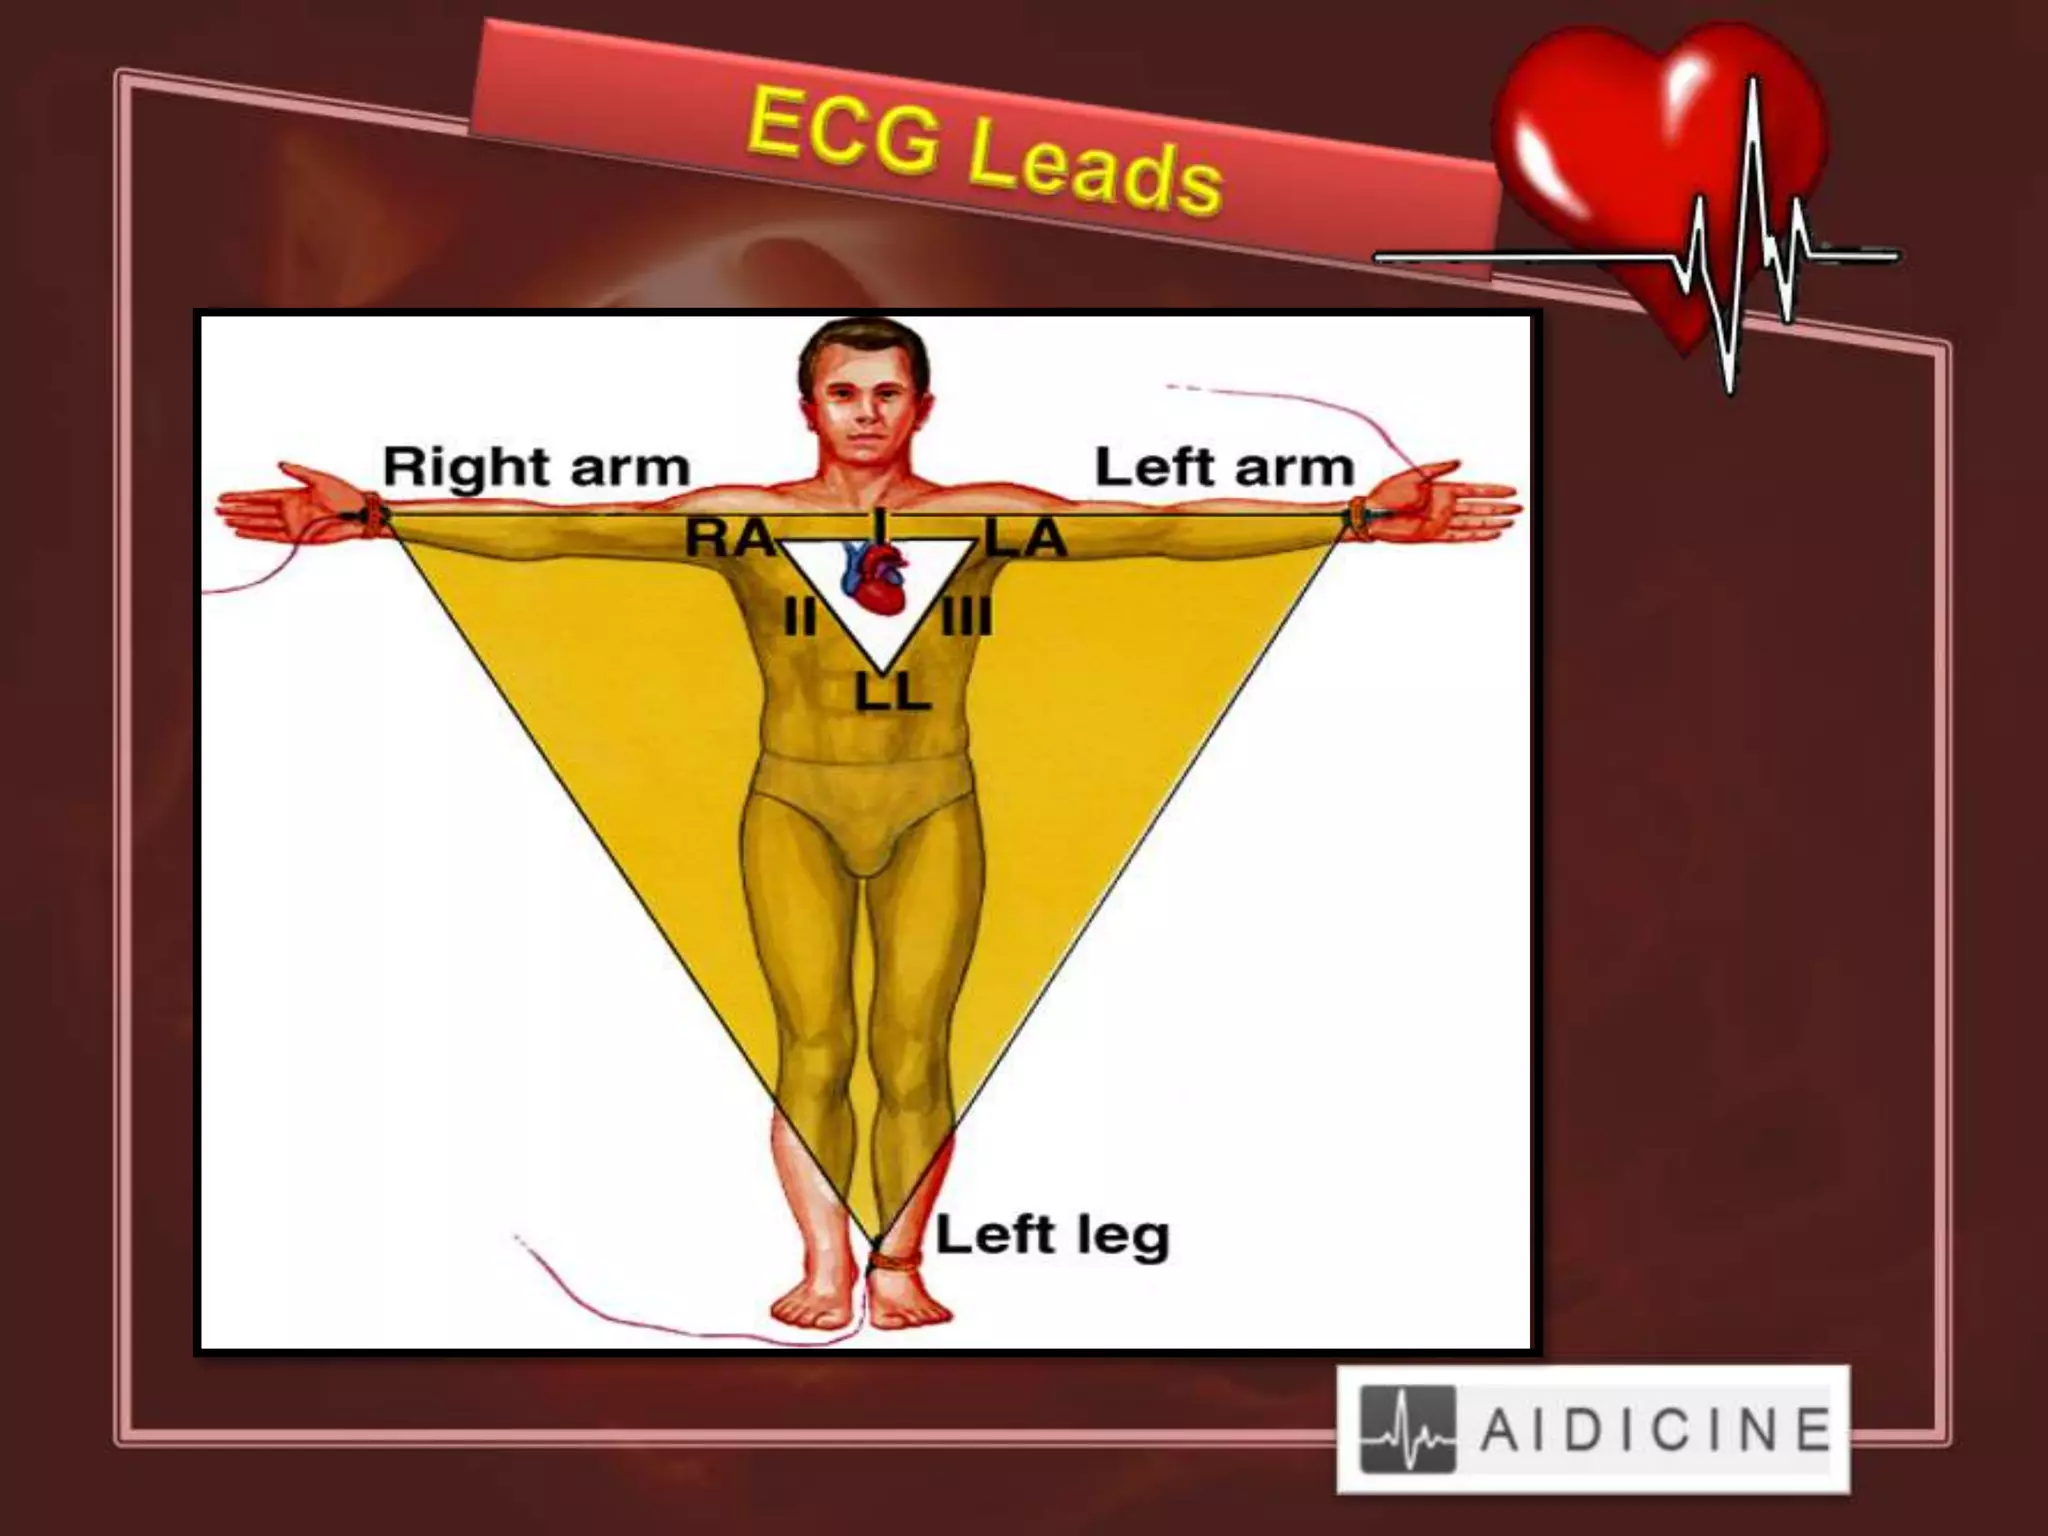
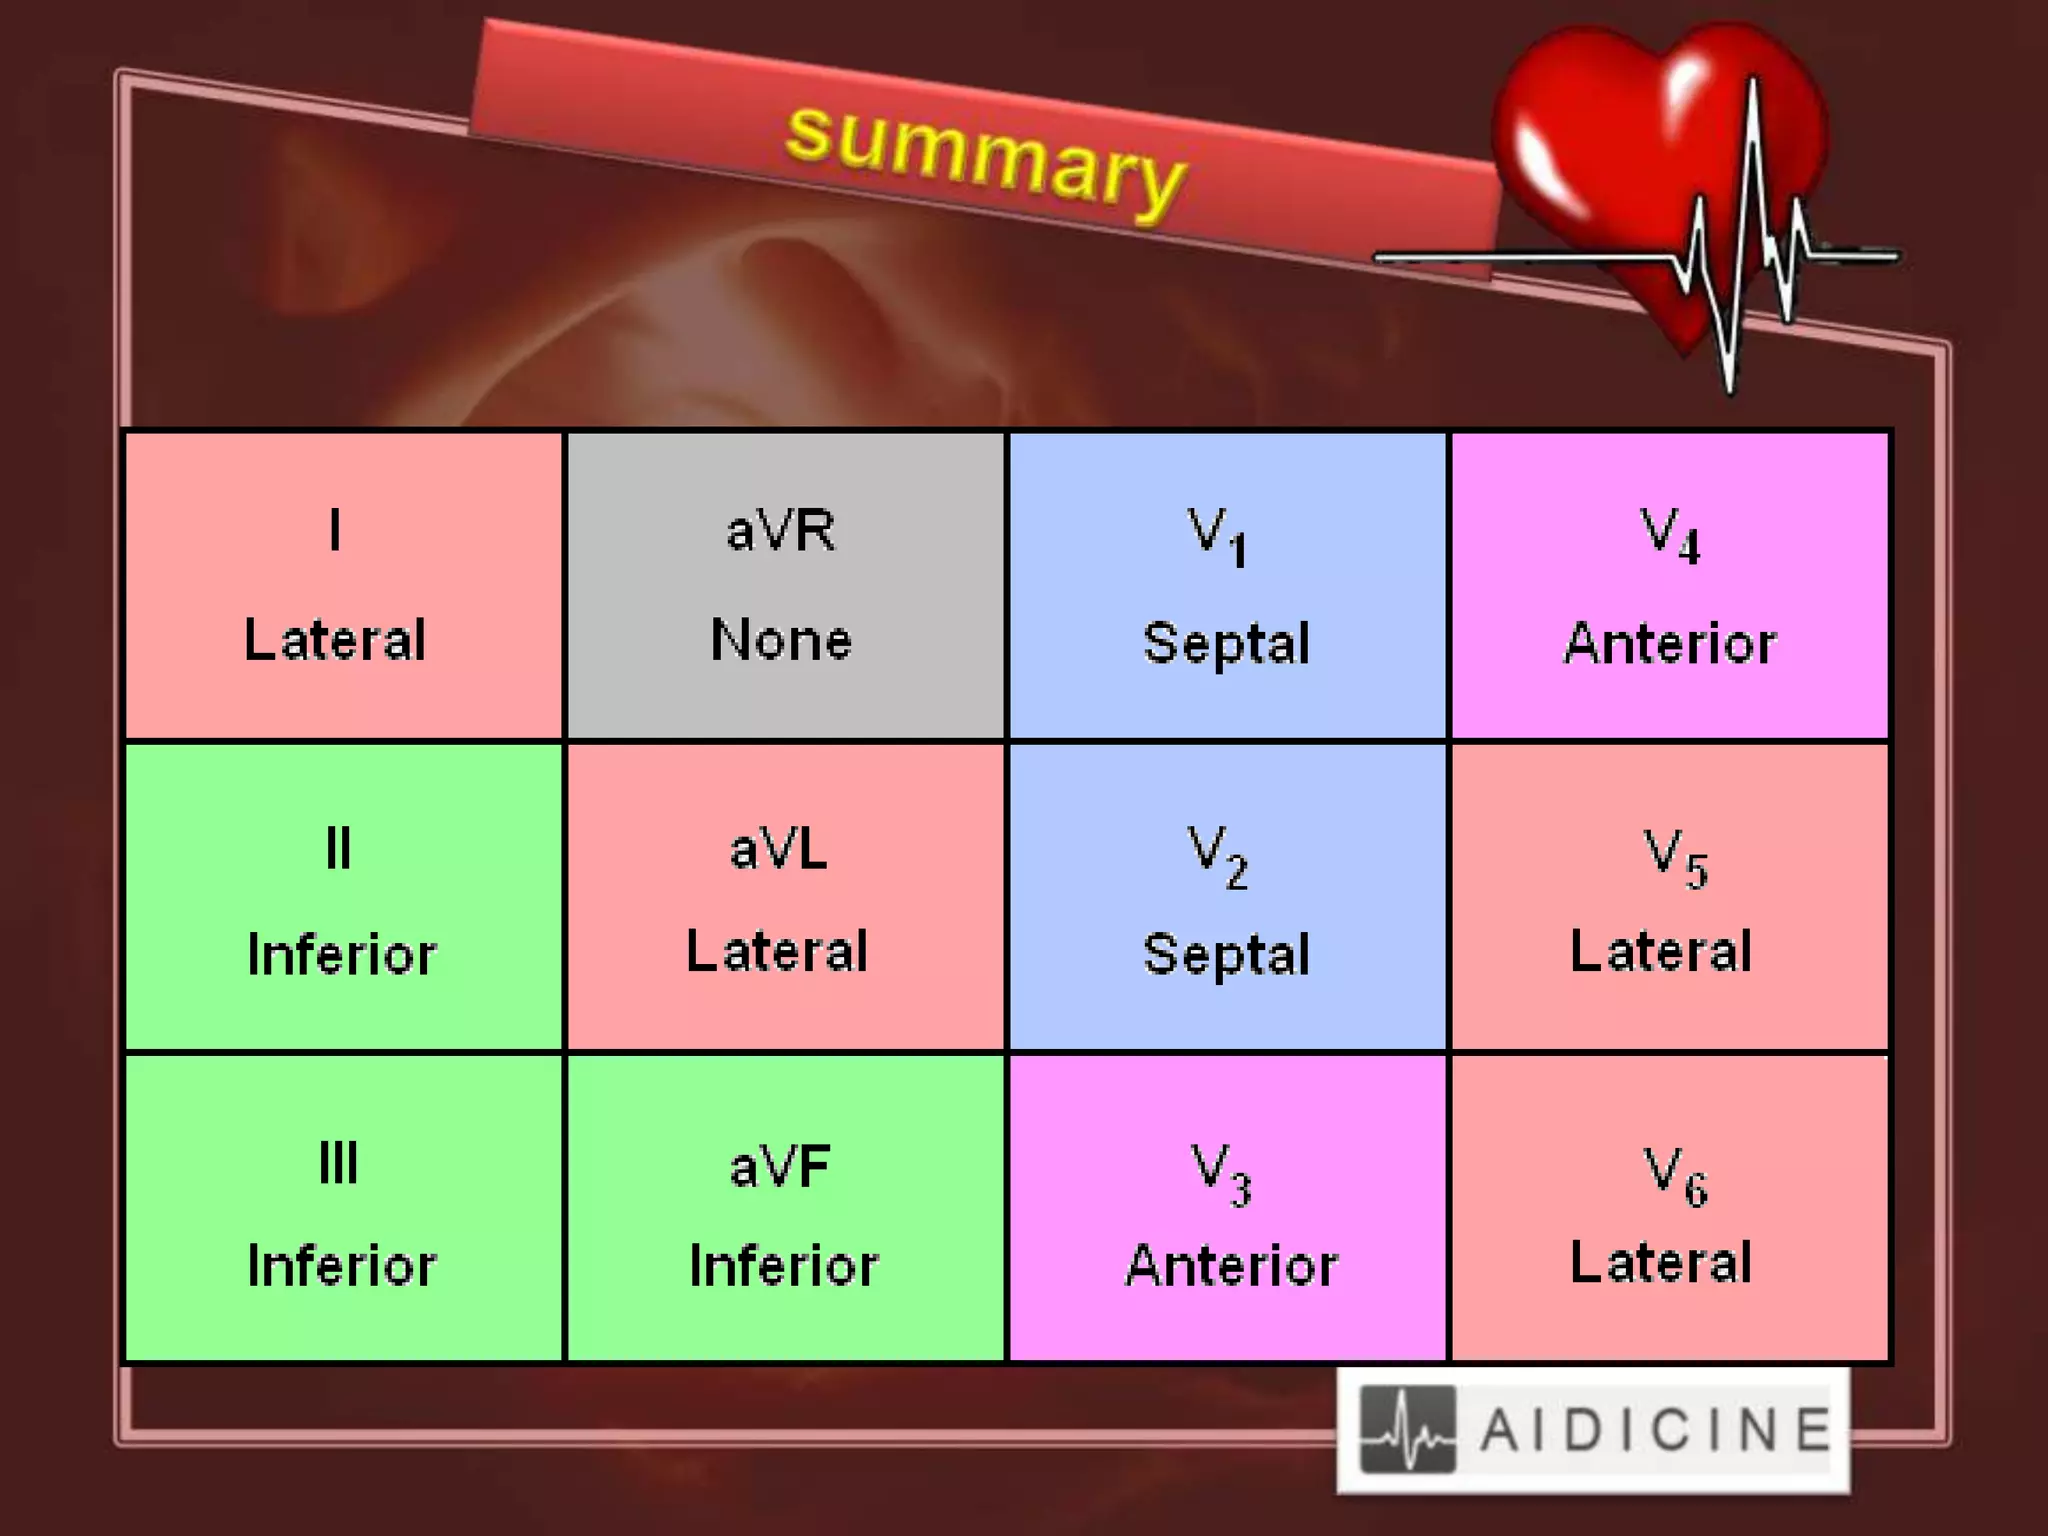
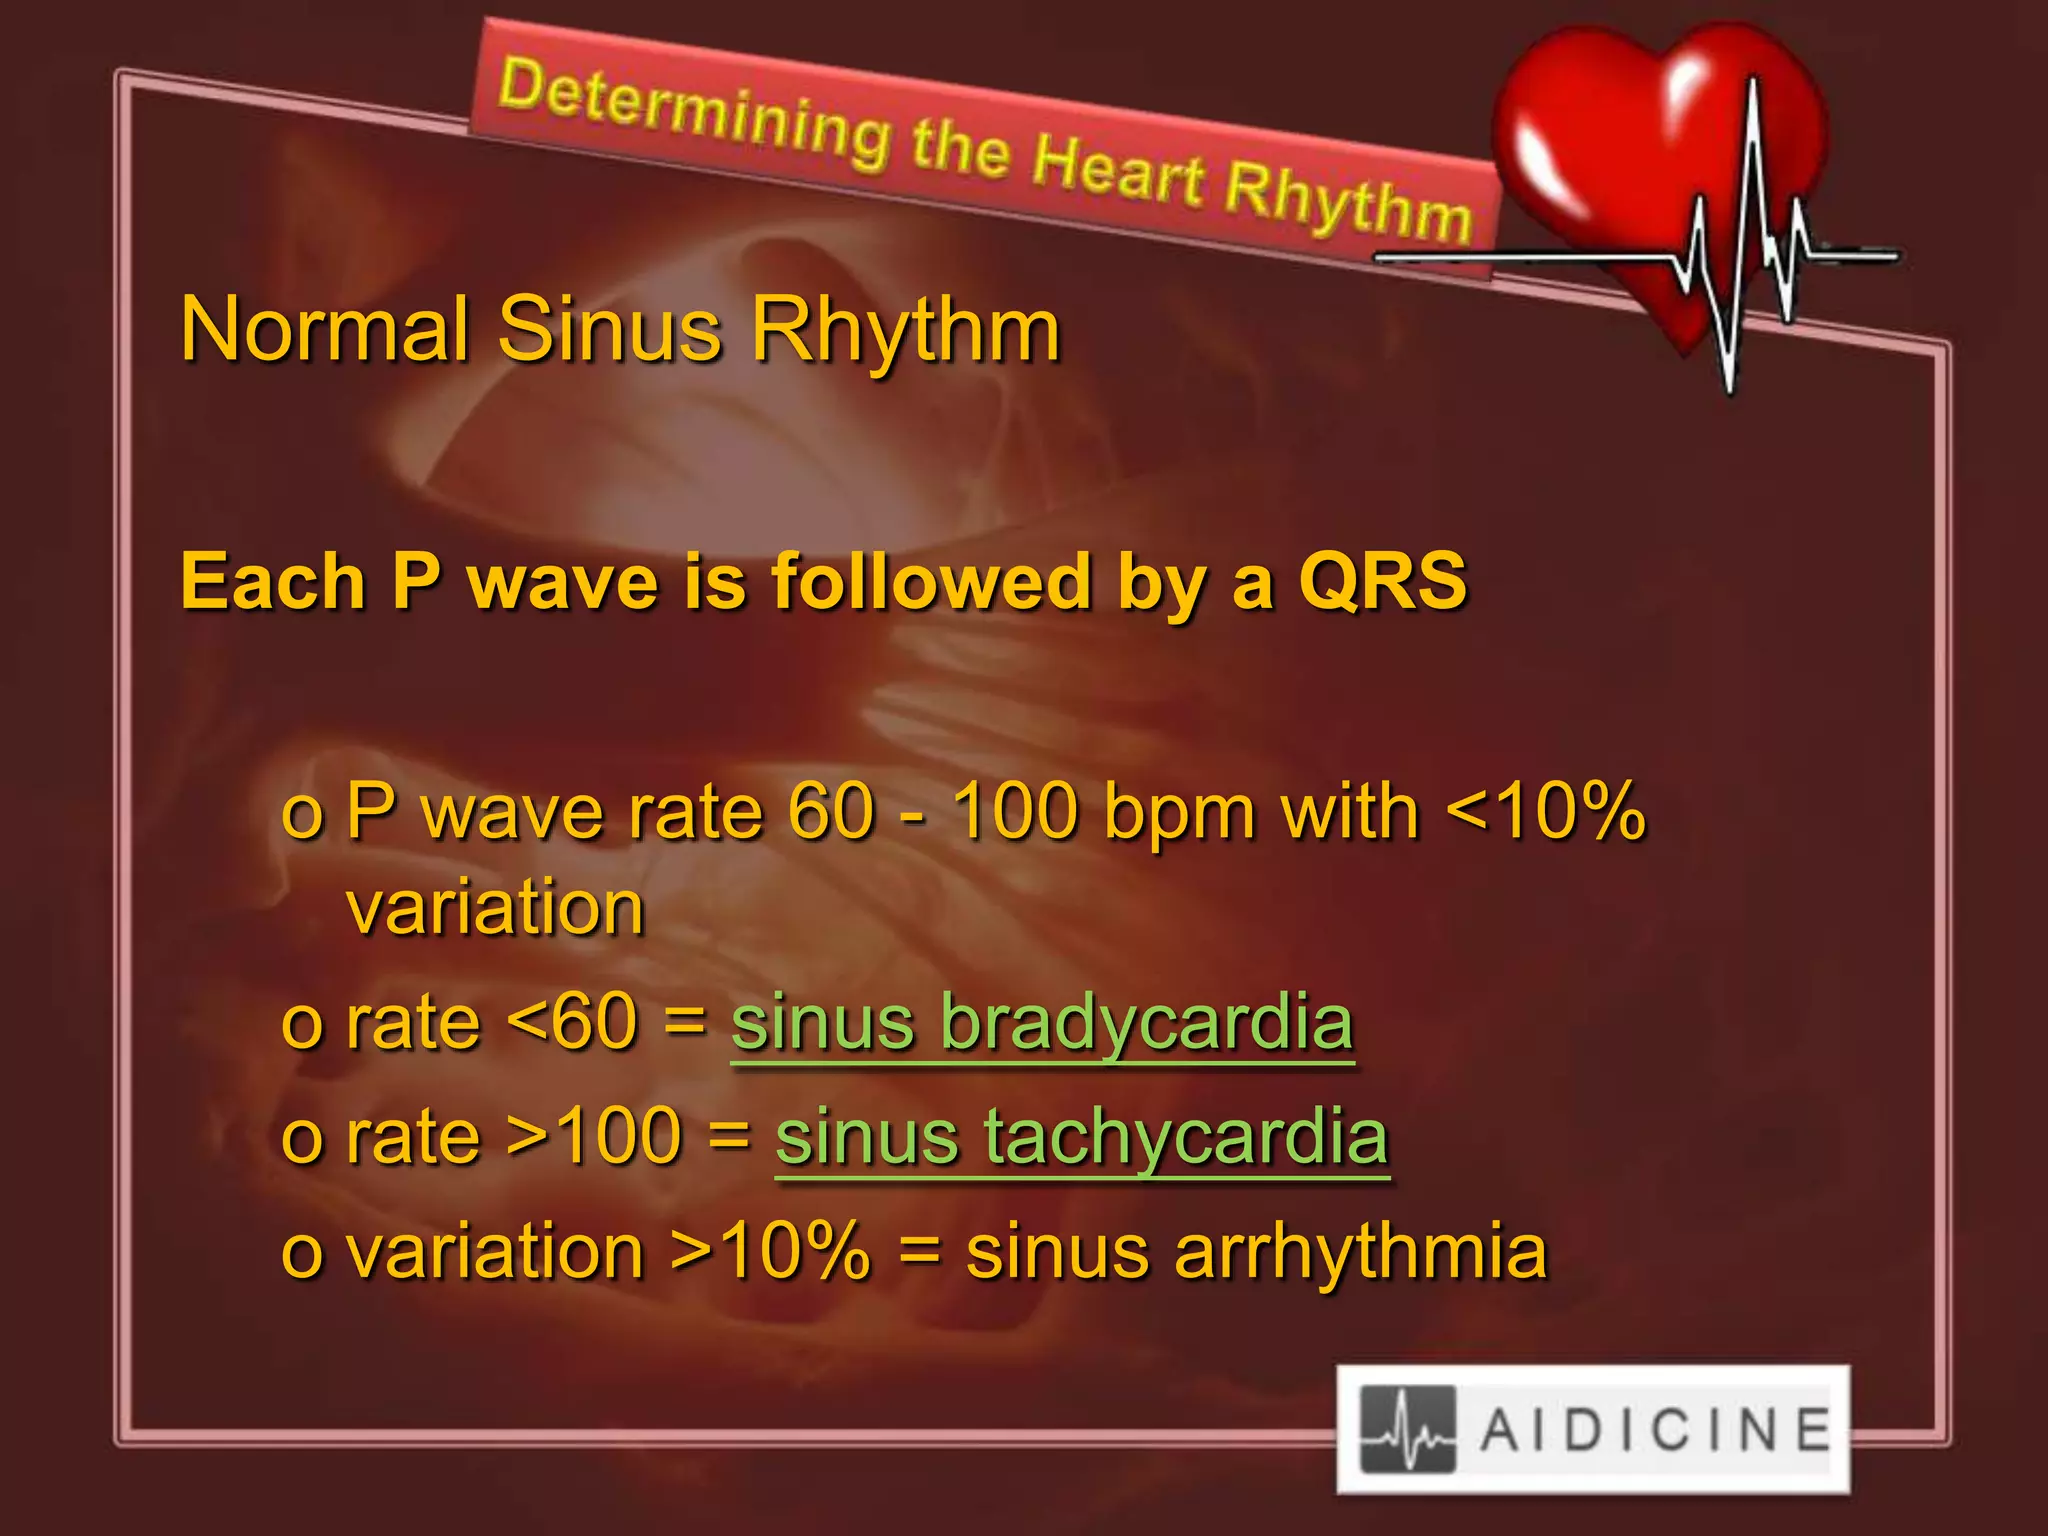
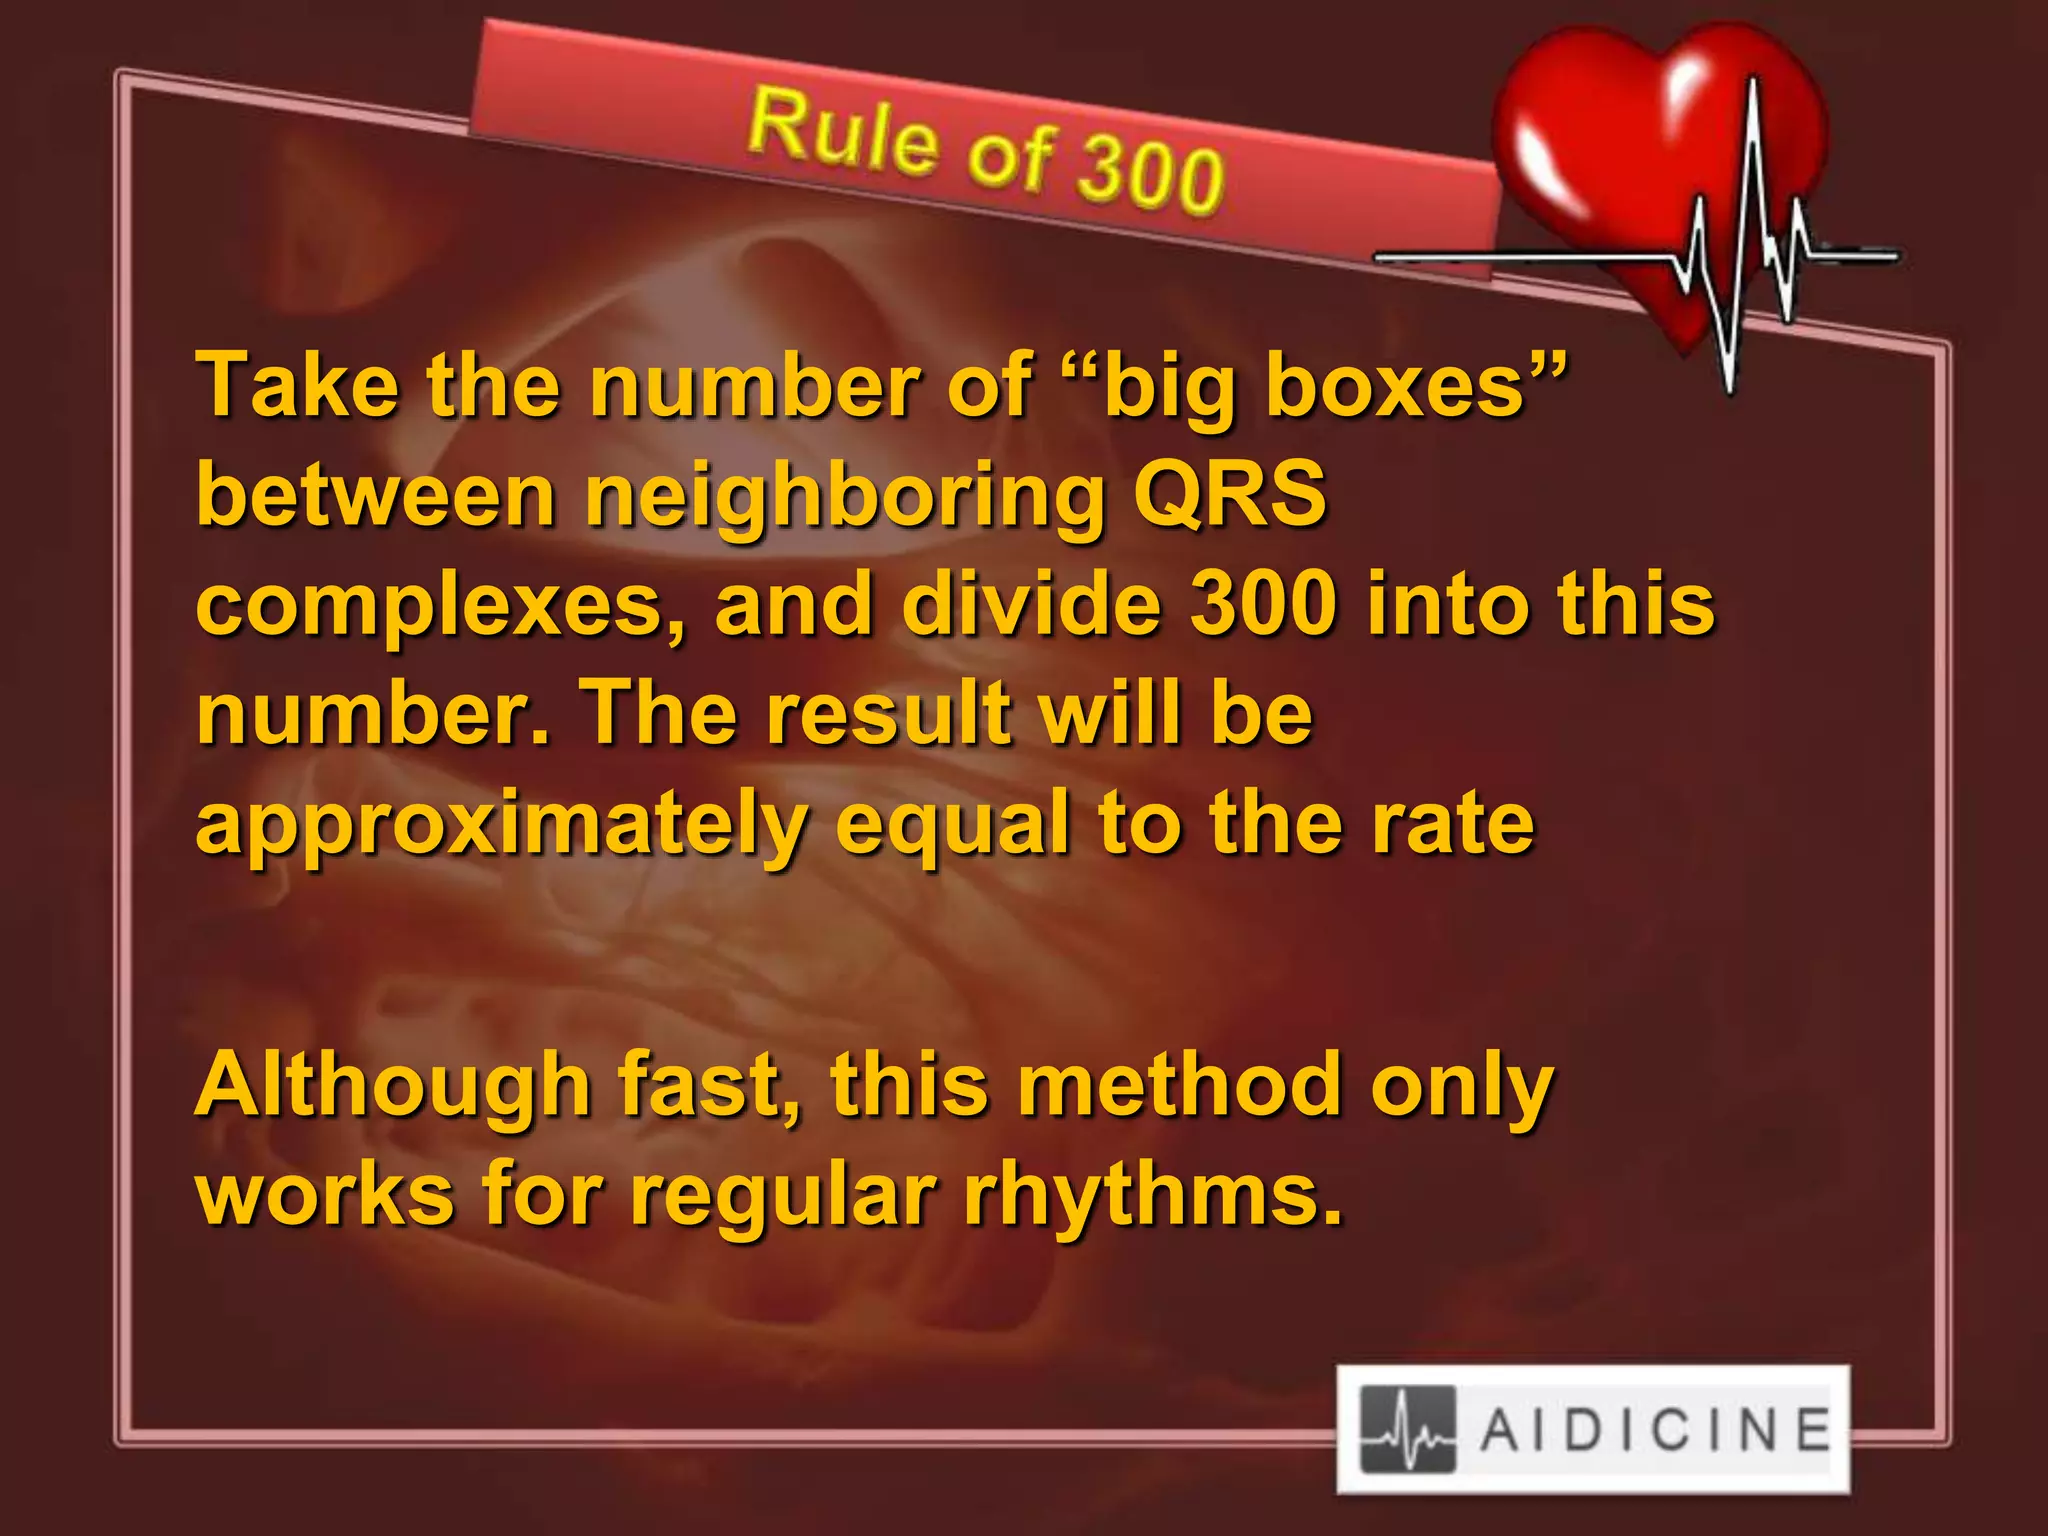
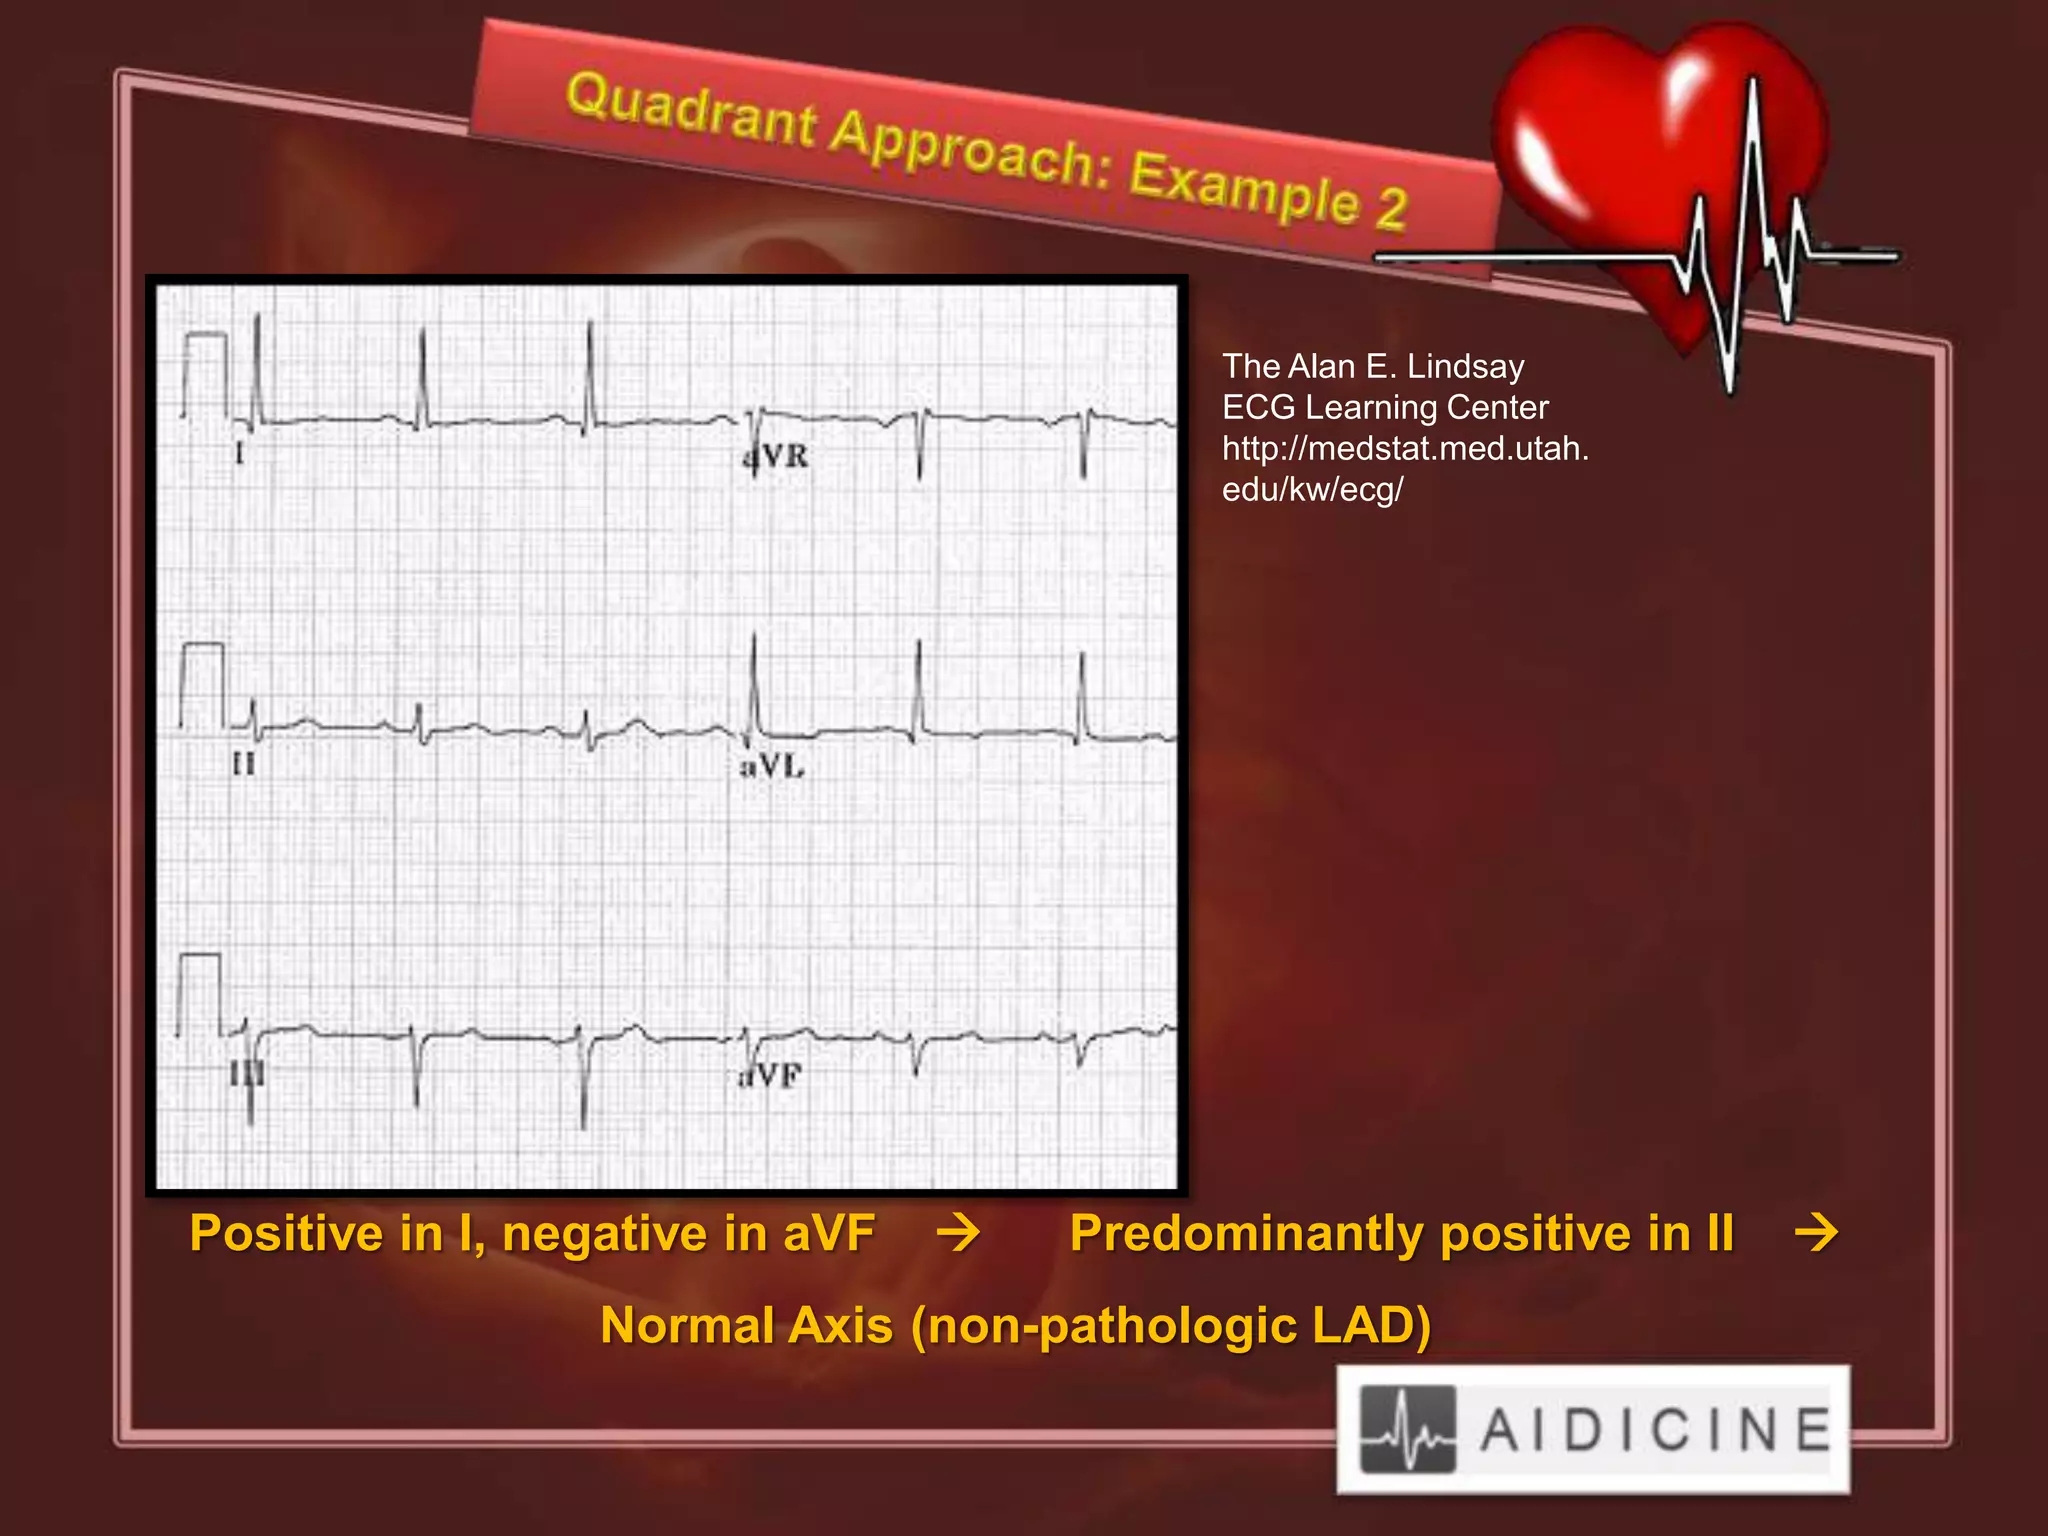
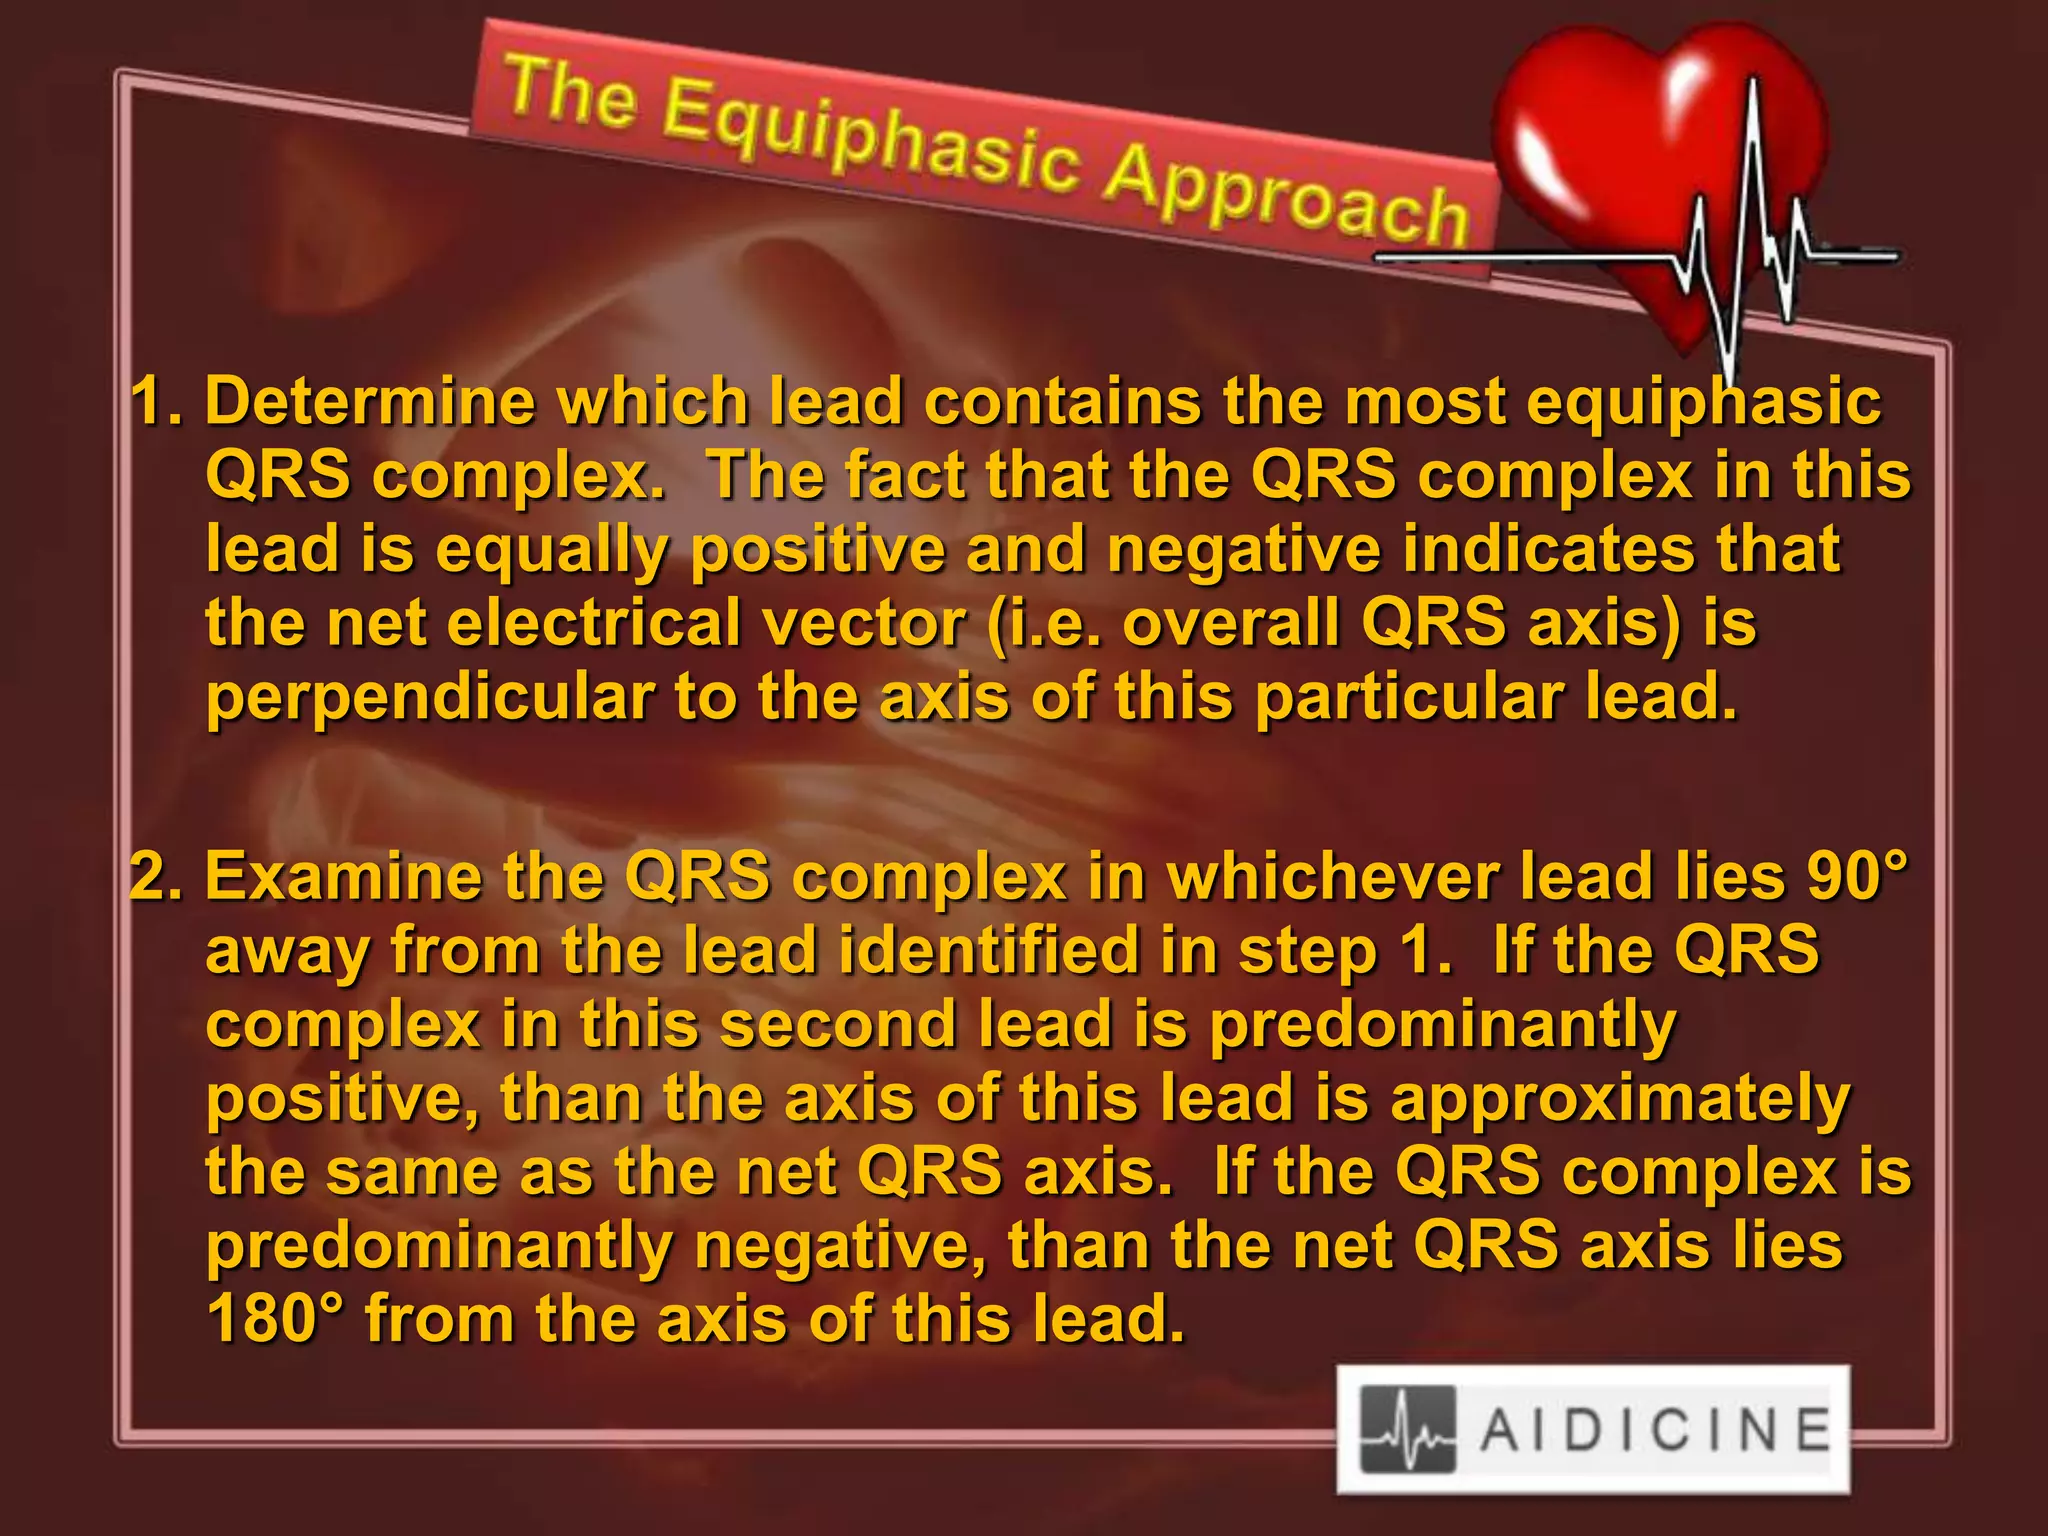
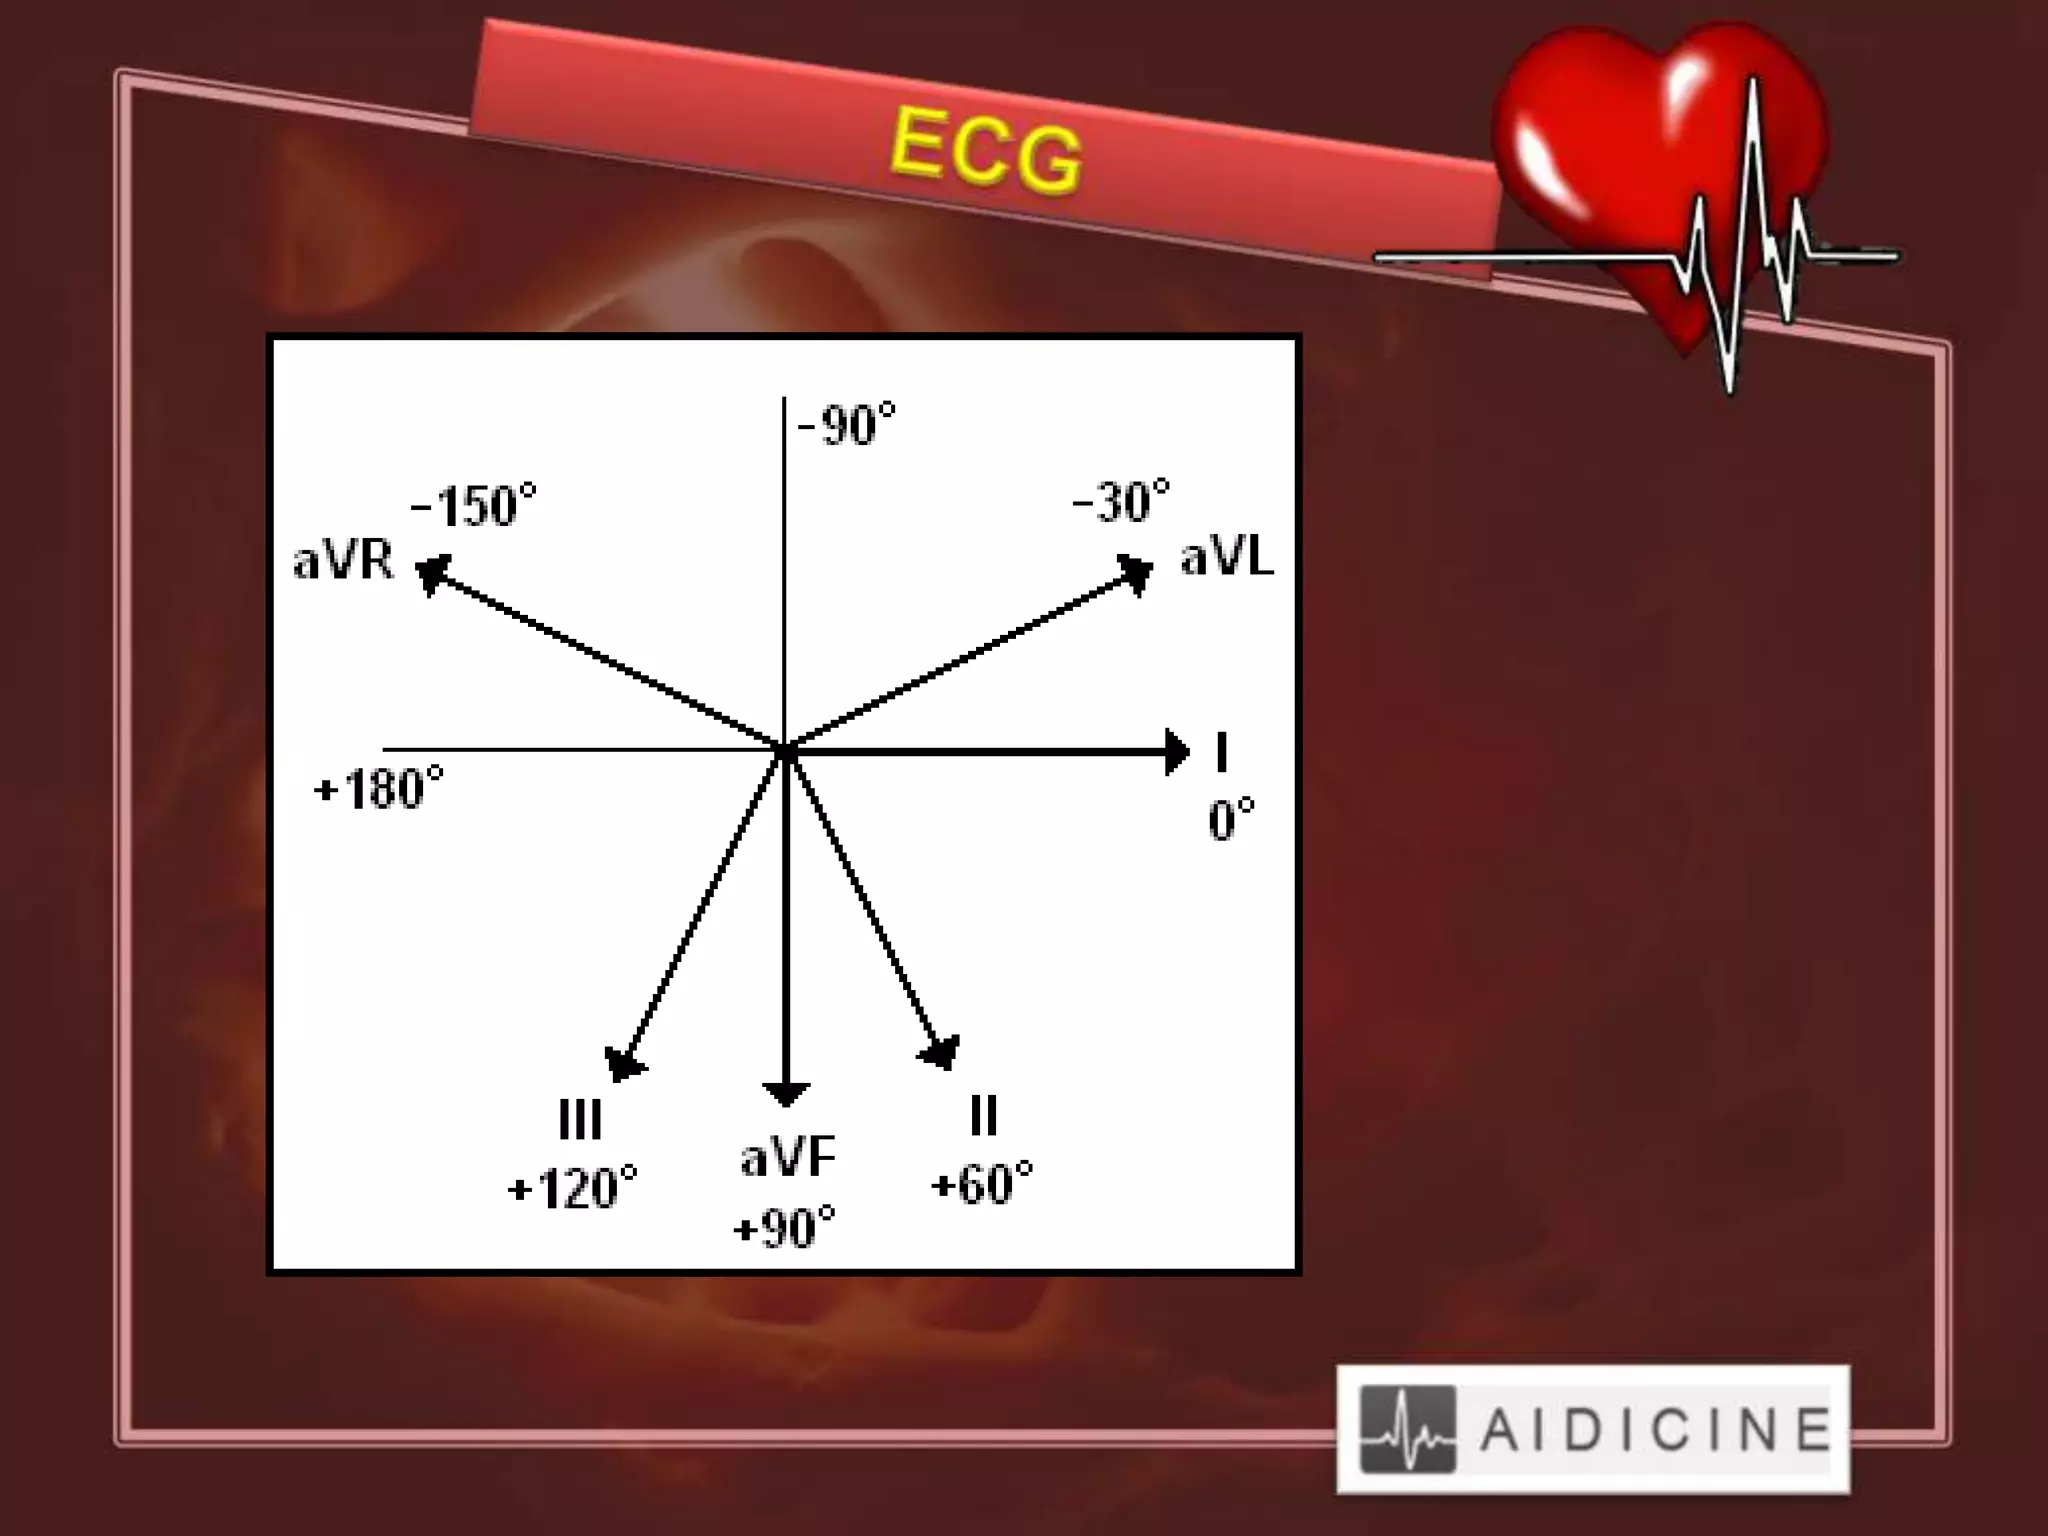
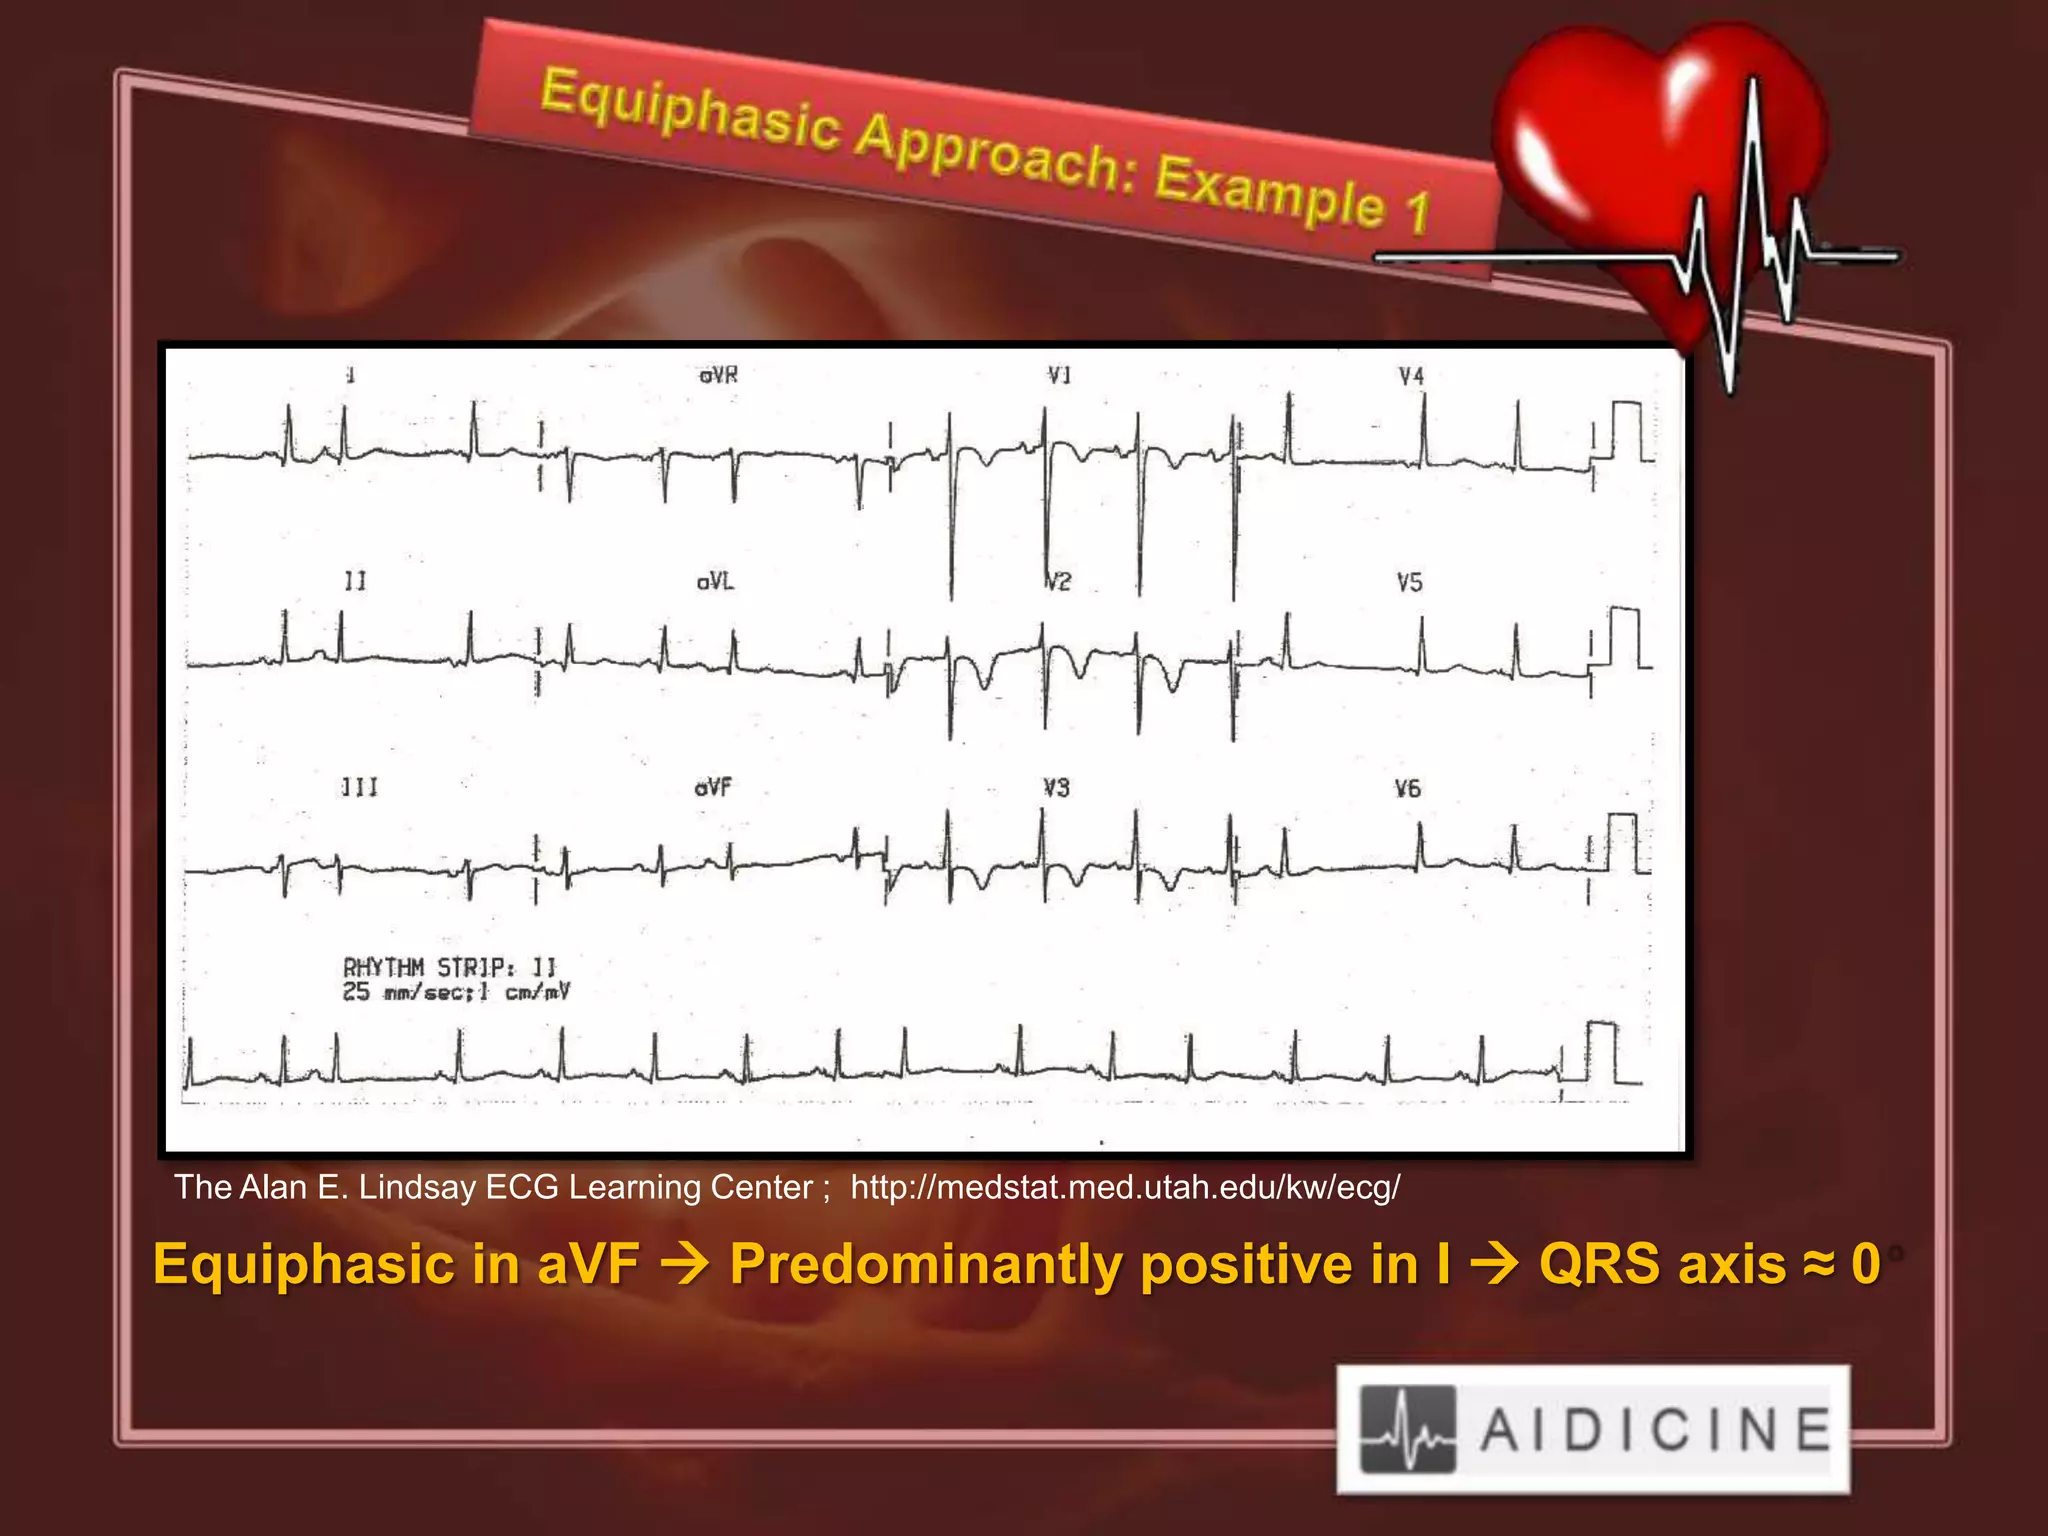
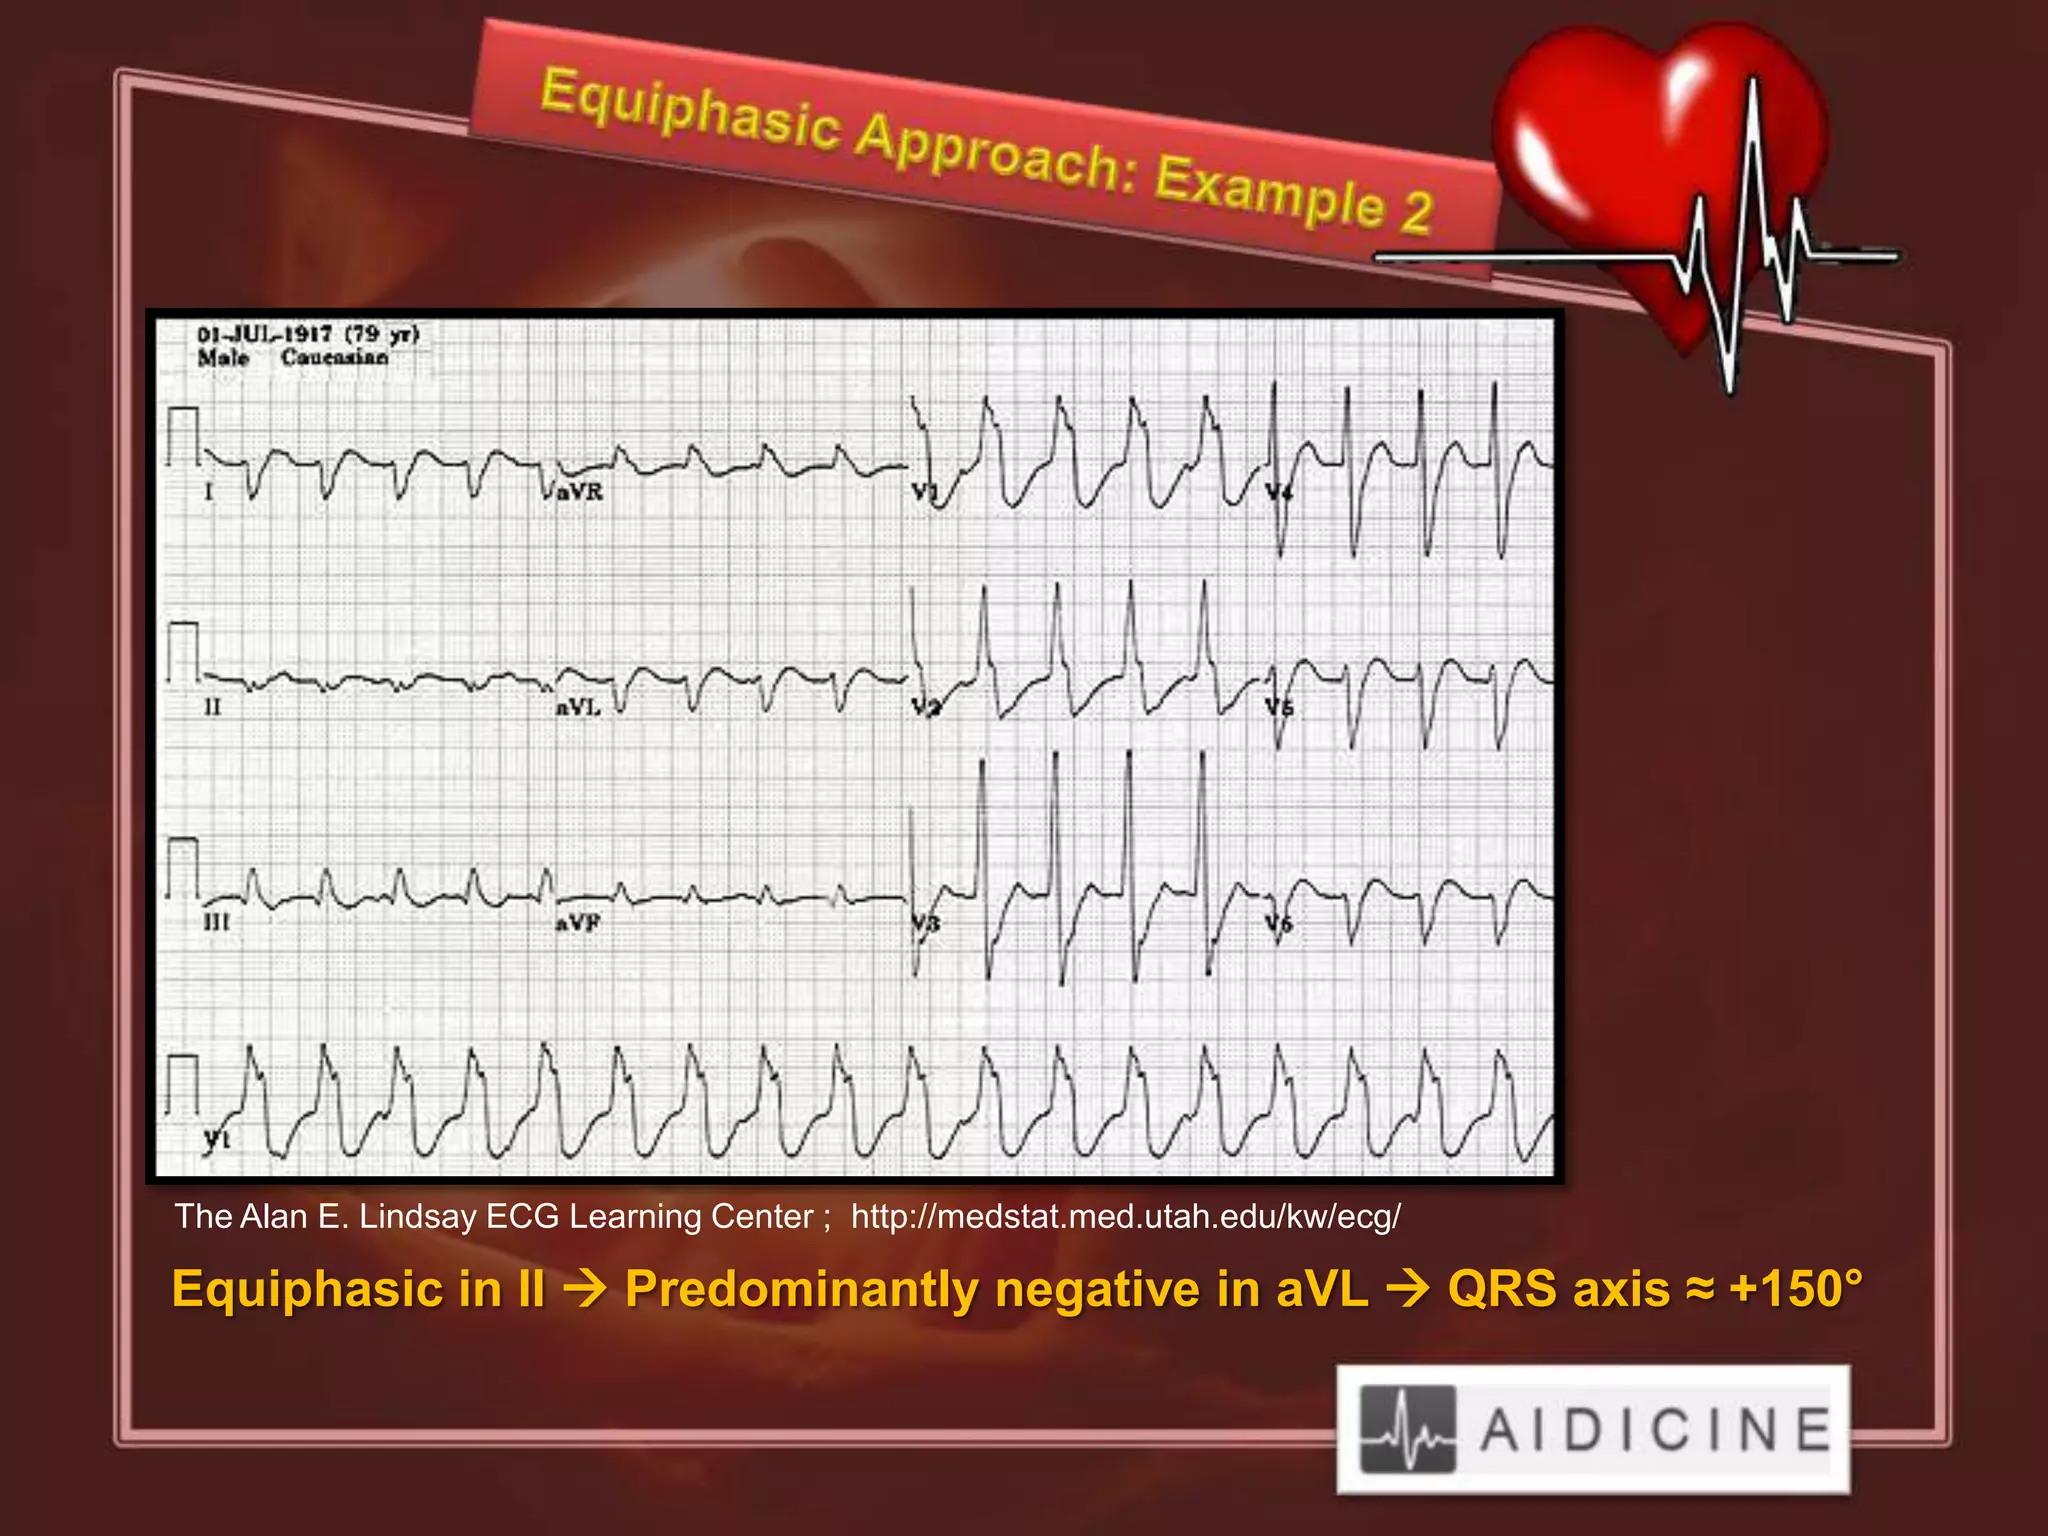
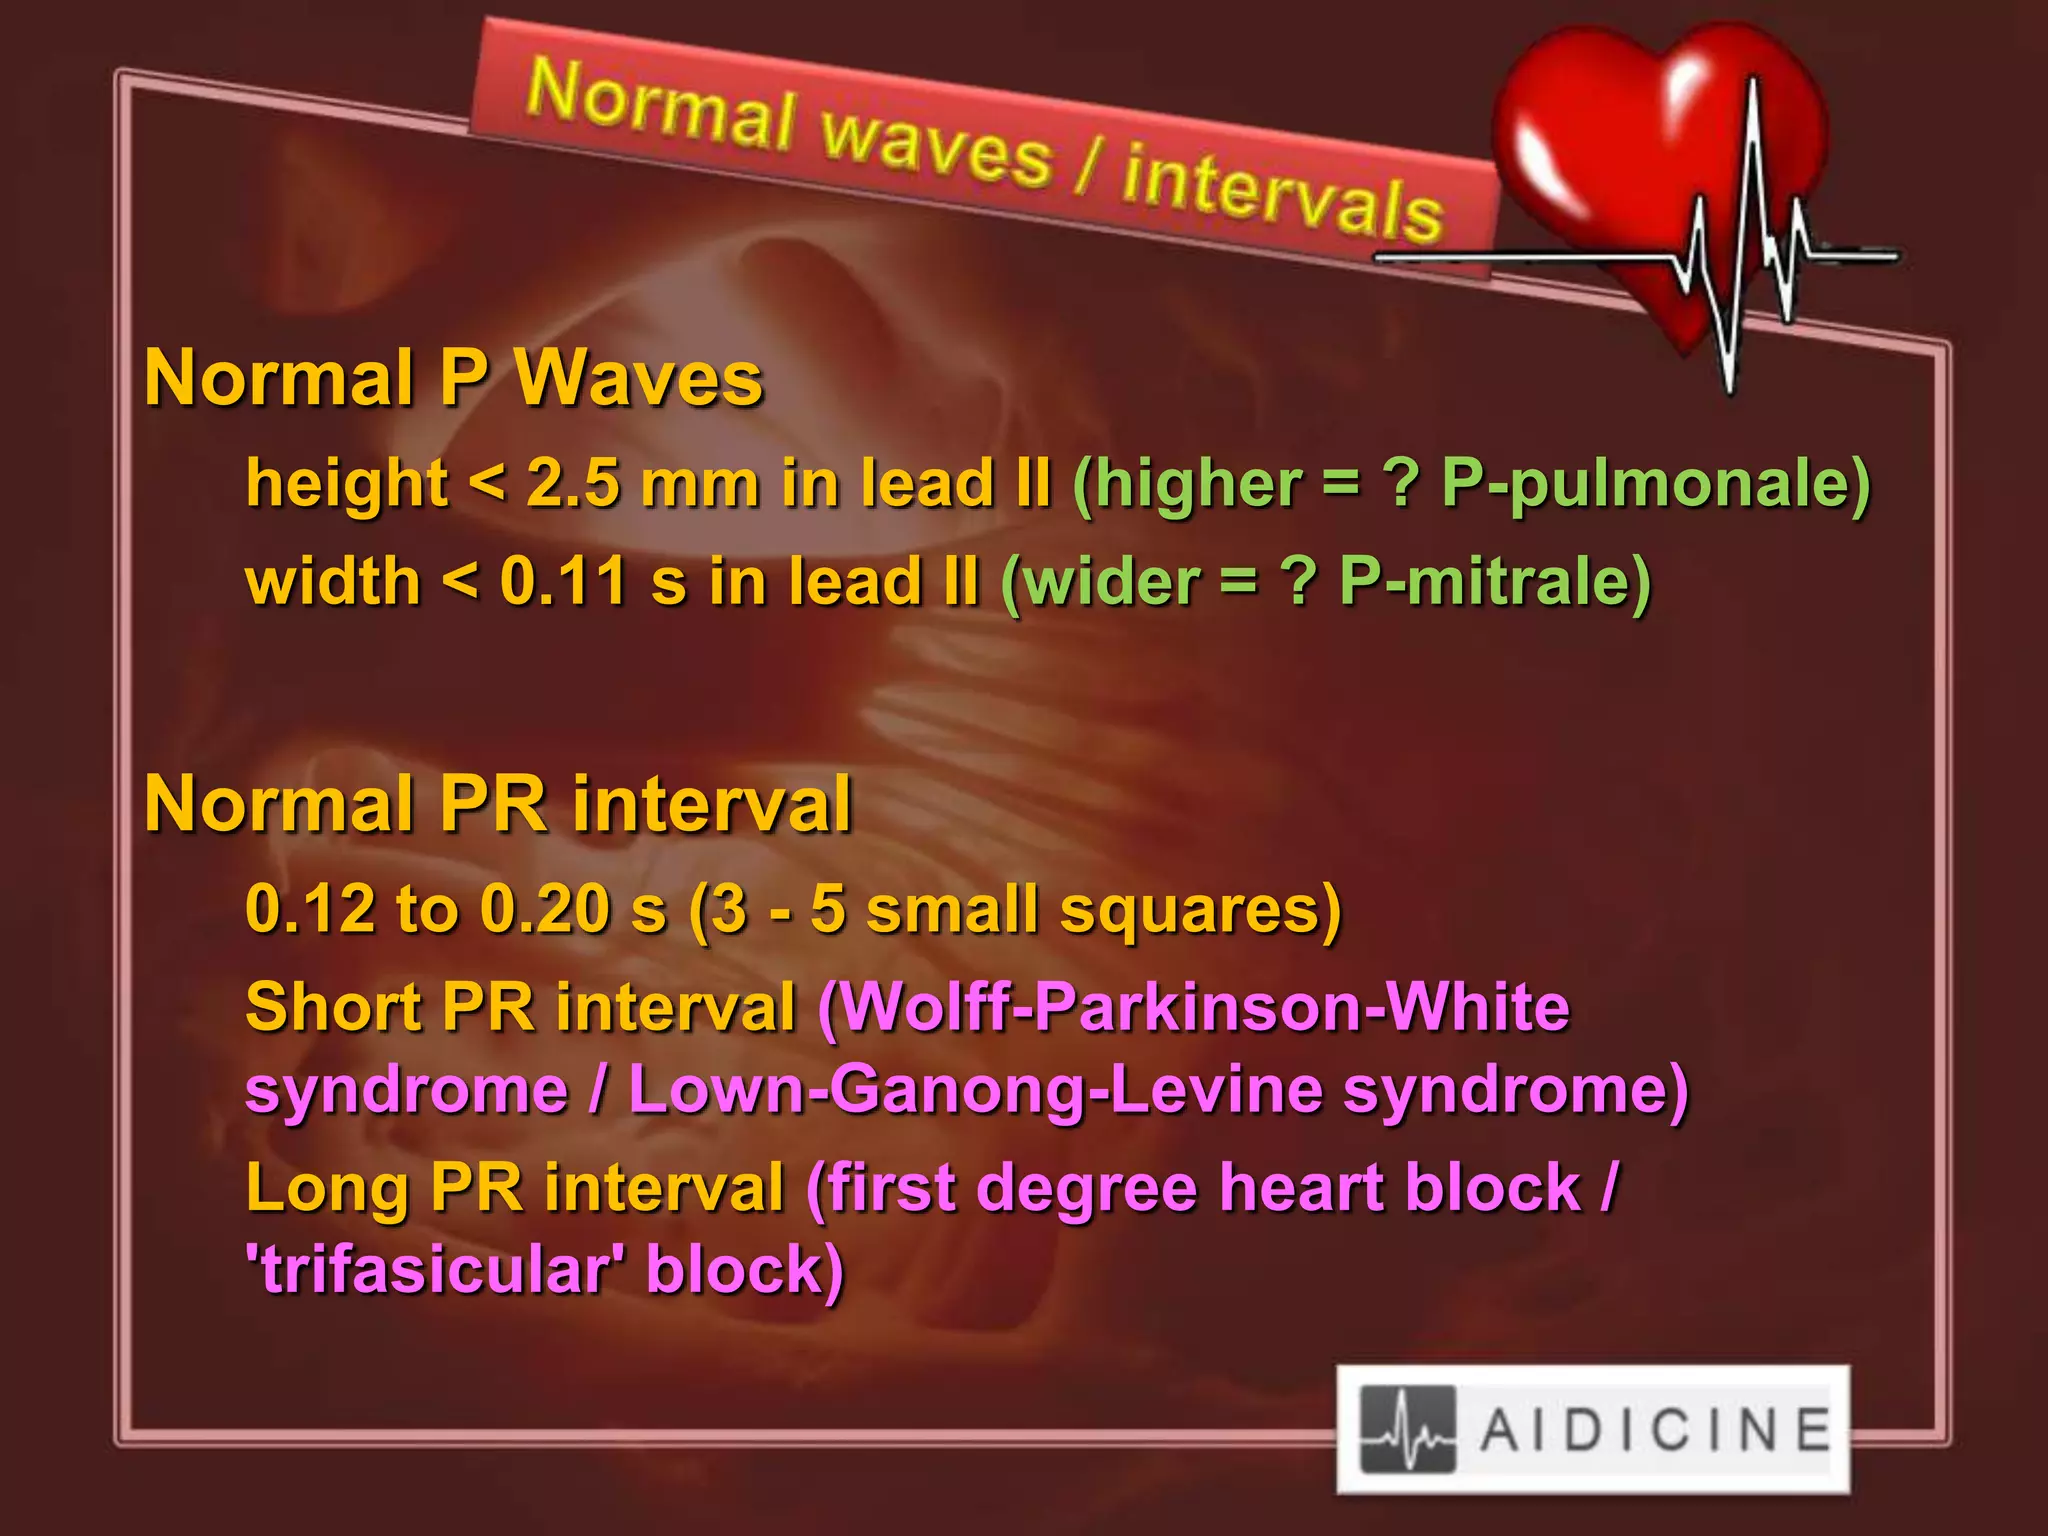
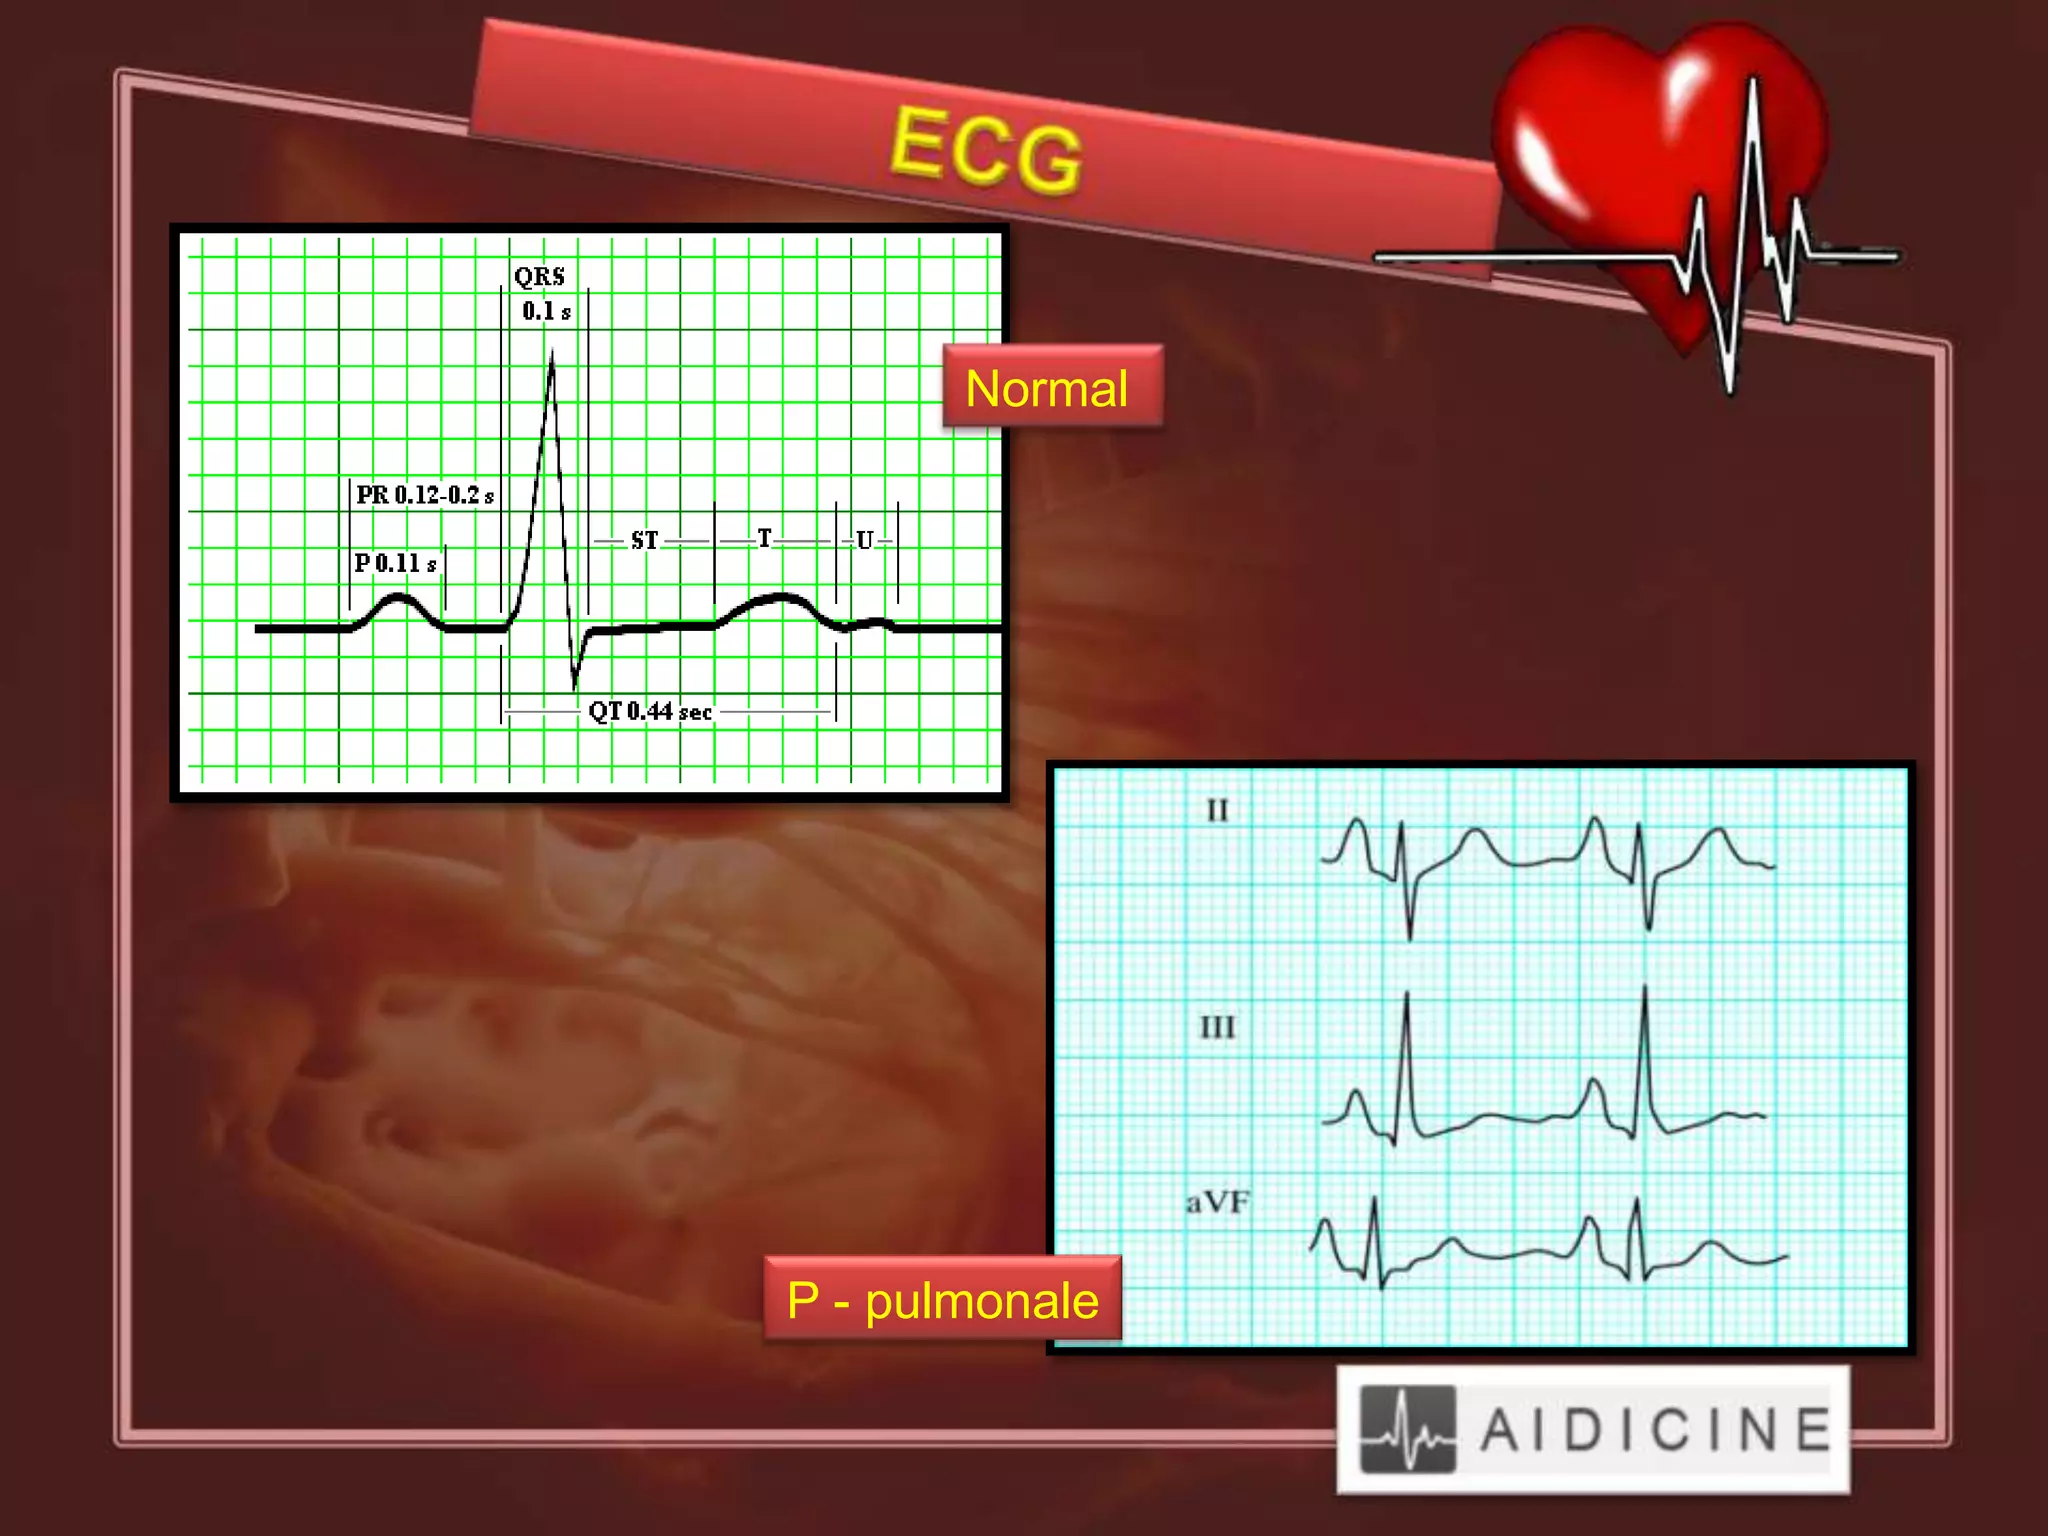
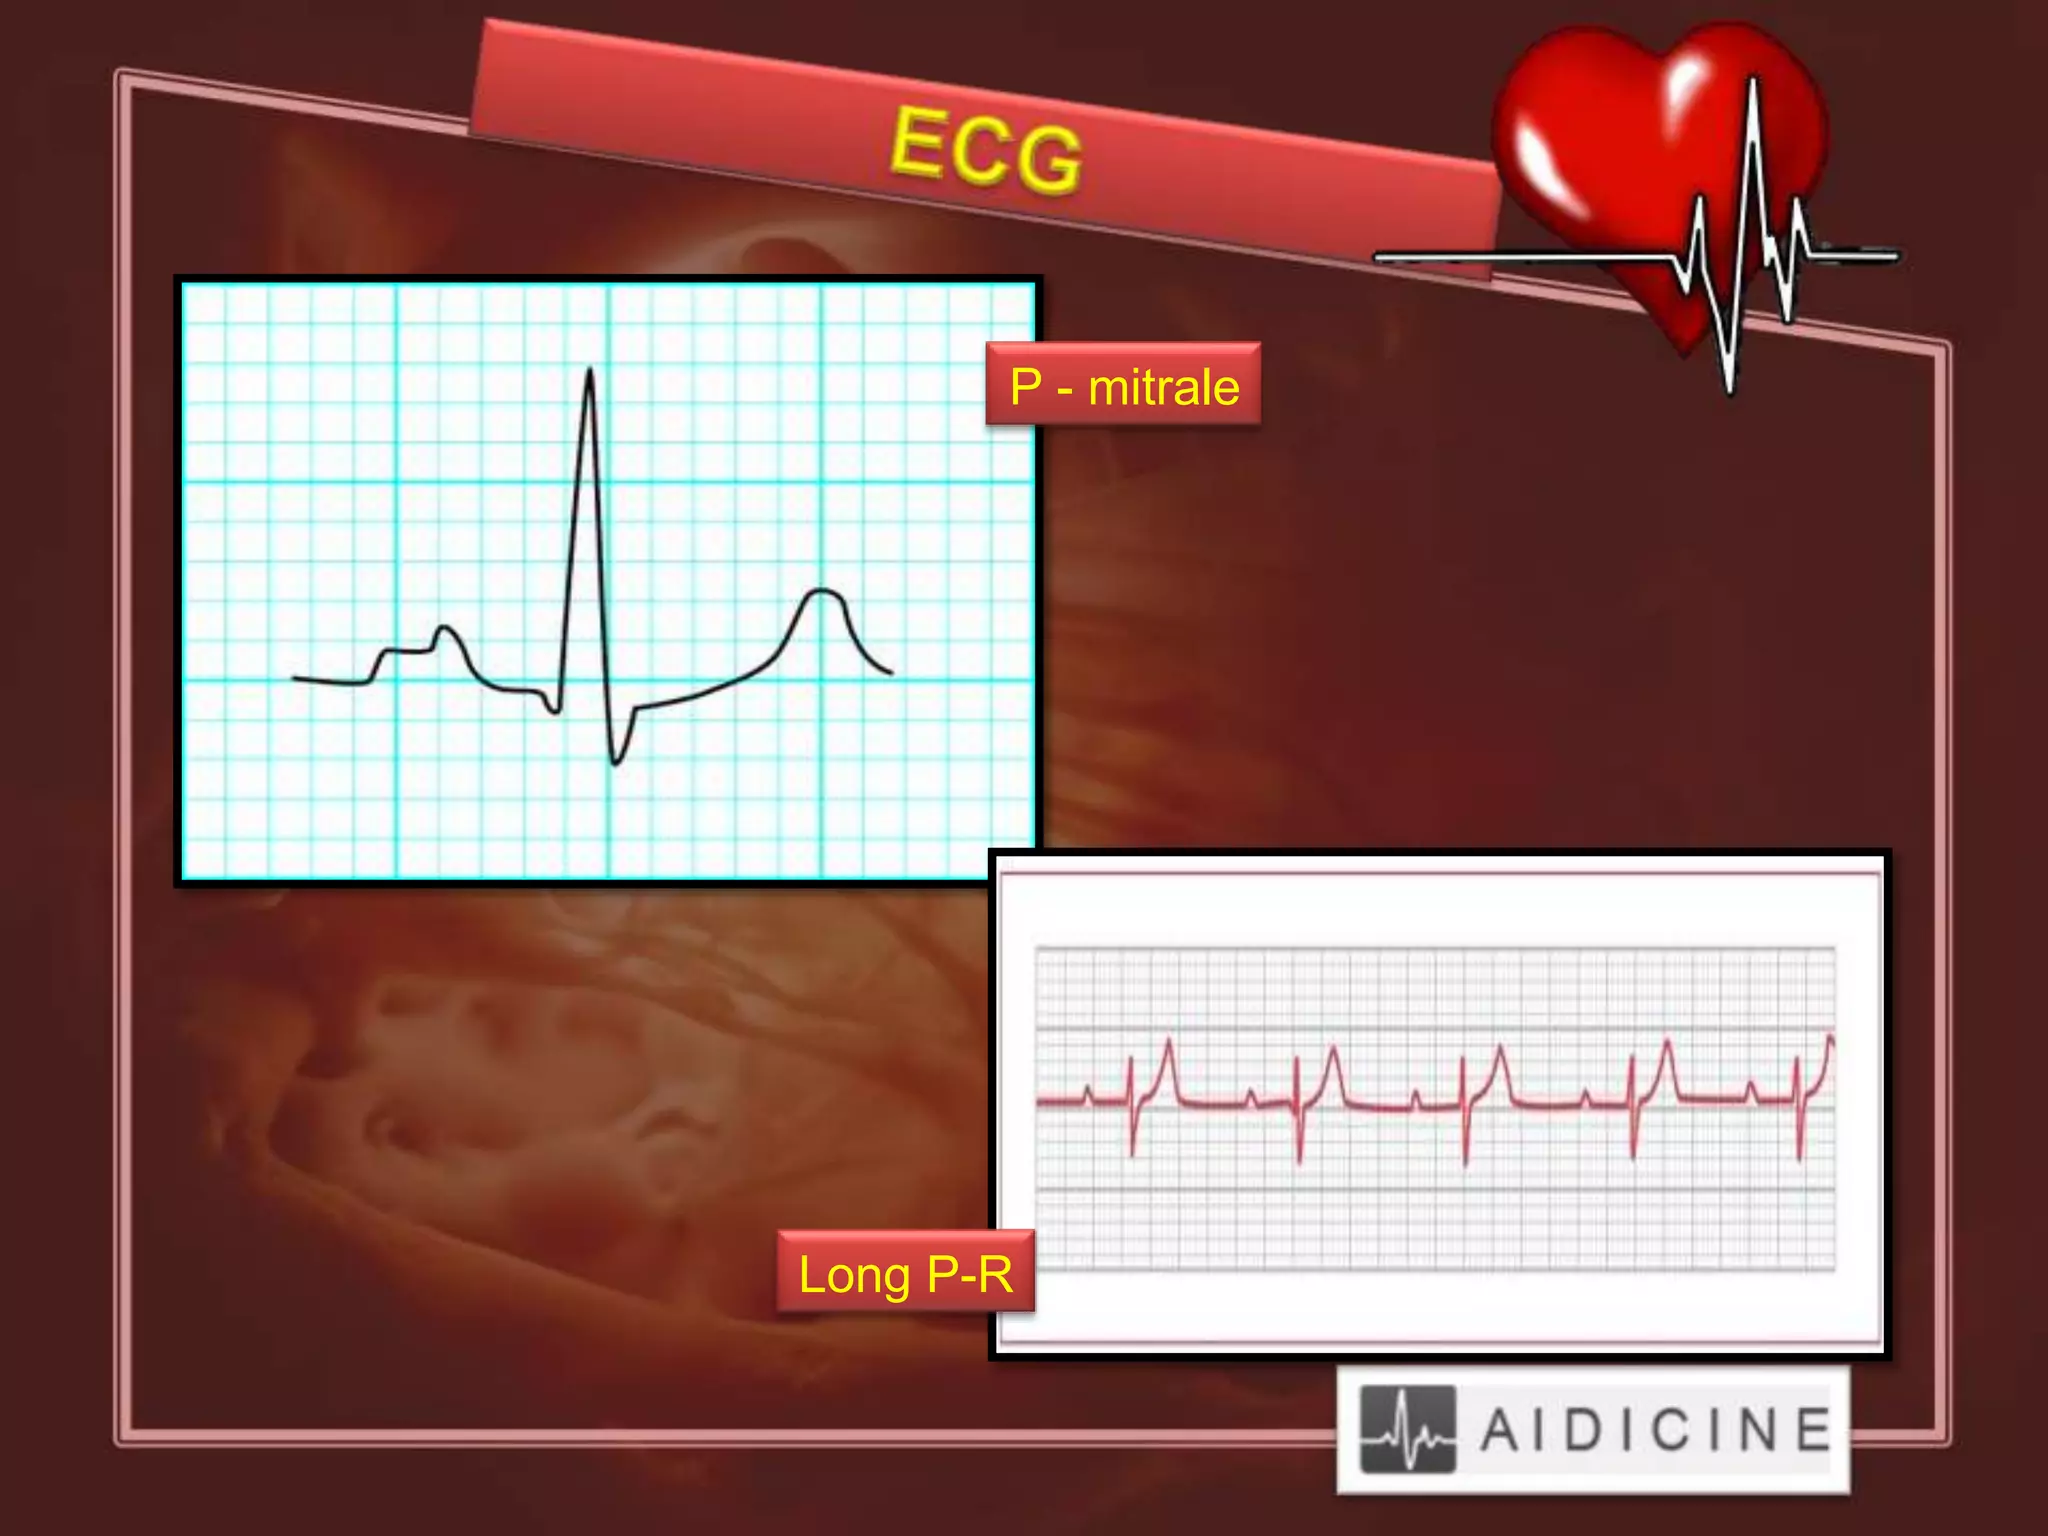
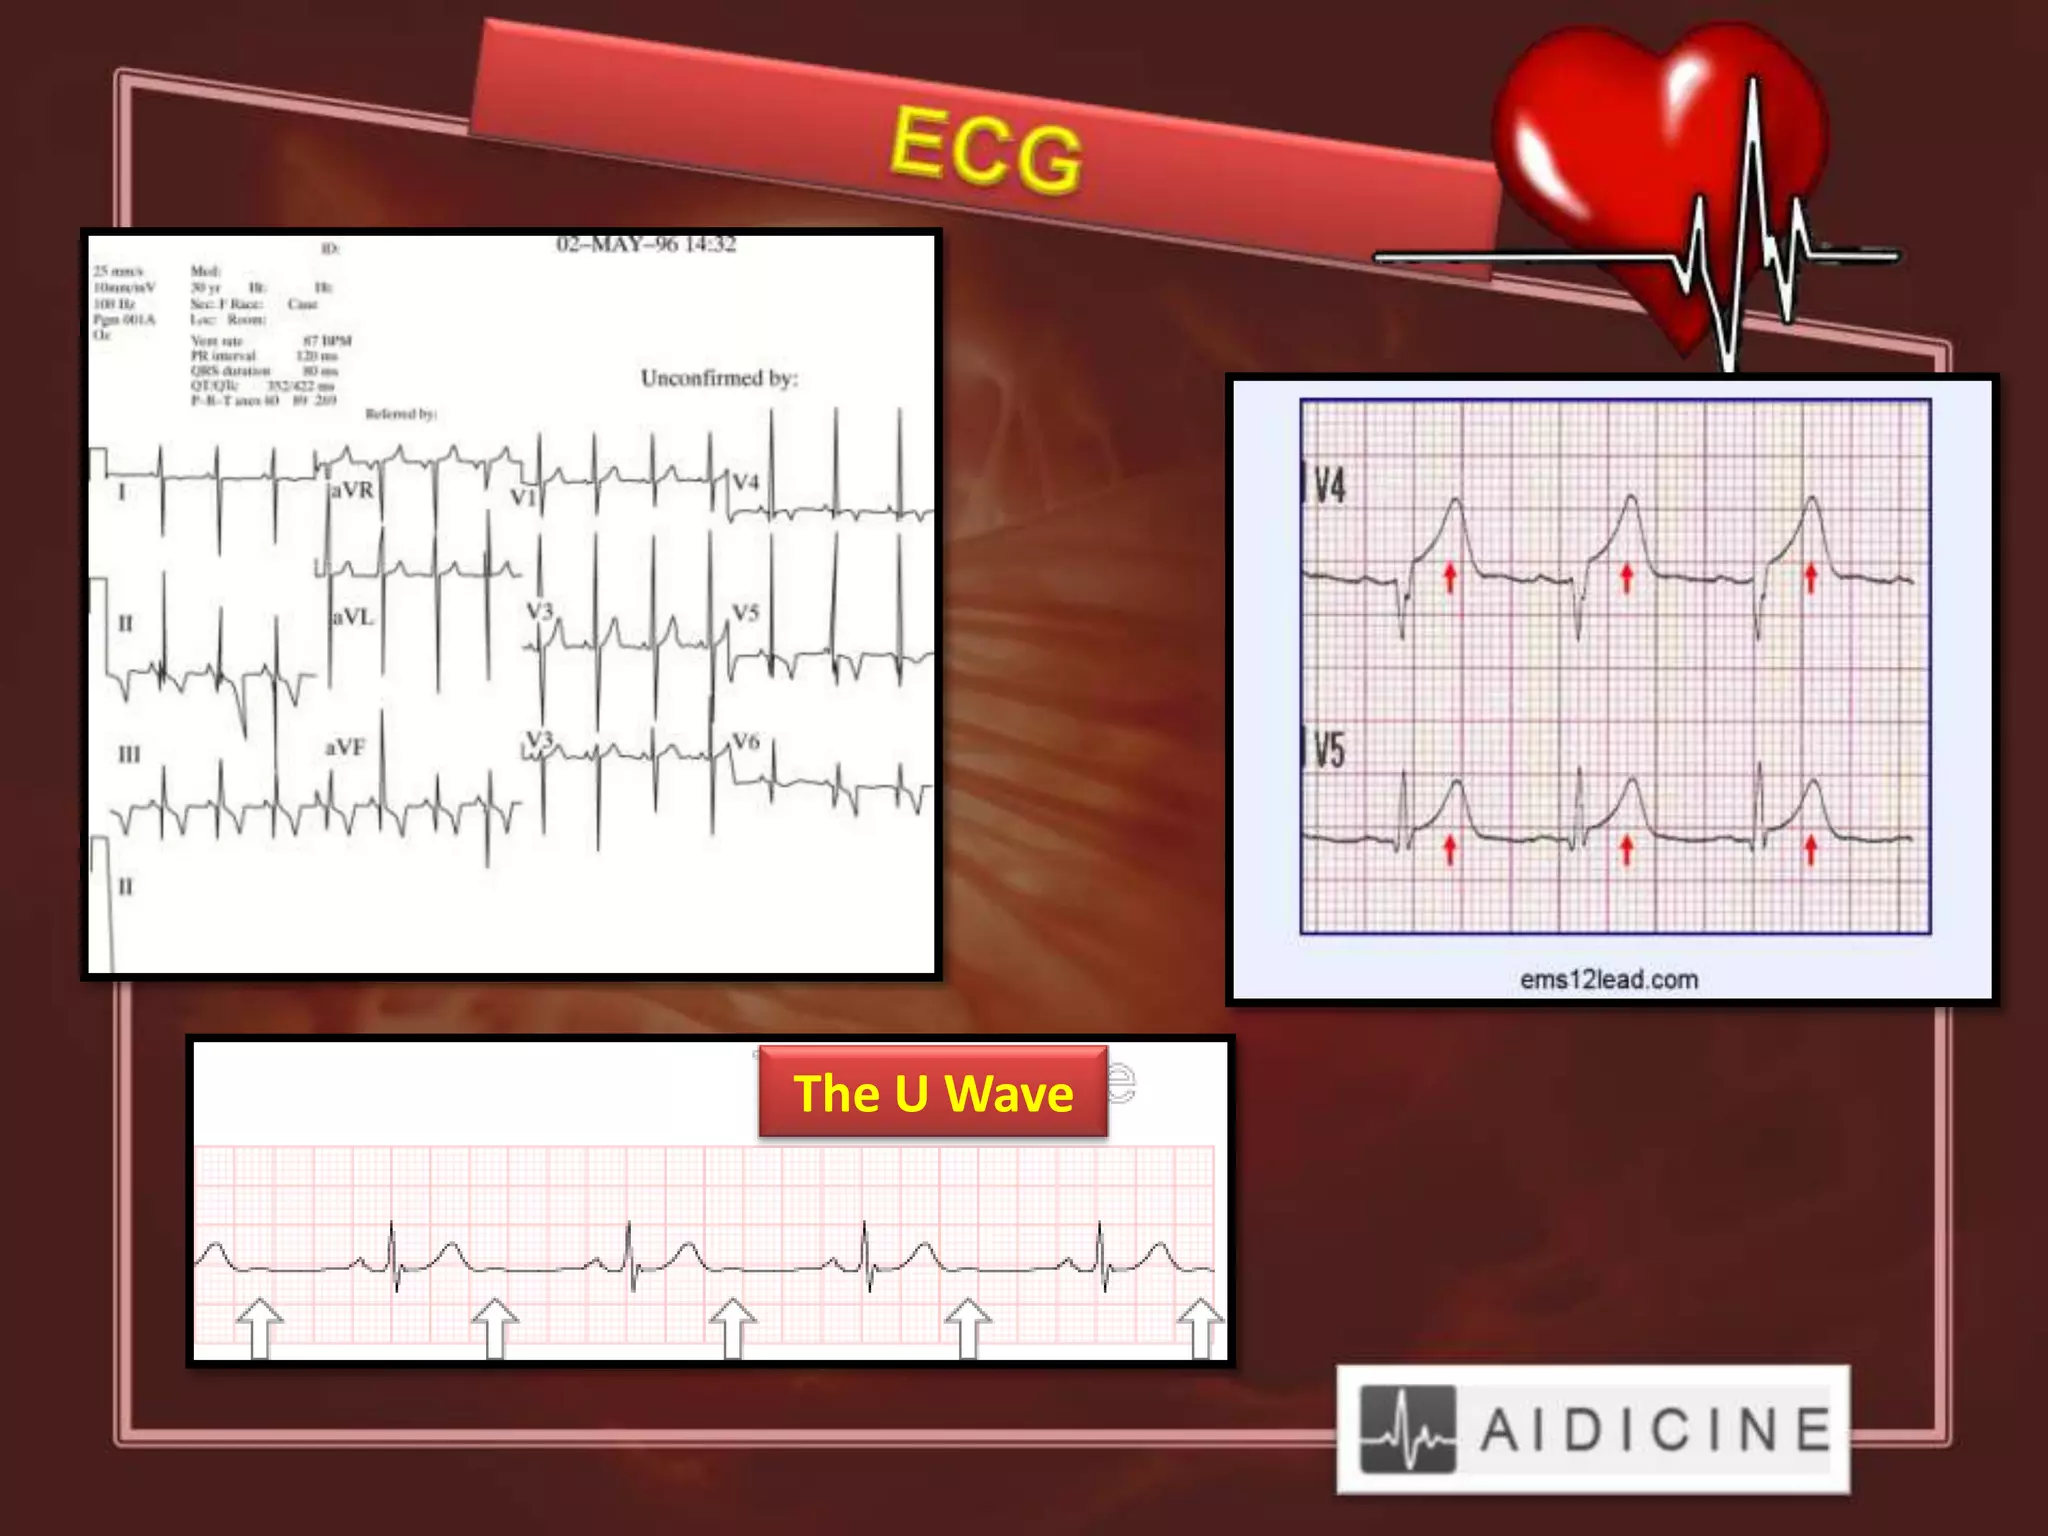
• Review of the conduction system
• ECG waveforms and intervals
• ECG leads
• Determining heart rhythm / rate
• Determining QRS axis
• Normal waves / intervals
The electrocardiogram (ECG) is a
representation of the electrical events
of the cardiac cycle.

Each event has a distinctive waveform,
the study of which can lead to greater
insight into a patient’s cardiac
pathophysiology.
Runs at a paper speed of 25 mm/sec

• Each small block of ECG paper is 1 mm2

• At a paper speed of 25 mm/s, one small block equals
 0.04 s

• Five small blocks make up 1 large block which
translates into 0.20 s (200 msec)

• Hence, there are 5 large blocks per second

• Voltage: 1 mm = 0.1 mV between each individual block
vertically
• Arrhythmias

• Myocardial ischemia and infarction

• Pericarditis

• Chamber hypertrophy

• Electrolyte disturbances (i.e.
  hyperkalemia, hypokalemia)

• Drug toxicity (i.e. digoxin and drugs
  which prolong the QT interval)
• 3 distinct waves are
  produced during
  cardiac cycle

• P wave caused by
  atrial depolarization


                          13-63
• QRS complex caused
 by ventricular
 depolarization
• T wave results from
  ventricular repolarization


                               13-63
Leads are electrodes which measure
the difference in electrical potential
between either:

1. Two different points on the body (bipolar
   leads)

2. One point on the body and a virtual
   reference point with zero electrical potential,
   located in the center of the heart (unipolar
   leads)
The standard ECG has 12
leads:

3 Standard Limb Leads
3 Augmented Limb Leads
6 Precordial Leads


The axis of a particular lead represents the
viewpoint from which it looks at the heart.
Limb Leads            Precordial
                                      Leads
Bipolar           I, II, III            -
            (standard limb leads)

Unipolar    aVR, aVL, aVF             V1-V6
           (augmented limb leads)
(Septum)
(Anterior Wall)
(Lateral Wall)
(Inferior Wall)
Normal Sinus Rhythm

Each P wave is followed by a QRS

  o P wave rate 60 - 100 bpm with <10%
    variation
  o rate <60 = sinus bradycardia
  o rate >100 = sinus tachycardia
  o variation >10% = sinus arrhythmia
• Rule of 300


• 10 Second Rule
Take the number of “big boxes”
between neighboring QRS
complexes, and divide 300 into this
number. The result will be
approximately equal to the rate

Although fast, this method only
works for regular rhythms.
(300 / 6) = 50 bpm
(300 / ~ 4) = ~ 75 bpm
(300 / 1.5) = 200 bpm
It may be easiest to memorize the following table:
    # of big       Rate
     boxes
       1            300
       2            150
       3            100
       4            75
       5            60
       6            50
As most EKGs record 10 seconds of
rhythm per page, one can simply count the
number of beats present on the EKG and
multiply by 6 to get the number of beats
per 60 seconds.


This method works well for irregular
rhythms.
The Alan E. Lindsay ECG Learning Center ; http://medstat.med.utah.edu/kw/ecg/


                                33 x 6 = 198 bpm
The QRS axis represents the net
  overall direction of the heart’s
  electrical activity.

Abnormalities of axis can hint at:
    Ventricular enlargement
    Conduction blocks (i.e.
 hemiblocks)
By near-consensus, the
normal QRS axis is defined
as ranging from -30 to +90 .


-30 to -90 is referred to as a
left axis deviation (LAD)


+90 to +180 is referred to as
a right axis deviation (RAD)
• The Quadrant Approach


• The Equiphasic Approach
Predominantly   Predominantly   Equiphasic
   Positive        Negative
2. In the event that LAD
   is present, examine
   lead II to determine if
   this deviation is
   pathologic.
If the QRS in II is
   predominantly
   positive, the LAD is
   non-pathologic (in
   other words, the axis
   is normal). If it is
   predominantly
   negative, it is
   pathologic.
The Alan E. Lindsay
                                 ECG Learning Center
                                 http://medstat.med.utah.
                                 edu/kw/ecg/


Negative in I, positive in aVF  RAD
The Alan E. Lindsay
                                           ECG Learning Center
                                           http://medstat.med.utah.
                                           edu/kw/ecg/


Positive in I, negative in aVF      Predominantly positive in II     
                 Normal Axis (non-pathologic LAD)
1. Determine which lead contains the most equiphasic
   QRS complex. The fact that the QRS complex in this
   lead is equally positive and negative indicates that
   the net electrical vector (i.e. overall QRS axis) is
   perpendicular to the axis of this particular lead.

2. Examine the QRS complex in whichever lead lies 90°
   away from the lead identified in step 1. If the QRS
   complex in this second lead is predominantly
   positive, than the axis of this lead is approximately
   the same as the net QRS axis. If the QRS complex is
   predominantly negative, than the net QRS axis lies
   180° from the axis of this lead.
The Alan E. Lindsay ECG Learning Center ; http://medstat.med.utah.edu/kw/ecg/

Equiphasic in aVF  Predominantly positive in I  QRS axis ≈ 0
The Alan E. Lindsay ECG Learning Center ; http://medstat.med.utah.edu/kw/ecg/

Equiphasic in II  Predominantly negative in aVL  QRS axis ≈ +150°
Normal P Waves
  height < 2.5 mm in lead II (higher = ? P-pulmonale)
  width < 0.11 s in lead II (wider = ? P-mitrale)


Normal PR interval
  0.12 to 0.20 s (3 - 5 small squares)
  Short PR interval (Wolff-Parkinson-White
  syndrome / Lown-Ganong-Levine syndrome)
  Long PR interval (first degree heart block /
  'trifasicular' block)
Normal


P - pulmonale
P - mitrale


Long P-R
Normal QRS complex
  < 0.12 s duration (3 small squares)
  No pathological Q waves
     Pathologic “Q”: - > 0.04 sec (small box)
                               - > 25% of “R” amplitude


  Wide QRS (right or left bundle branch block, ventricular
  rhythm, hyperkalemia)

      o No evidence of left or right ventricular
hypertrophy
Normal


LVH
Wide Complex


Pathologic “Q” wave
Normal QT interval:
   – Males: < 450 ms.
   – Females: < 470 ms.

   o Calculate the corrected QT interval (QTc) by dividing
     the QT interval by the square root of the preceeding R -
     R interval.

   o Long QT interval is a risk factor for VT / Torsades de
     Pointes.

   o Long QT interval (MI, myocarditis, diffuse myocardial
     disease / hypocalcaemia / hypothyrodism / intracerebral
     haemorrhage / drugs (sotalol, amiodarone) / hereditary
     (Romano Ward syndrome (autosomal dominant) / Jervill
     Lange Nielson syndrome (autosomal recessive)
Normal ST segment
  no elevation or depression

  ST elevation: acute MI / left bundle branch
  block, normal variants (e.g. athletic heart)
  acute pericarditis

  ST depression: myocardial ischaemia,
  digoxin effect / ventricular hypertrophy /
  acute posterior MI / right bundle branch
  block
Normal ST


                      ST depression


       ST elevation
Normal T wave: variable morphology & amplitude / usually same
direction as the QRS except in V1-2 leads.
    In the normal ECG the T wave is always upright in leads I, II, V3-6,
    and always inverted in lead aVR.

    Tall T: hyperkalemia / hyperacute myocardial infarction.

    Small, flattened or inverted T waves: ischaemia / LVH / drugs (e.g.
    digoxin) / pericarditis / PE / RBBB / electrolyte disturbance.

Normal U wave: usually < 1/3 T wave amplitude & same direction
in the same lead / prominent at slow heart rates.
          o Origin of the U wave is thought to be related to after
depolarizations which interrupt or follow repolarization
The U Wave
Visit http://aidicine.com/ web site

ECG basics

  • 2.
    • Review ofthe conduction system • ECG waveforms and intervals • ECG leads • Determining heart rhythm / rate • Determining QRS axis • Normal waves / intervals
  • 4.
    The electrocardiogram (ECG)is a representation of the electrical events of the cardiac cycle. Each event has a distinctive waveform, the study of which can lead to greater insight into a patient’s cardiac pathophysiology.
  • 5.
    Runs at apaper speed of 25 mm/sec • Each small block of ECG paper is 1 mm2 • At a paper speed of 25 mm/s, one small block equals 0.04 s • Five small blocks make up 1 large block which translates into 0.20 s (200 msec) • Hence, there are 5 large blocks per second • Voltage: 1 mm = 0.1 mV between each individual block vertically
  • 7.
    • Arrhythmias • Myocardialischemia and infarction • Pericarditis • Chamber hypertrophy • Electrolyte disturbances (i.e. hyperkalemia, hypokalemia) • Drug toxicity (i.e. digoxin and drugs which prolong the QT interval)
  • 10.
    • 3 distinctwaves are produced during cardiac cycle • P wave caused by atrial depolarization 13-63
  • 11.
    • QRS complexcaused by ventricular depolarization
  • 12.
    • T waveresults from ventricular repolarization 13-63
  • 13.
    Leads are electrodeswhich measure the difference in electrical potential between either: 1. Two different points on the body (bipolar leads) 2. One point on the body and a virtual reference point with zero electrical potential, located in the center of the heart (unipolar leads)
  • 14.
    The standard ECGhas 12 leads: 3 Standard Limb Leads 3 Augmented Limb Leads 6 Precordial Leads The axis of a particular lead represents the viewpoint from which it looks at the heart.
  • 22.
    Limb Leads Precordial Leads Bipolar I, II, III - (standard limb leads) Unipolar aVR, aVL, aVF V1-V6 (augmented limb leads)
  • 24.
  • 25.
  • 26.
  • 27.
  • 29.
    Normal Sinus Rhythm EachP wave is followed by a QRS o P wave rate 60 - 100 bpm with <10% variation o rate <60 = sinus bradycardia o rate >100 = sinus tachycardia o variation >10% = sinus arrhythmia
  • 30.
    • Rule of300 • 10 Second Rule
  • 31.
    Take the numberof “big boxes” between neighboring QRS complexes, and divide 300 into this number. The result will be approximately equal to the rate Although fast, this method only works for regular rhythms.
  • 32.
    (300 / 6)= 50 bpm
  • 33.
    (300 / ~4) = ~ 75 bpm
  • 34.
    (300 / 1.5)= 200 bpm
  • 35.
    It may beeasiest to memorize the following table: # of big Rate boxes 1 300 2 150 3 100 4 75 5 60 6 50
  • 36.
    As most EKGsrecord 10 seconds of rhythm per page, one can simply count the number of beats present on the EKG and multiply by 6 to get the number of beats per 60 seconds. This method works well for irregular rhythms.
  • 37.
    The Alan E.Lindsay ECG Learning Center ; http://medstat.med.utah.edu/kw/ecg/ 33 x 6 = 198 bpm
  • 38.
    The QRS axisrepresents the net overall direction of the heart’s electrical activity. Abnormalities of axis can hint at: Ventricular enlargement Conduction blocks (i.e. hemiblocks)
  • 39.
    By near-consensus, the normalQRS axis is defined as ranging from -30 to +90 . -30 to -90 is referred to as a left axis deviation (LAD) +90 to +180 is referred to as a right axis deviation (RAD)
  • 40.
    • The QuadrantApproach • The Equiphasic Approach
  • 41.
    Predominantly Predominantly Equiphasic Positive Negative
  • 42.
    2. In theevent that LAD is present, examine lead II to determine if this deviation is pathologic. If the QRS in II is predominantly positive, the LAD is non-pathologic (in other words, the axis is normal). If it is predominantly negative, it is pathologic.
  • 43.
    The Alan E.Lindsay ECG Learning Center http://medstat.med.utah. edu/kw/ecg/ Negative in I, positive in aVF  RAD
  • 44.
    The Alan E.Lindsay ECG Learning Center http://medstat.med.utah. edu/kw/ecg/ Positive in I, negative in aVF  Predominantly positive in II  Normal Axis (non-pathologic LAD)
  • 45.
    1. Determine whichlead contains the most equiphasic QRS complex. The fact that the QRS complex in this lead is equally positive and negative indicates that the net electrical vector (i.e. overall QRS axis) is perpendicular to the axis of this particular lead. 2. Examine the QRS complex in whichever lead lies 90° away from the lead identified in step 1. If the QRS complex in this second lead is predominantly positive, than the axis of this lead is approximately the same as the net QRS axis. If the QRS complex is predominantly negative, than the net QRS axis lies 180° from the axis of this lead.
  • 47.
    The Alan E.Lindsay ECG Learning Center ; http://medstat.med.utah.edu/kw/ecg/ Equiphasic in aVF  Predominantly positive in I  QRS axis ≈ 0
  • 48.
    The Alan E.Lindsay ECG Learning Center ; http://medstat.med.utah.edu/kw/ecg/ Equiphasic in II  Predominantly negative in aVL  QRS axis ≈ +150°
  • 49.
    Normal P Waves height < 2.5 mm in lead II (higher = ? P-pulmonale) width < 0.11 s in lead II (wider = ? P-mitrale) Normal PR interval 0.12 to 0.20 s (3 - 5 small squares) Short PR interval (Wolff-Parkinson-White syndrome / Lown-Ganong-Levine syndrome) Long PR interval (first degree heart block / 'trifasicular' block)
  • 50.
  • 51.
  • 52.
    Normal QRS complex < 0.12 s duration (3 small squares) No pathological Q waves Pathologic “Q”: - > 0.04 sec (small box) - > 25% of “R” amplitude Wide QRS (right or left bundle branch block, ventricular rhythm, hyperkalemia) o No evidence of left or right ventricular hypertrophy
  • 53.
  • 54.
  • 55.
    Normal QT interval: – Males: < 450 ms. – Females: < 470 ms. o Calculate the corrected QT interval (QTc) by dividing the QT interval by the square root of the preceeding R - R interval. o Long QT interval is a risk factor for VT / Torsades de Pointes. o Long QT interval (MI, myocarditis, diffuse myocardial disease / hypocalcaemia / hypothyrodism / intracerebral haemorrhage / drugs (sotalol, amiodarone) / hereditary (Romano Ward syndrome (autosomal dominant) / Jervill Lange Nielson syndrome (autosomal recessive)
  • 57.
    Normal ST segment no elevation or depression ST elevation: acute MI / left bundle branch block, normal variants (e.g. athletic heart) acute pericarditis ST depression: myocardial ischaemia, digoxin effect / ventricular hypertrophy / acute posterior MI / right bundle branch block
  • 58.
    Normal ST ST depression ST elevation
  • 59.
    Normal T wave:variable morphology & amplitude / usually same direction as the QRS except in V1-2 leads. In the normal ECG the T wave is always upright in leads I, II, V3-6, and always inverted in lead aVR. Tall T: hyperkalemia / hyperacute myocardial infarction. Small, flattened or inverted T waves: ischaemia / LVH / drugs (e.g. digoxin) / pericarditis / PE / RBBB / electrolyte disturbance. Normal U wave: usually < 1/3 T wave amplitude & same direction in the same lead / prominent at slow heart rates. o Origin of the U wave is thought to be related to after depolarizations which interrupt or follow repolarization
  • 60.
  • 61.