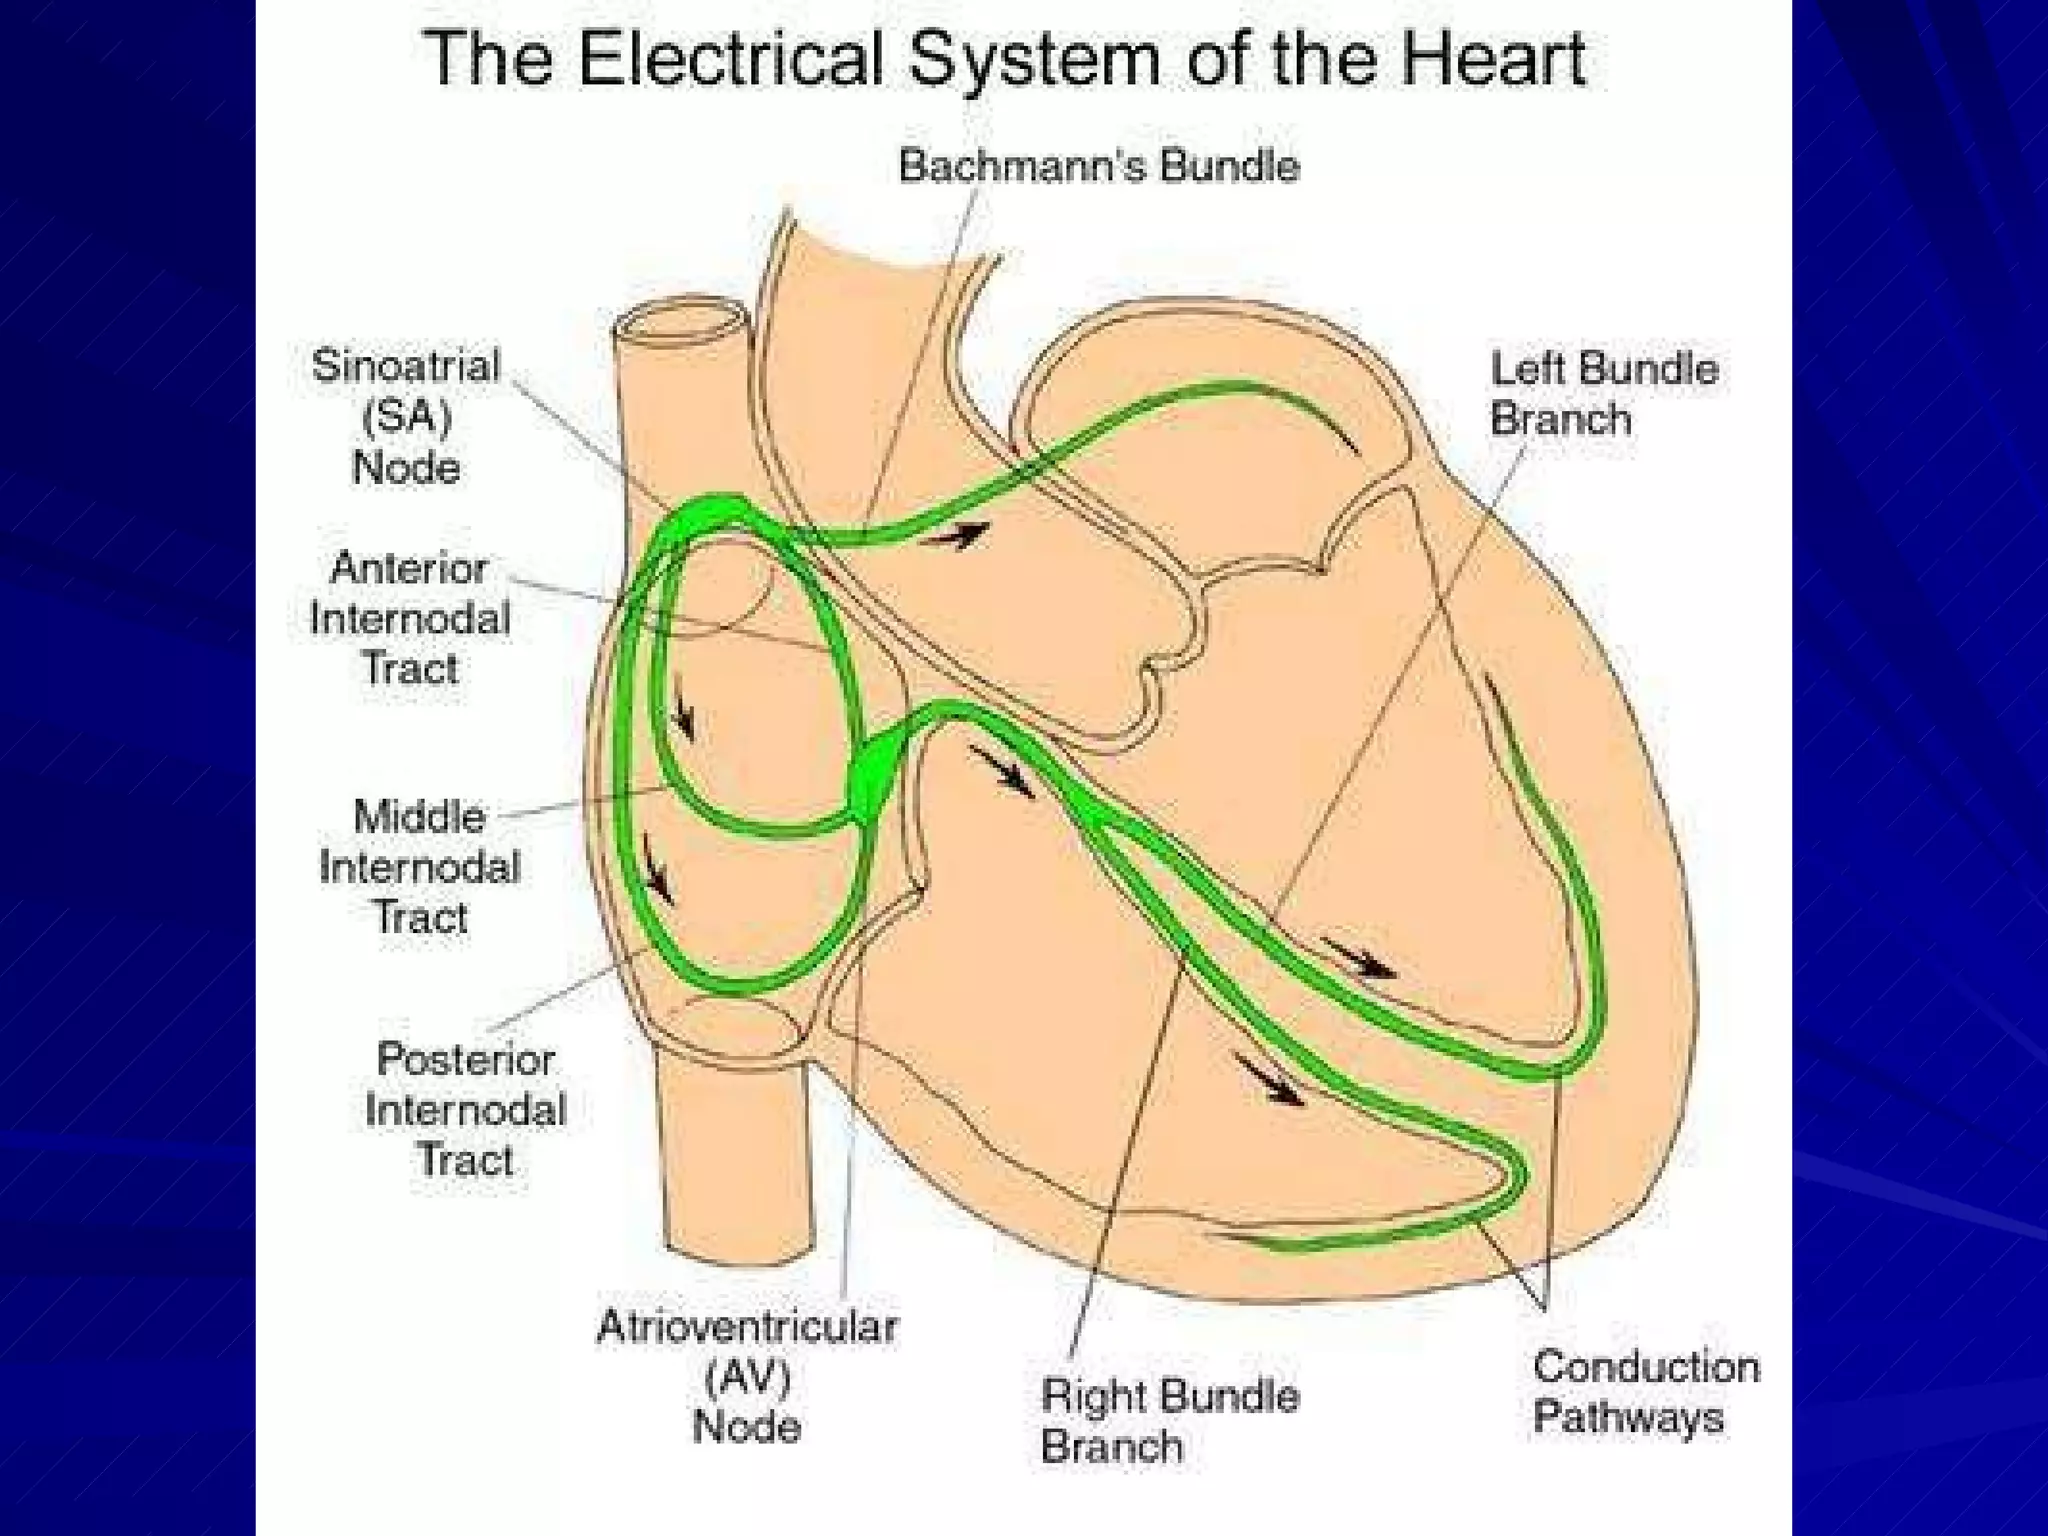
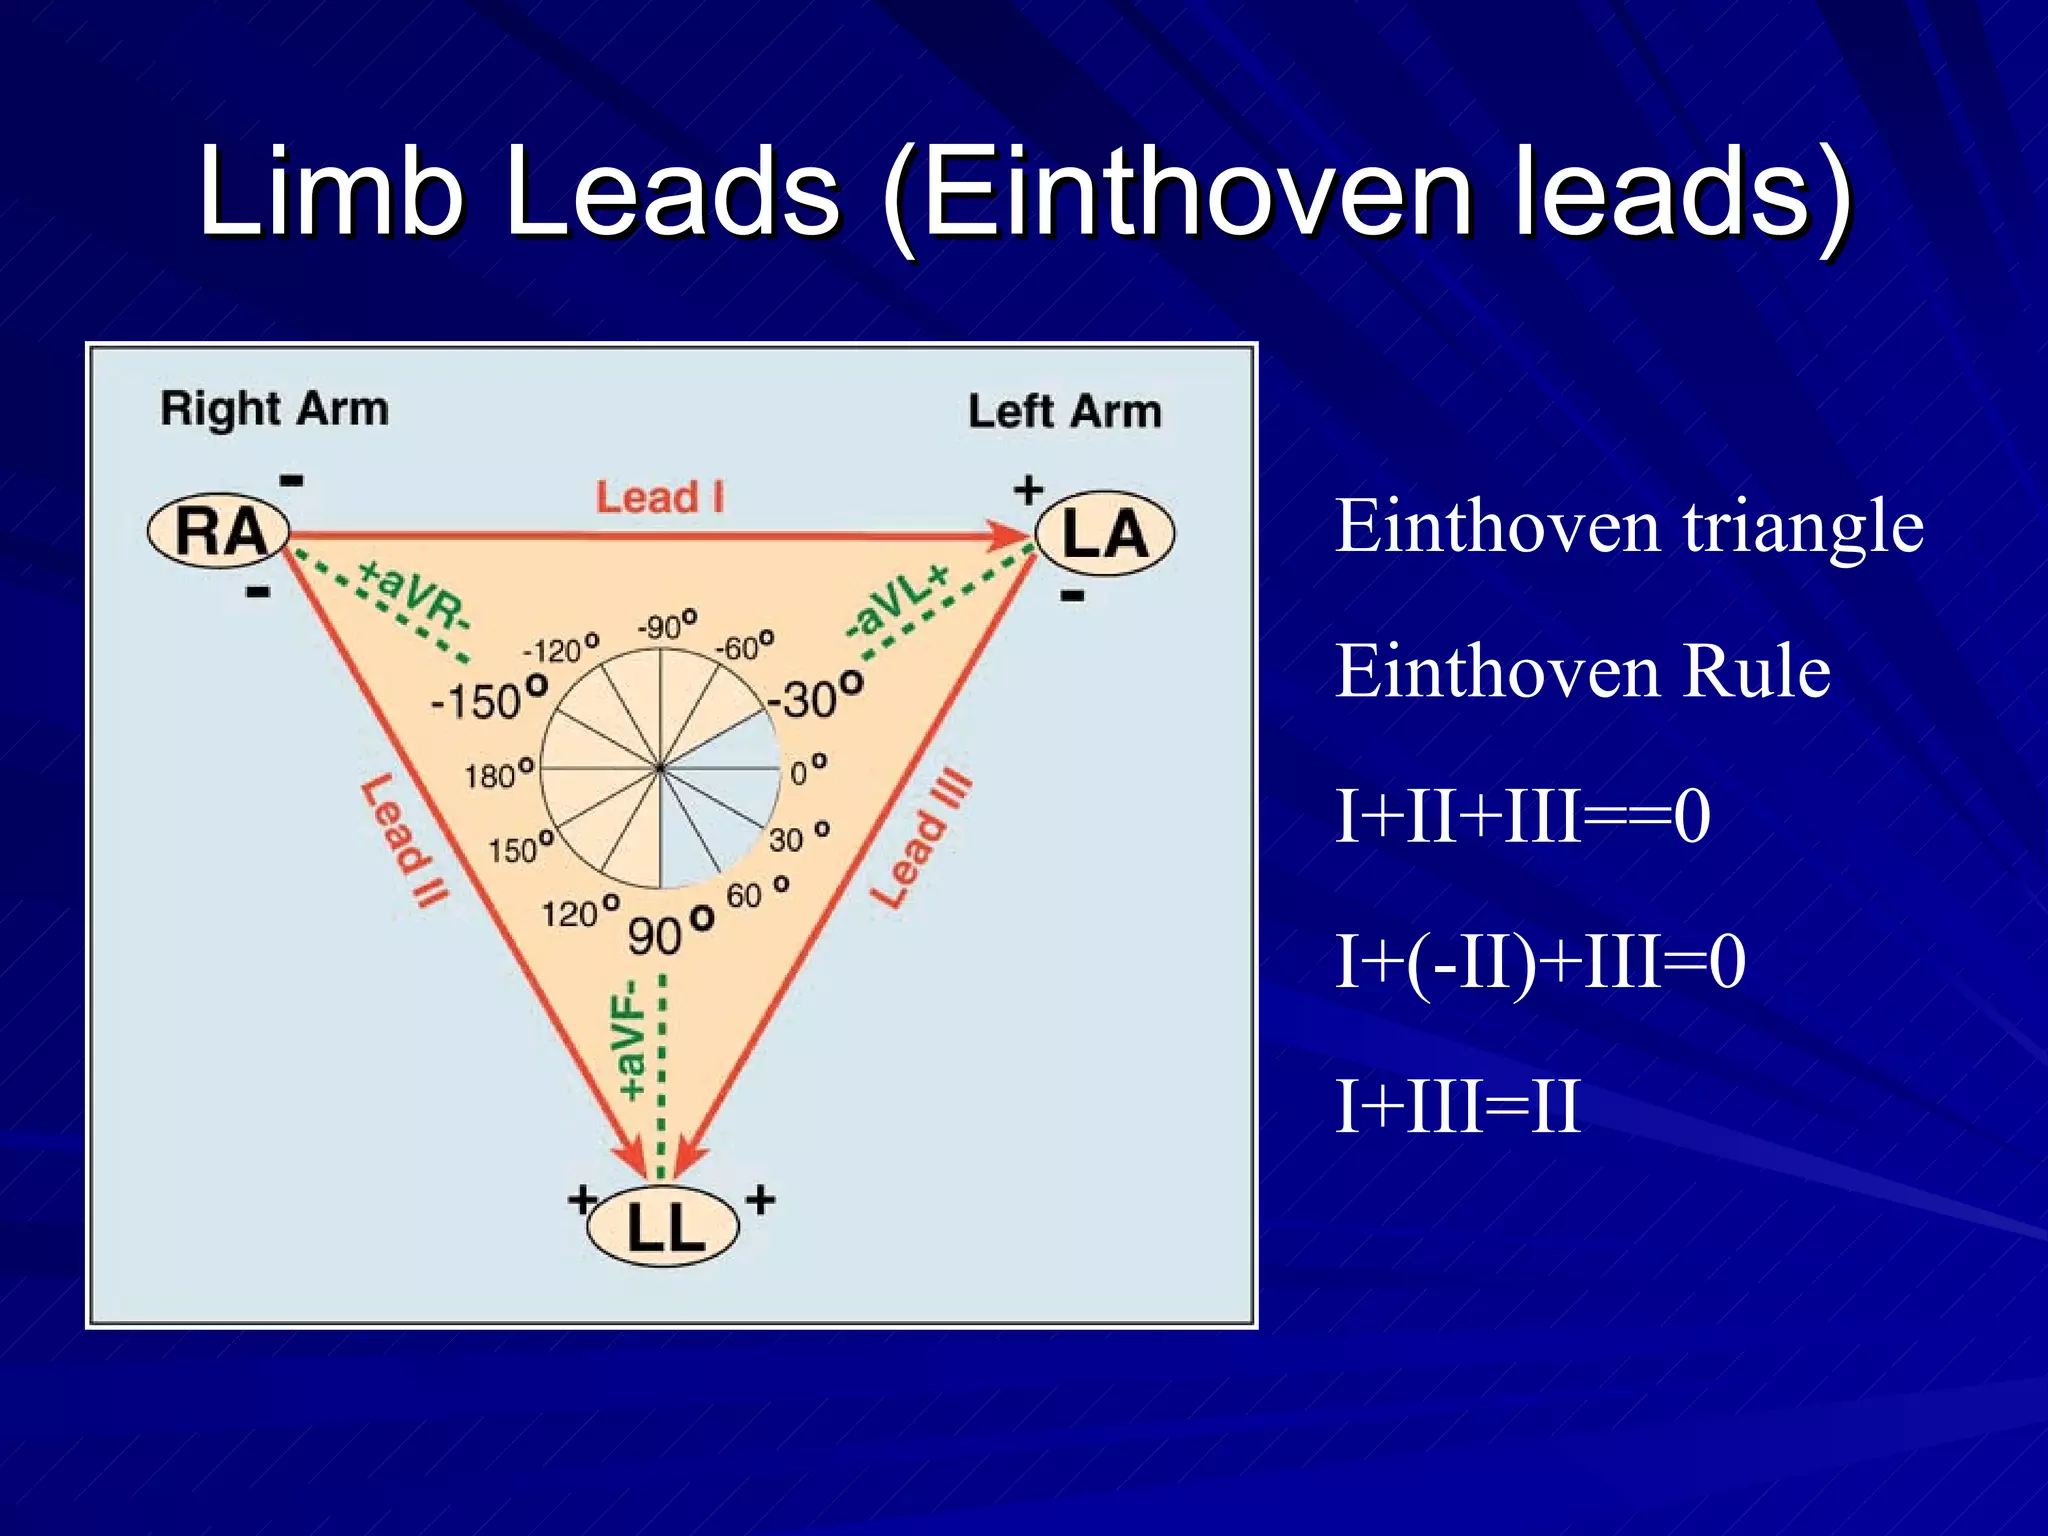
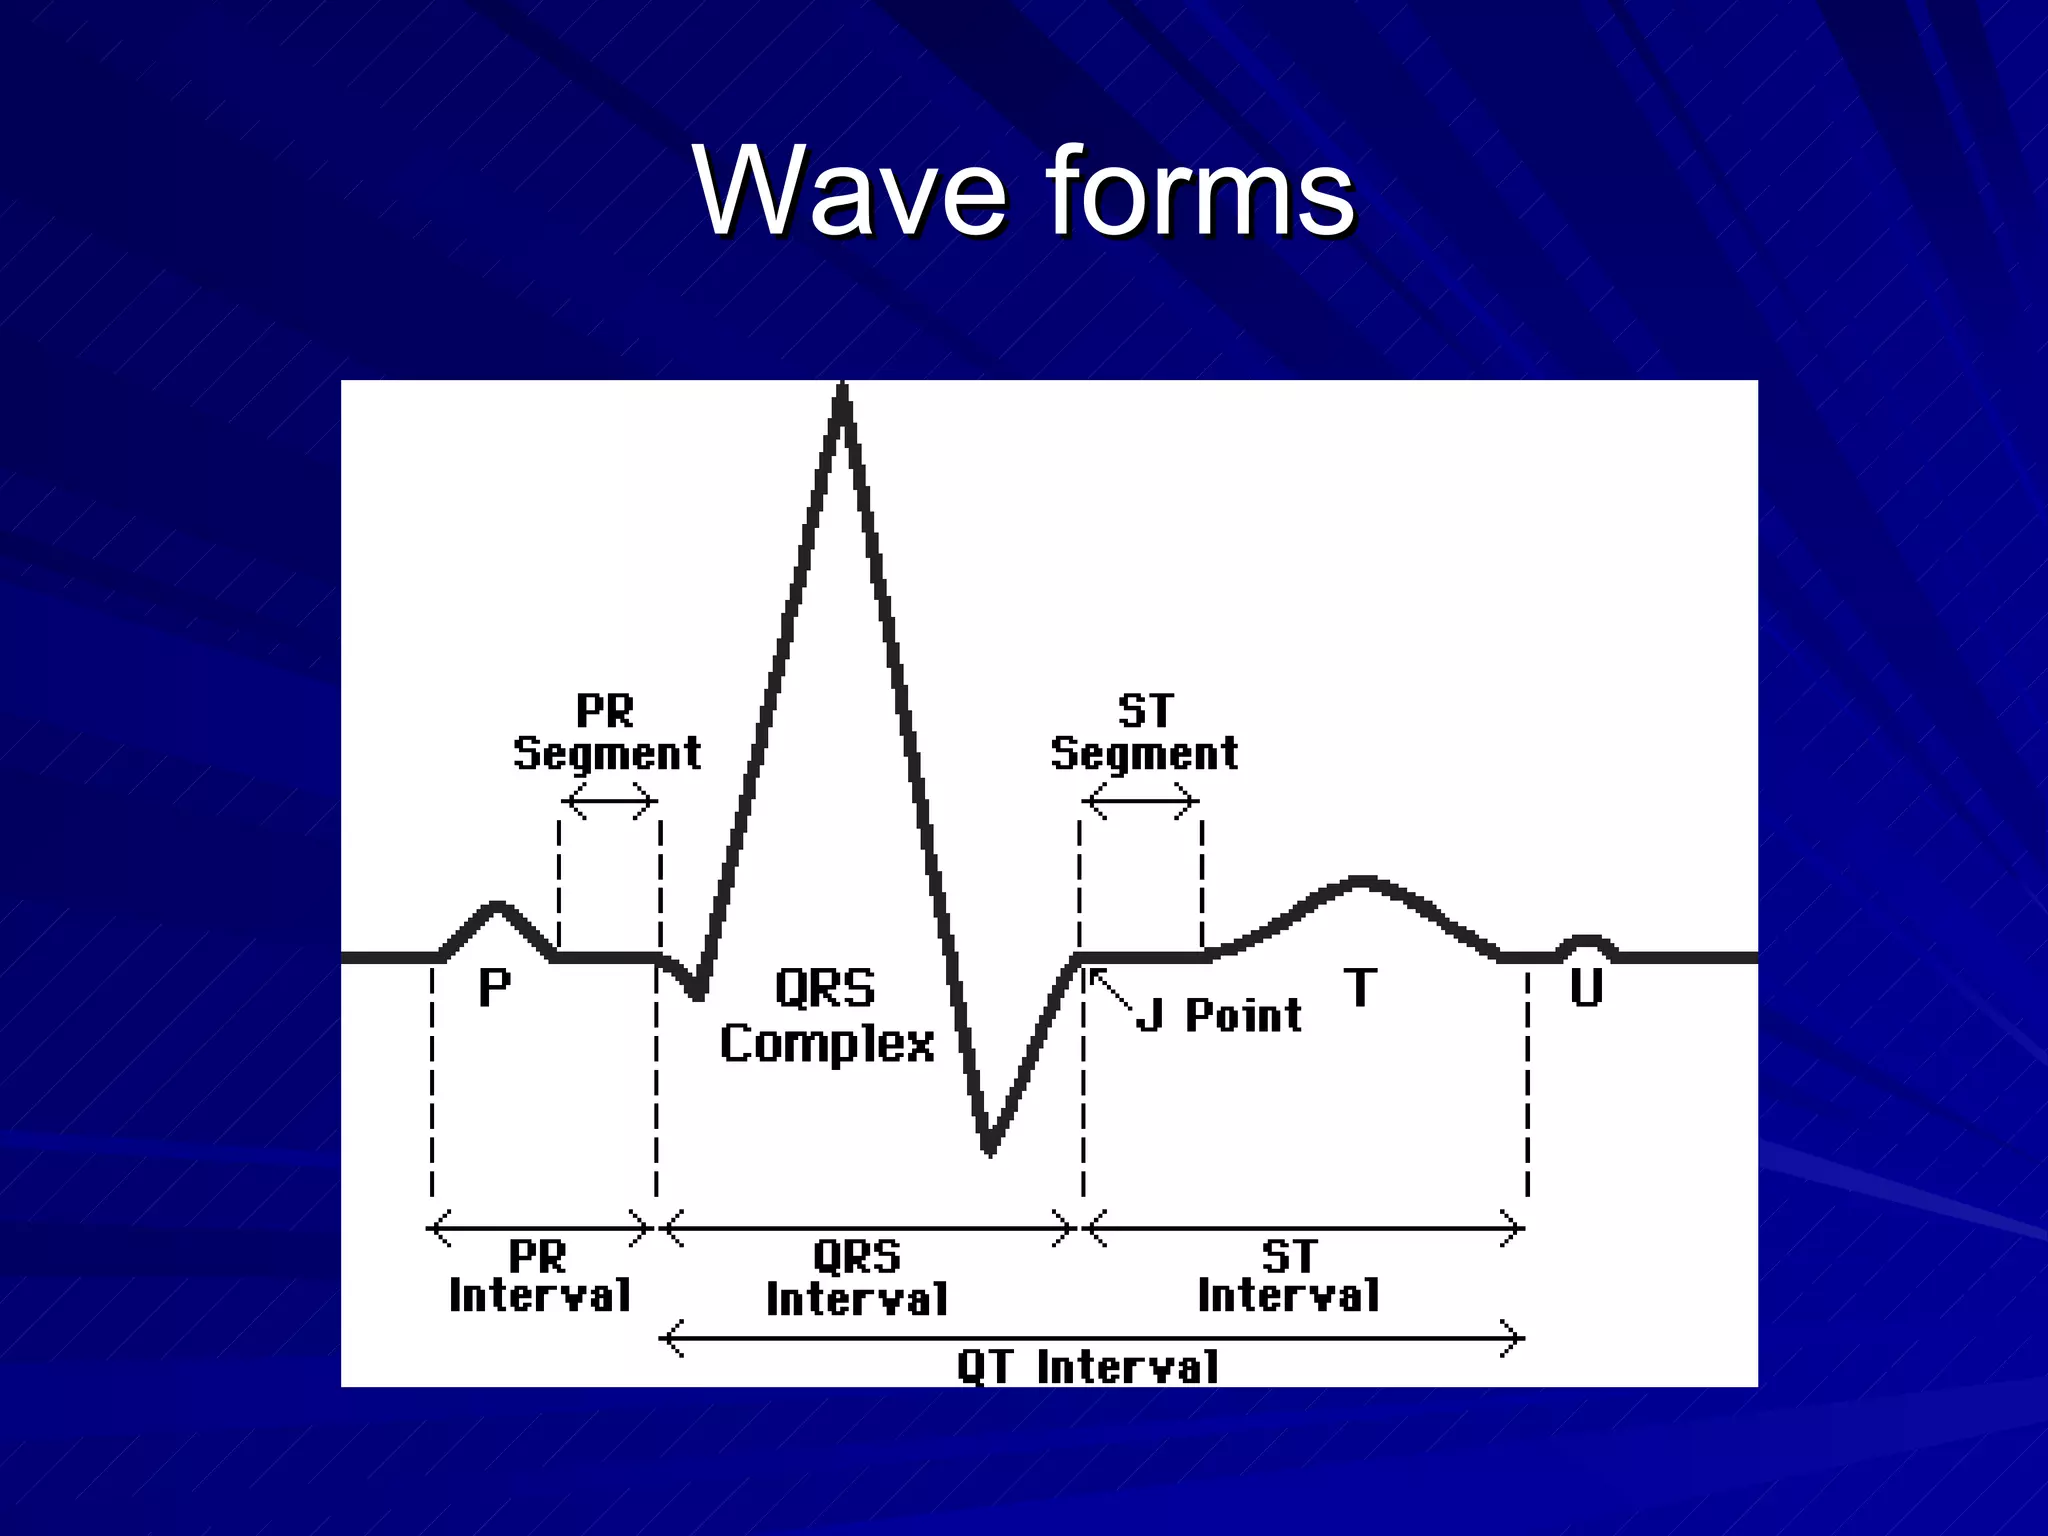
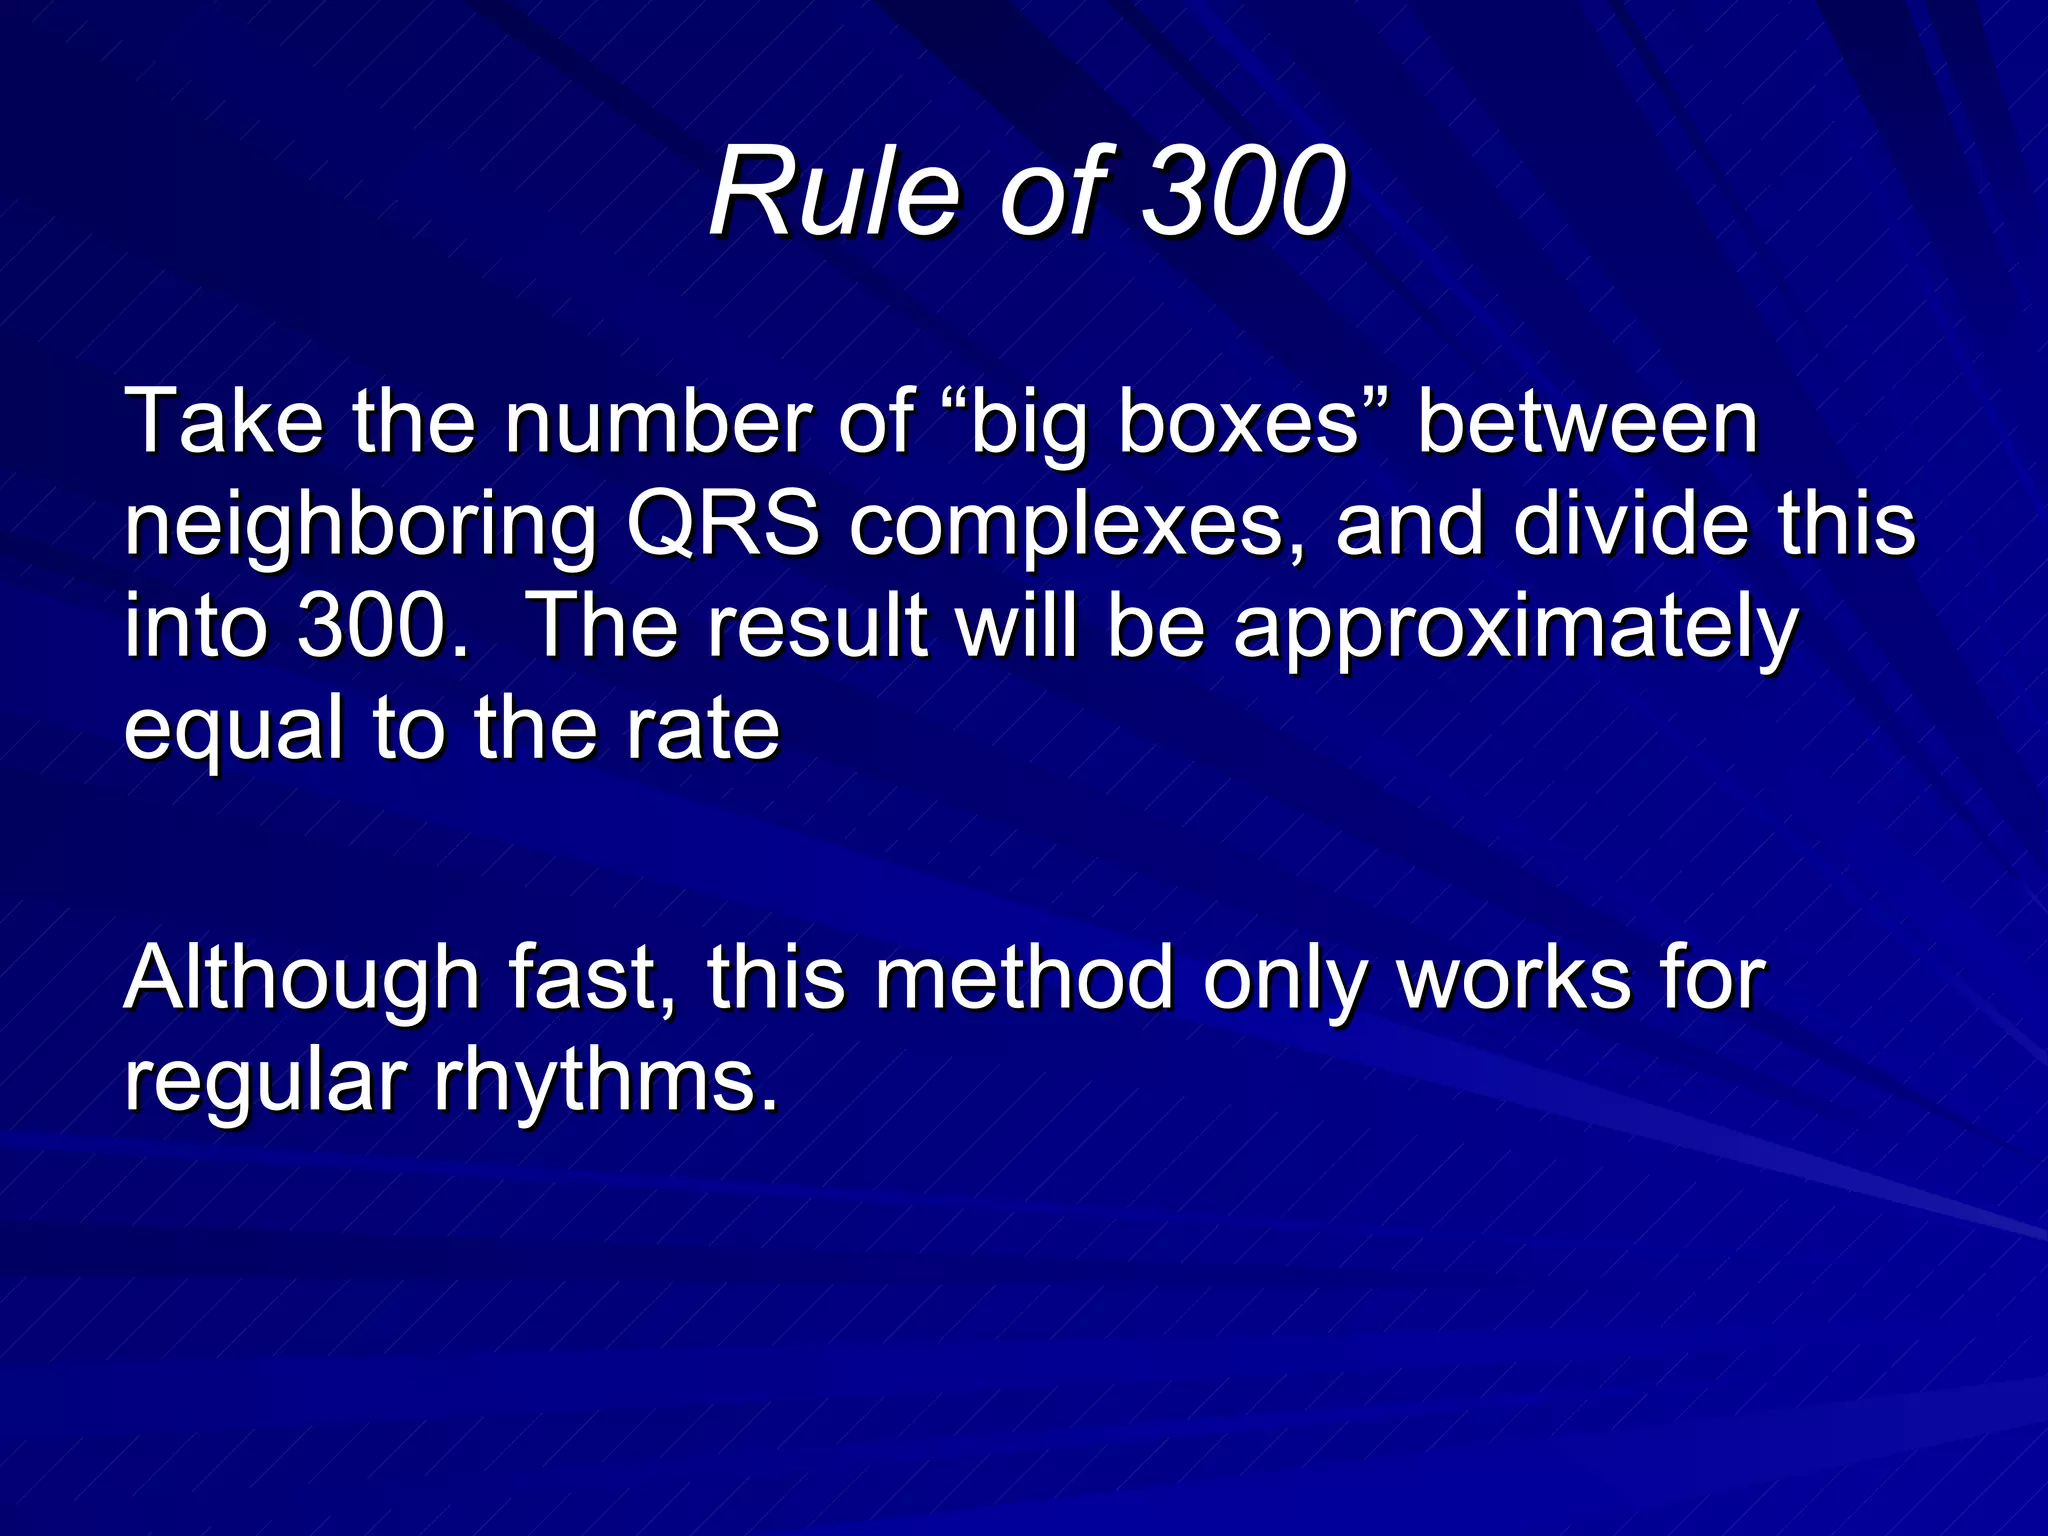
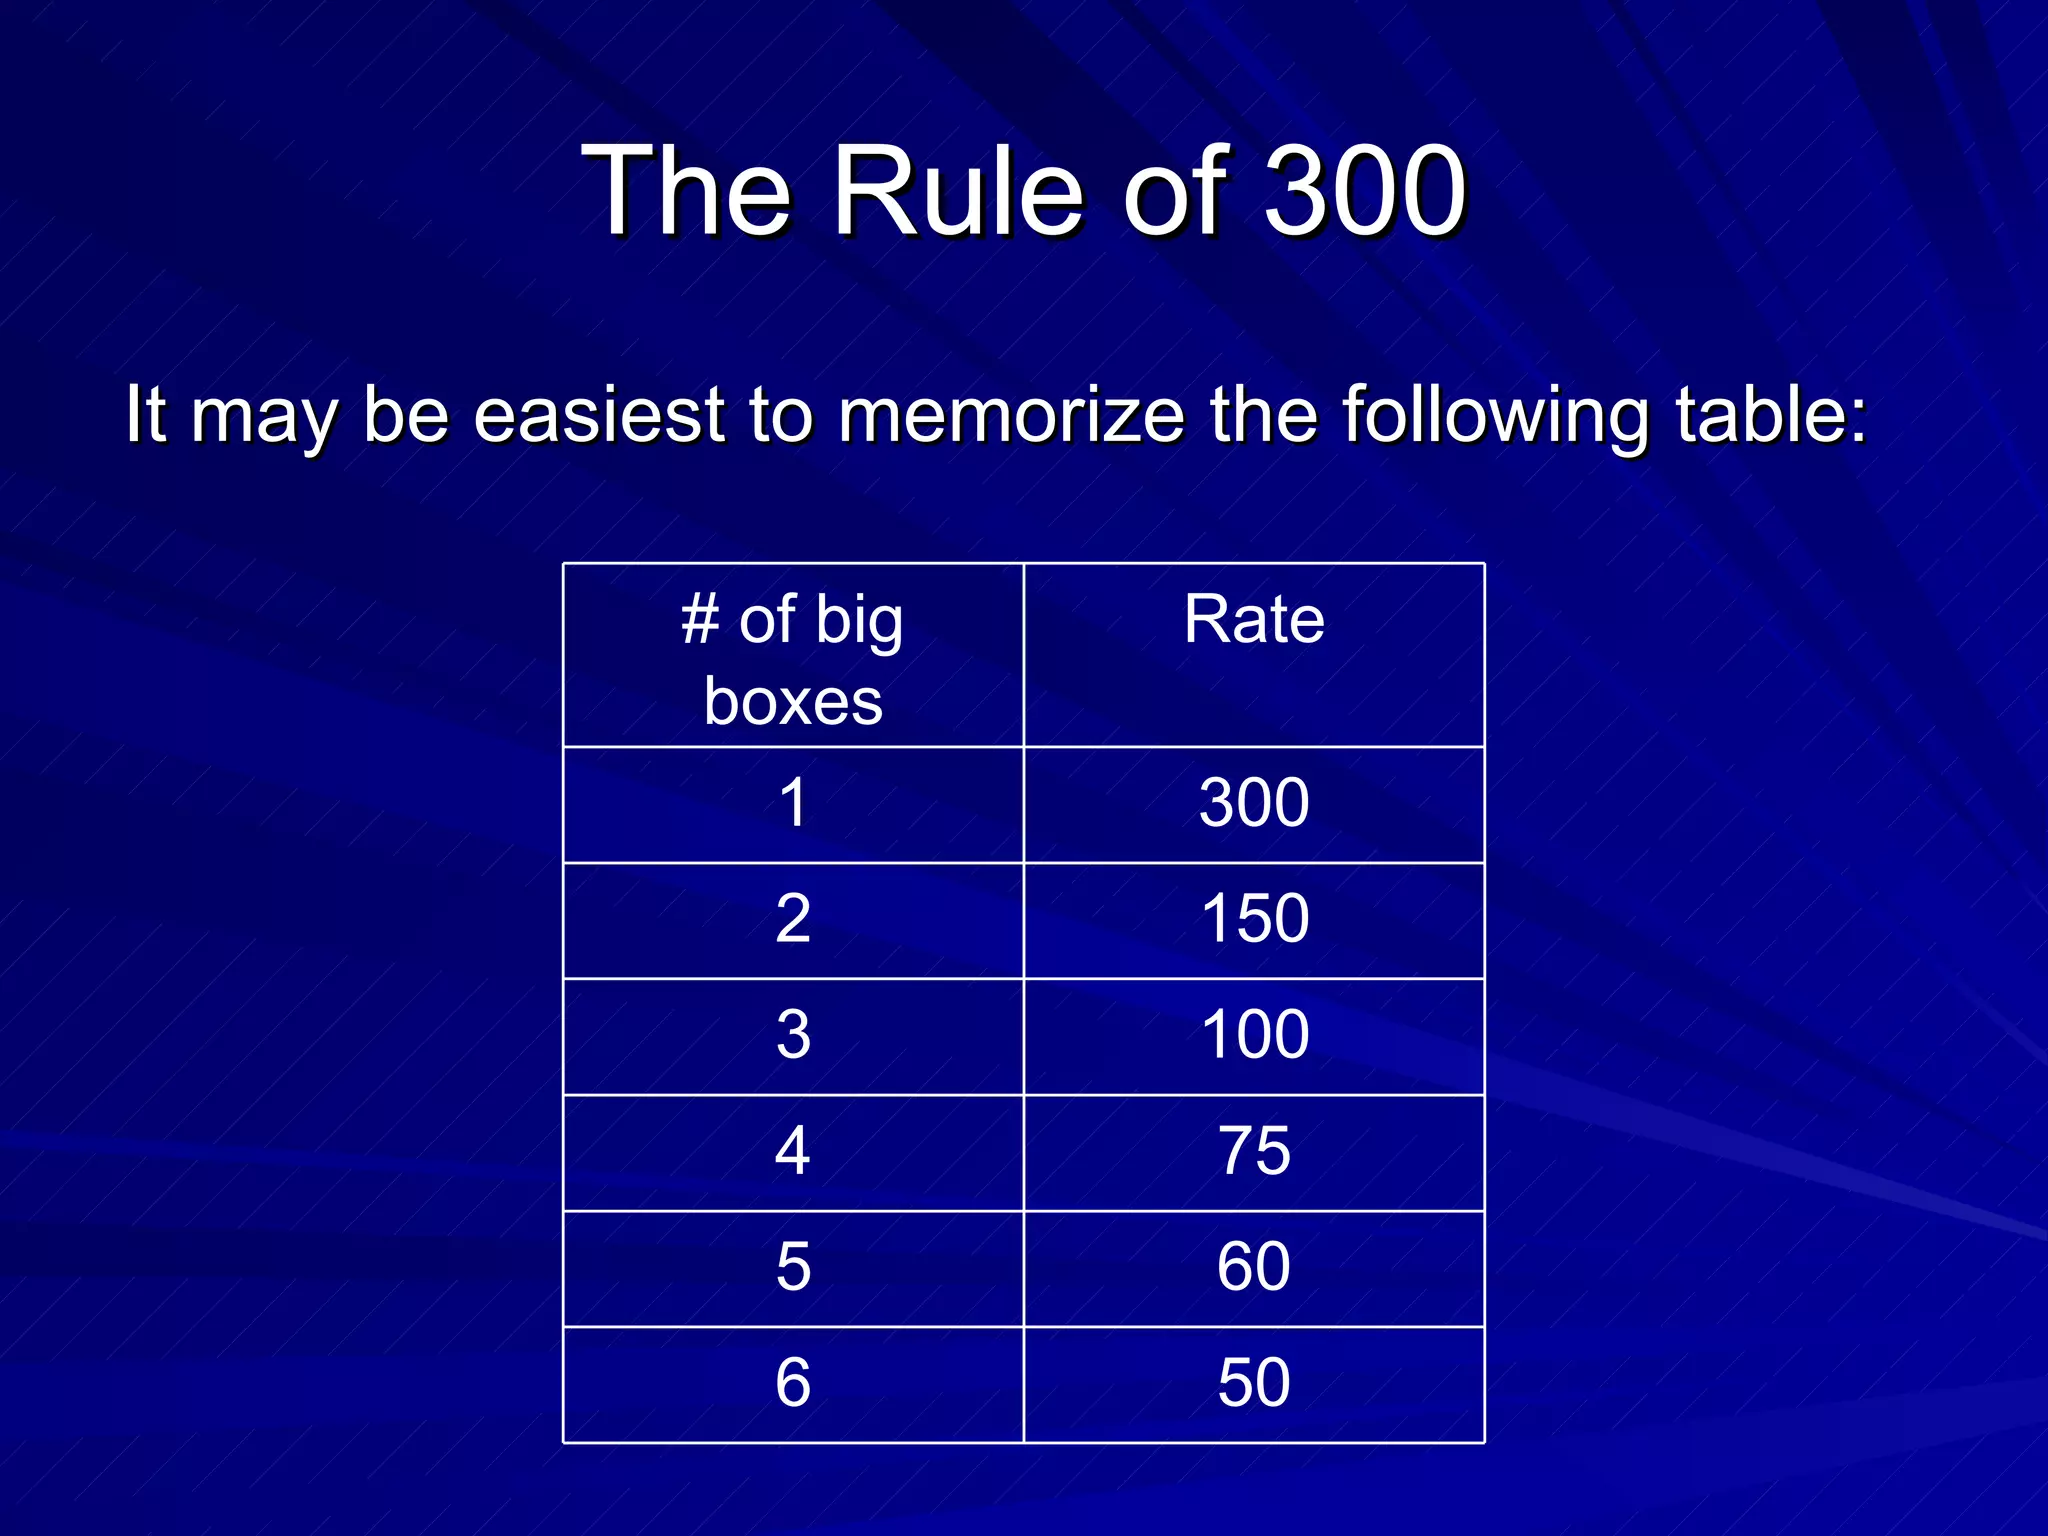
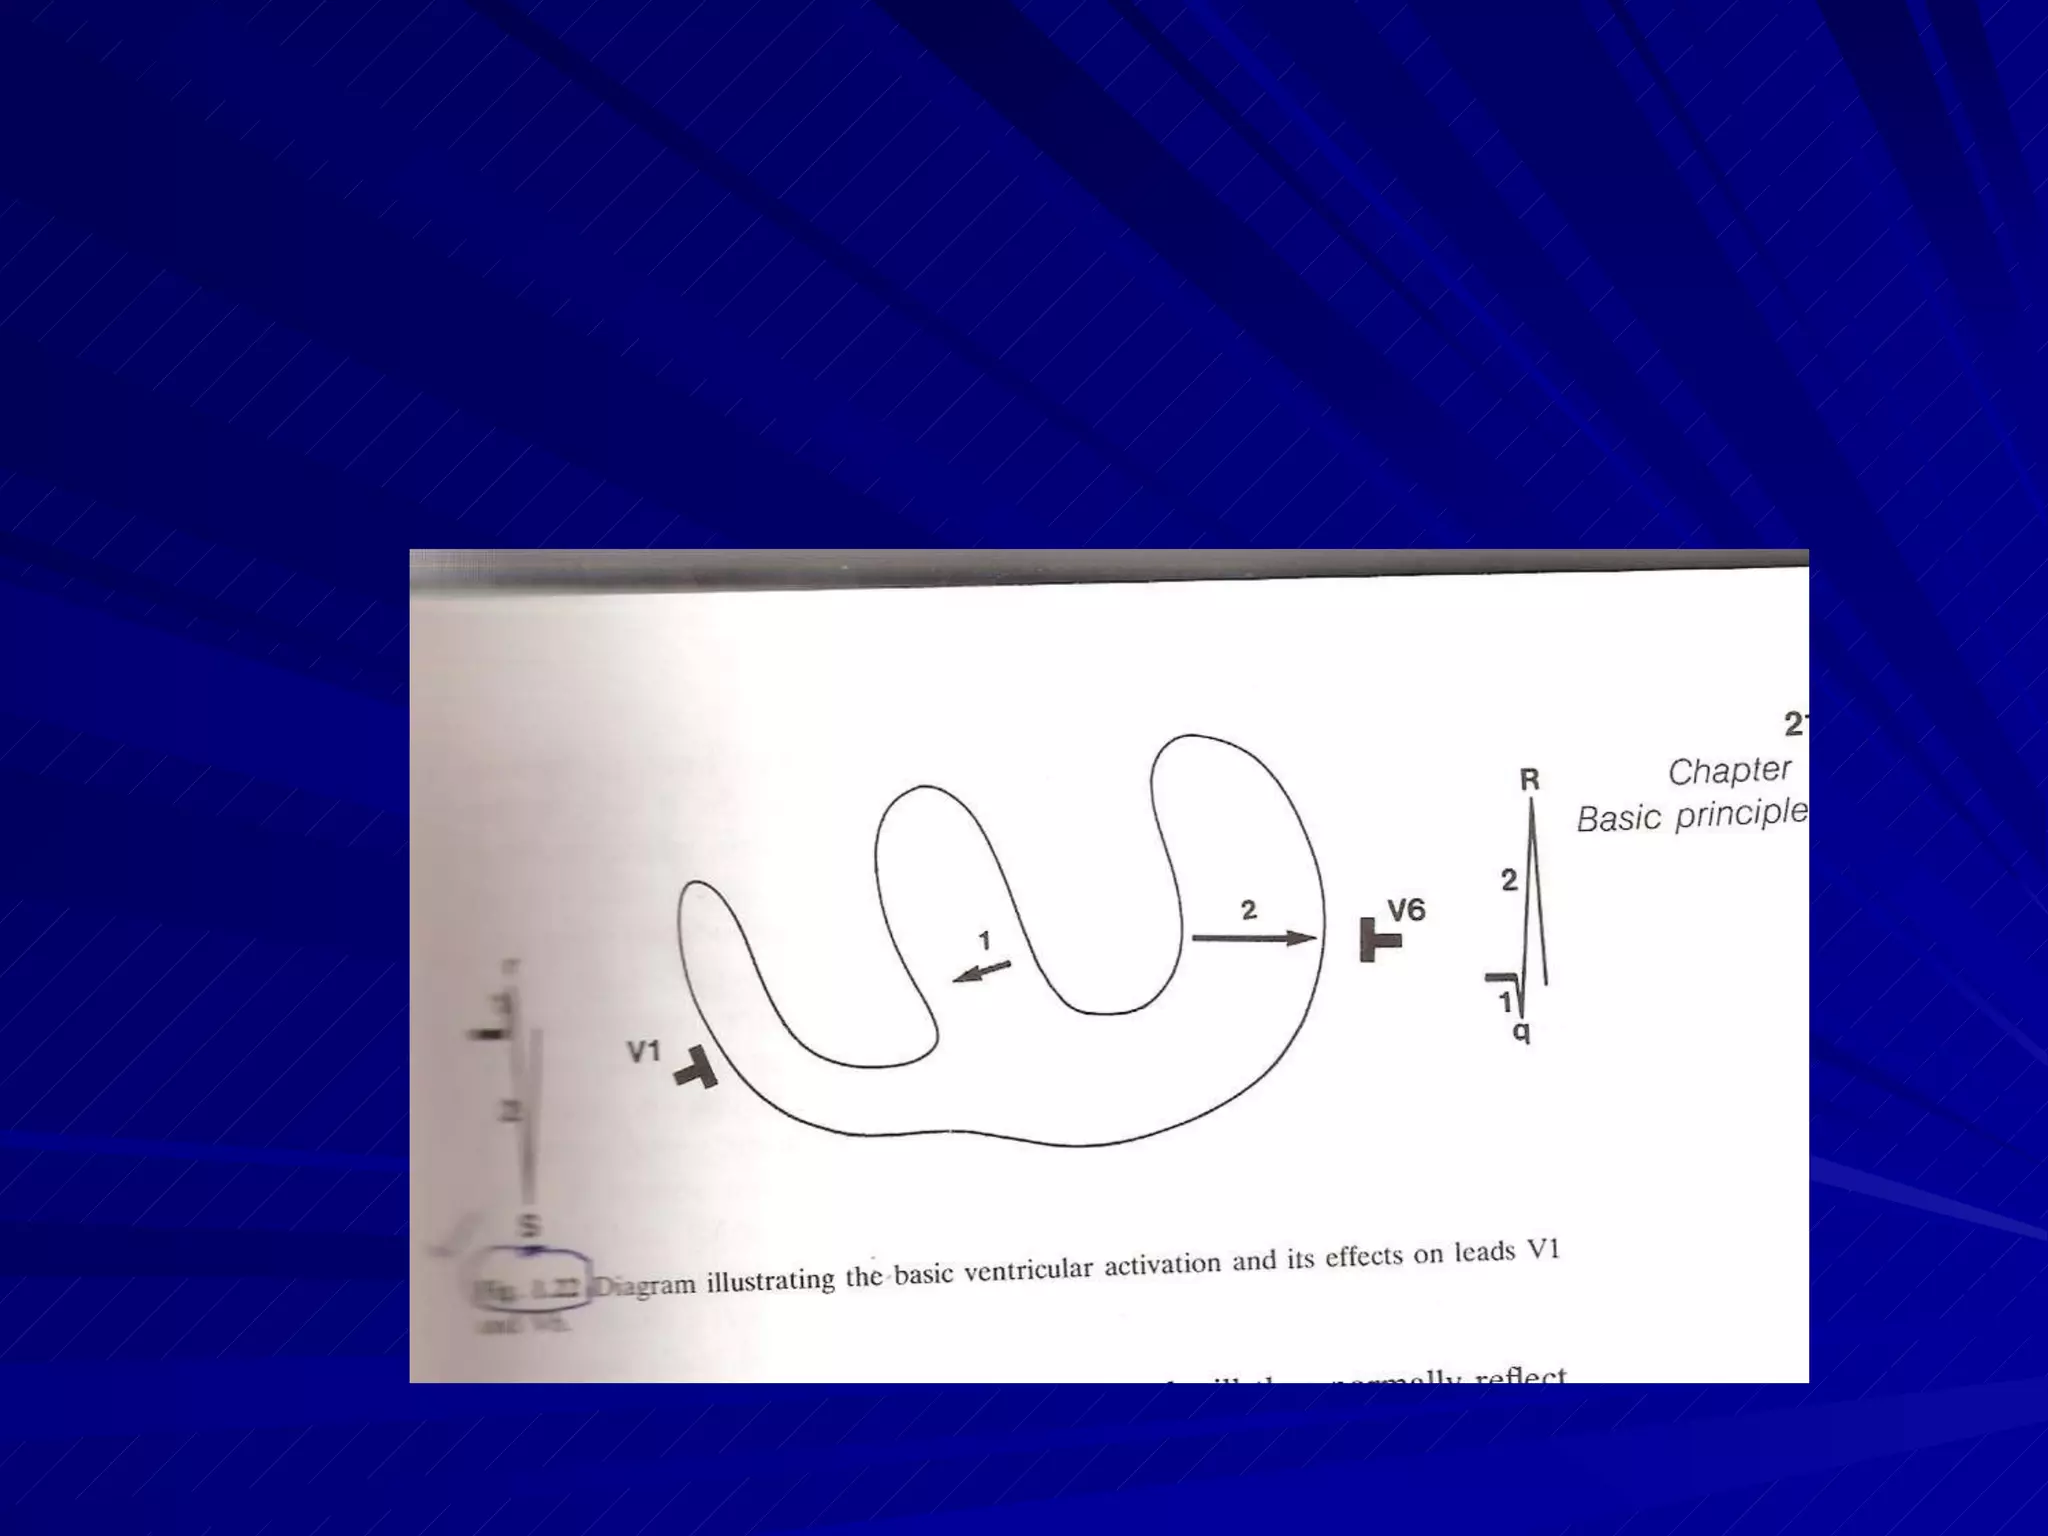
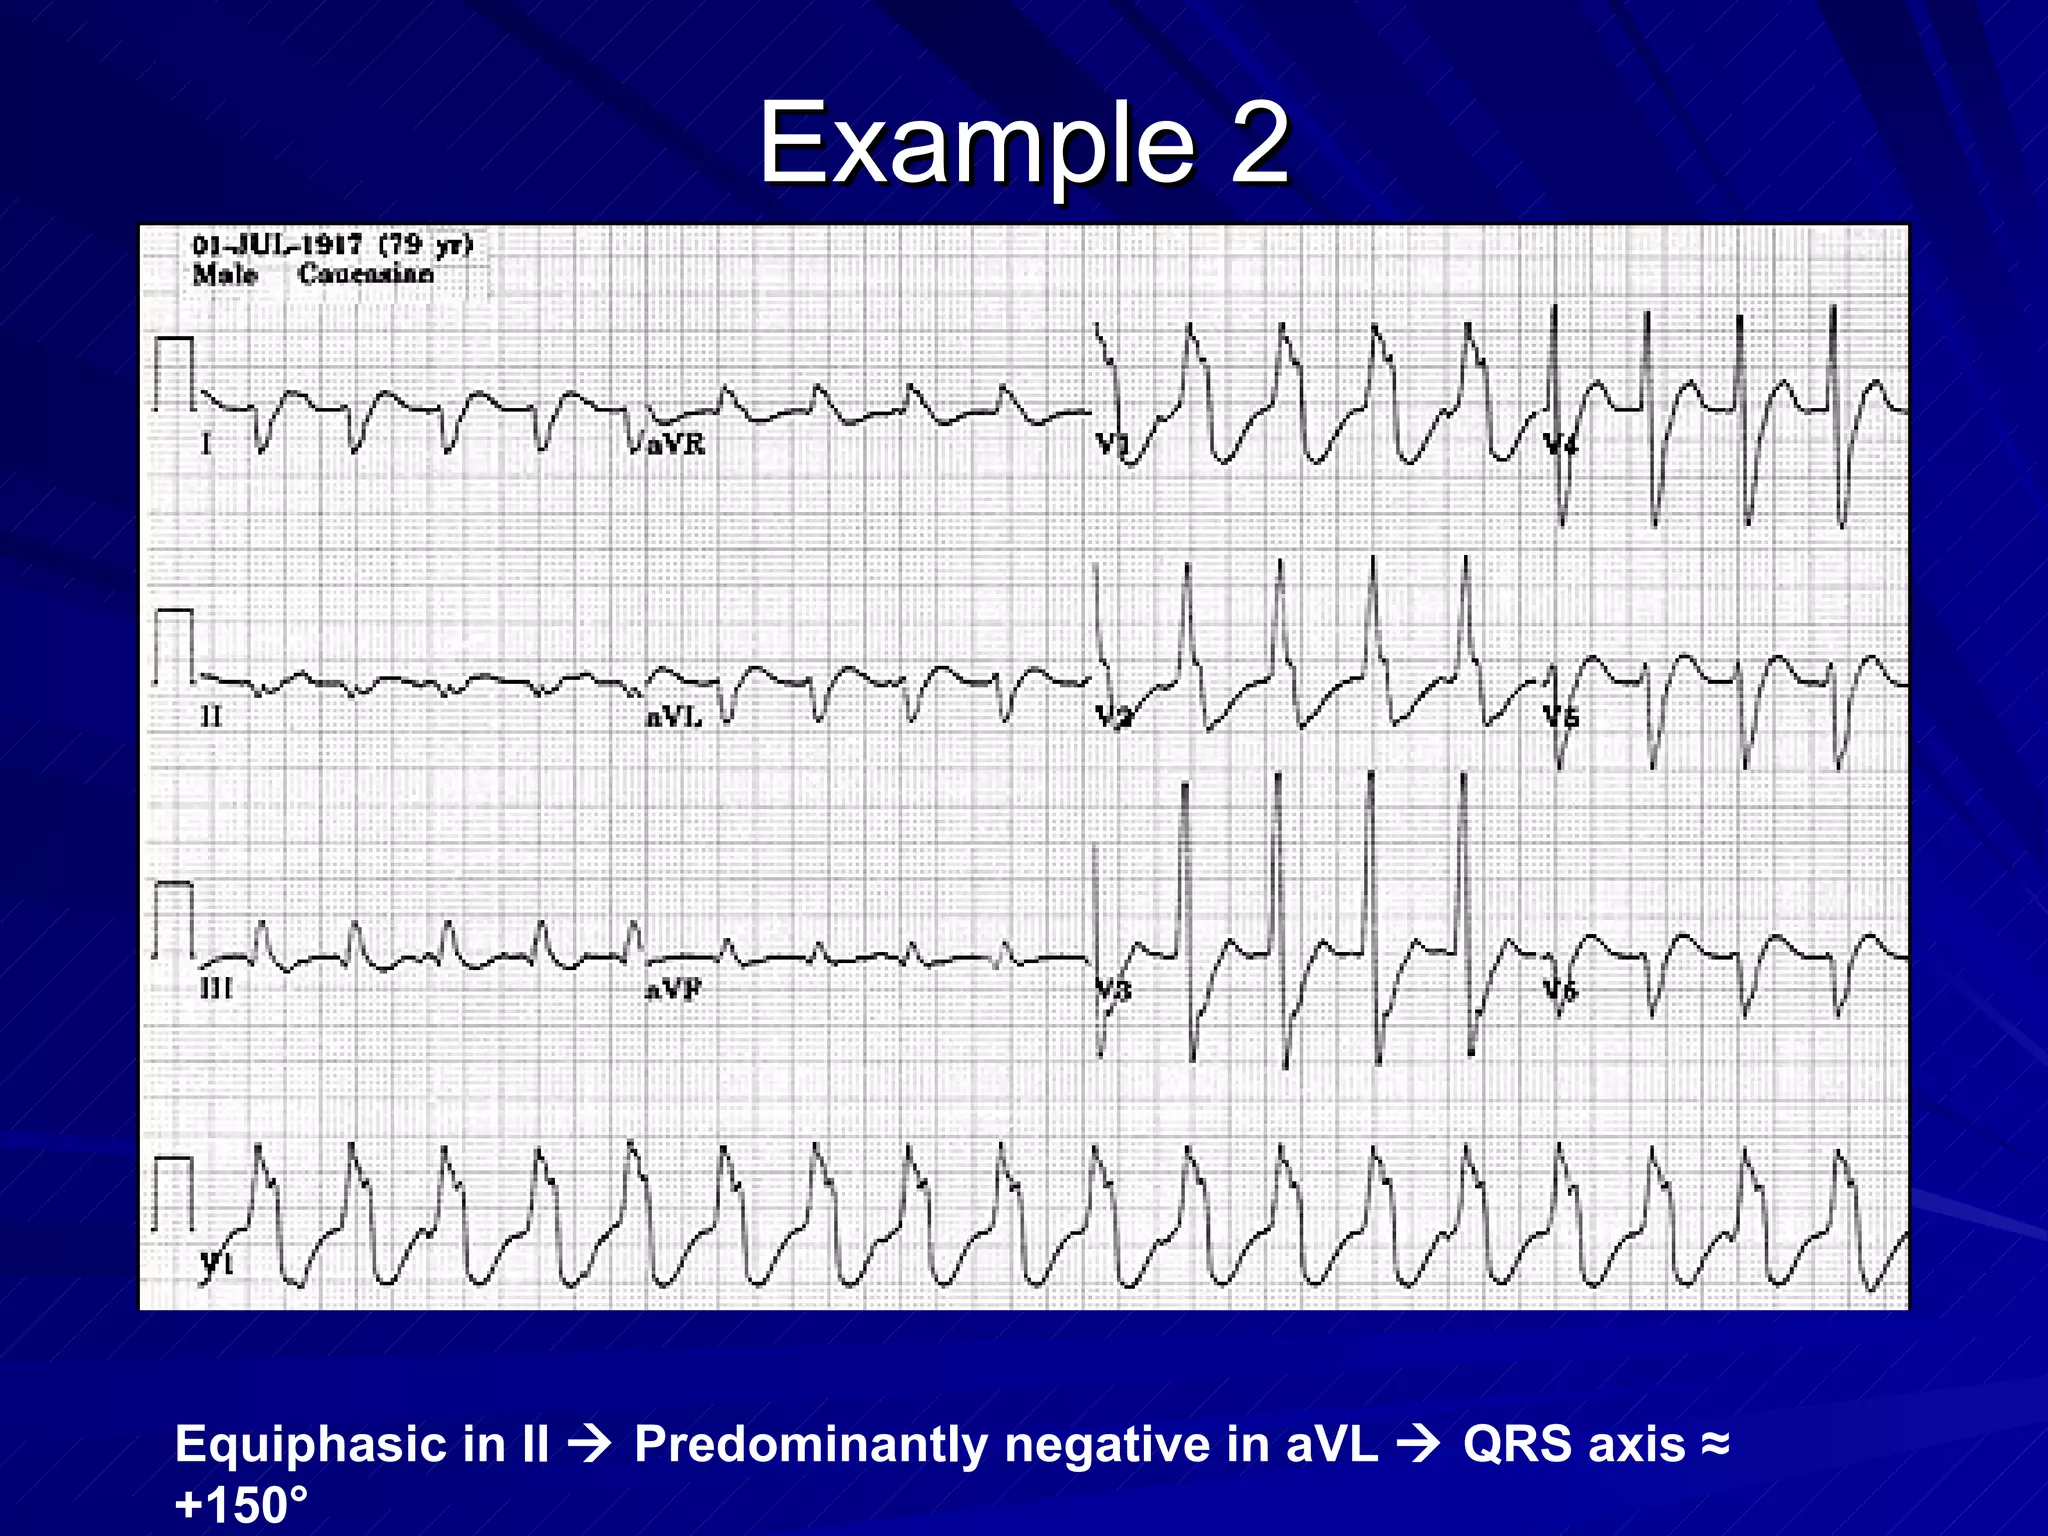
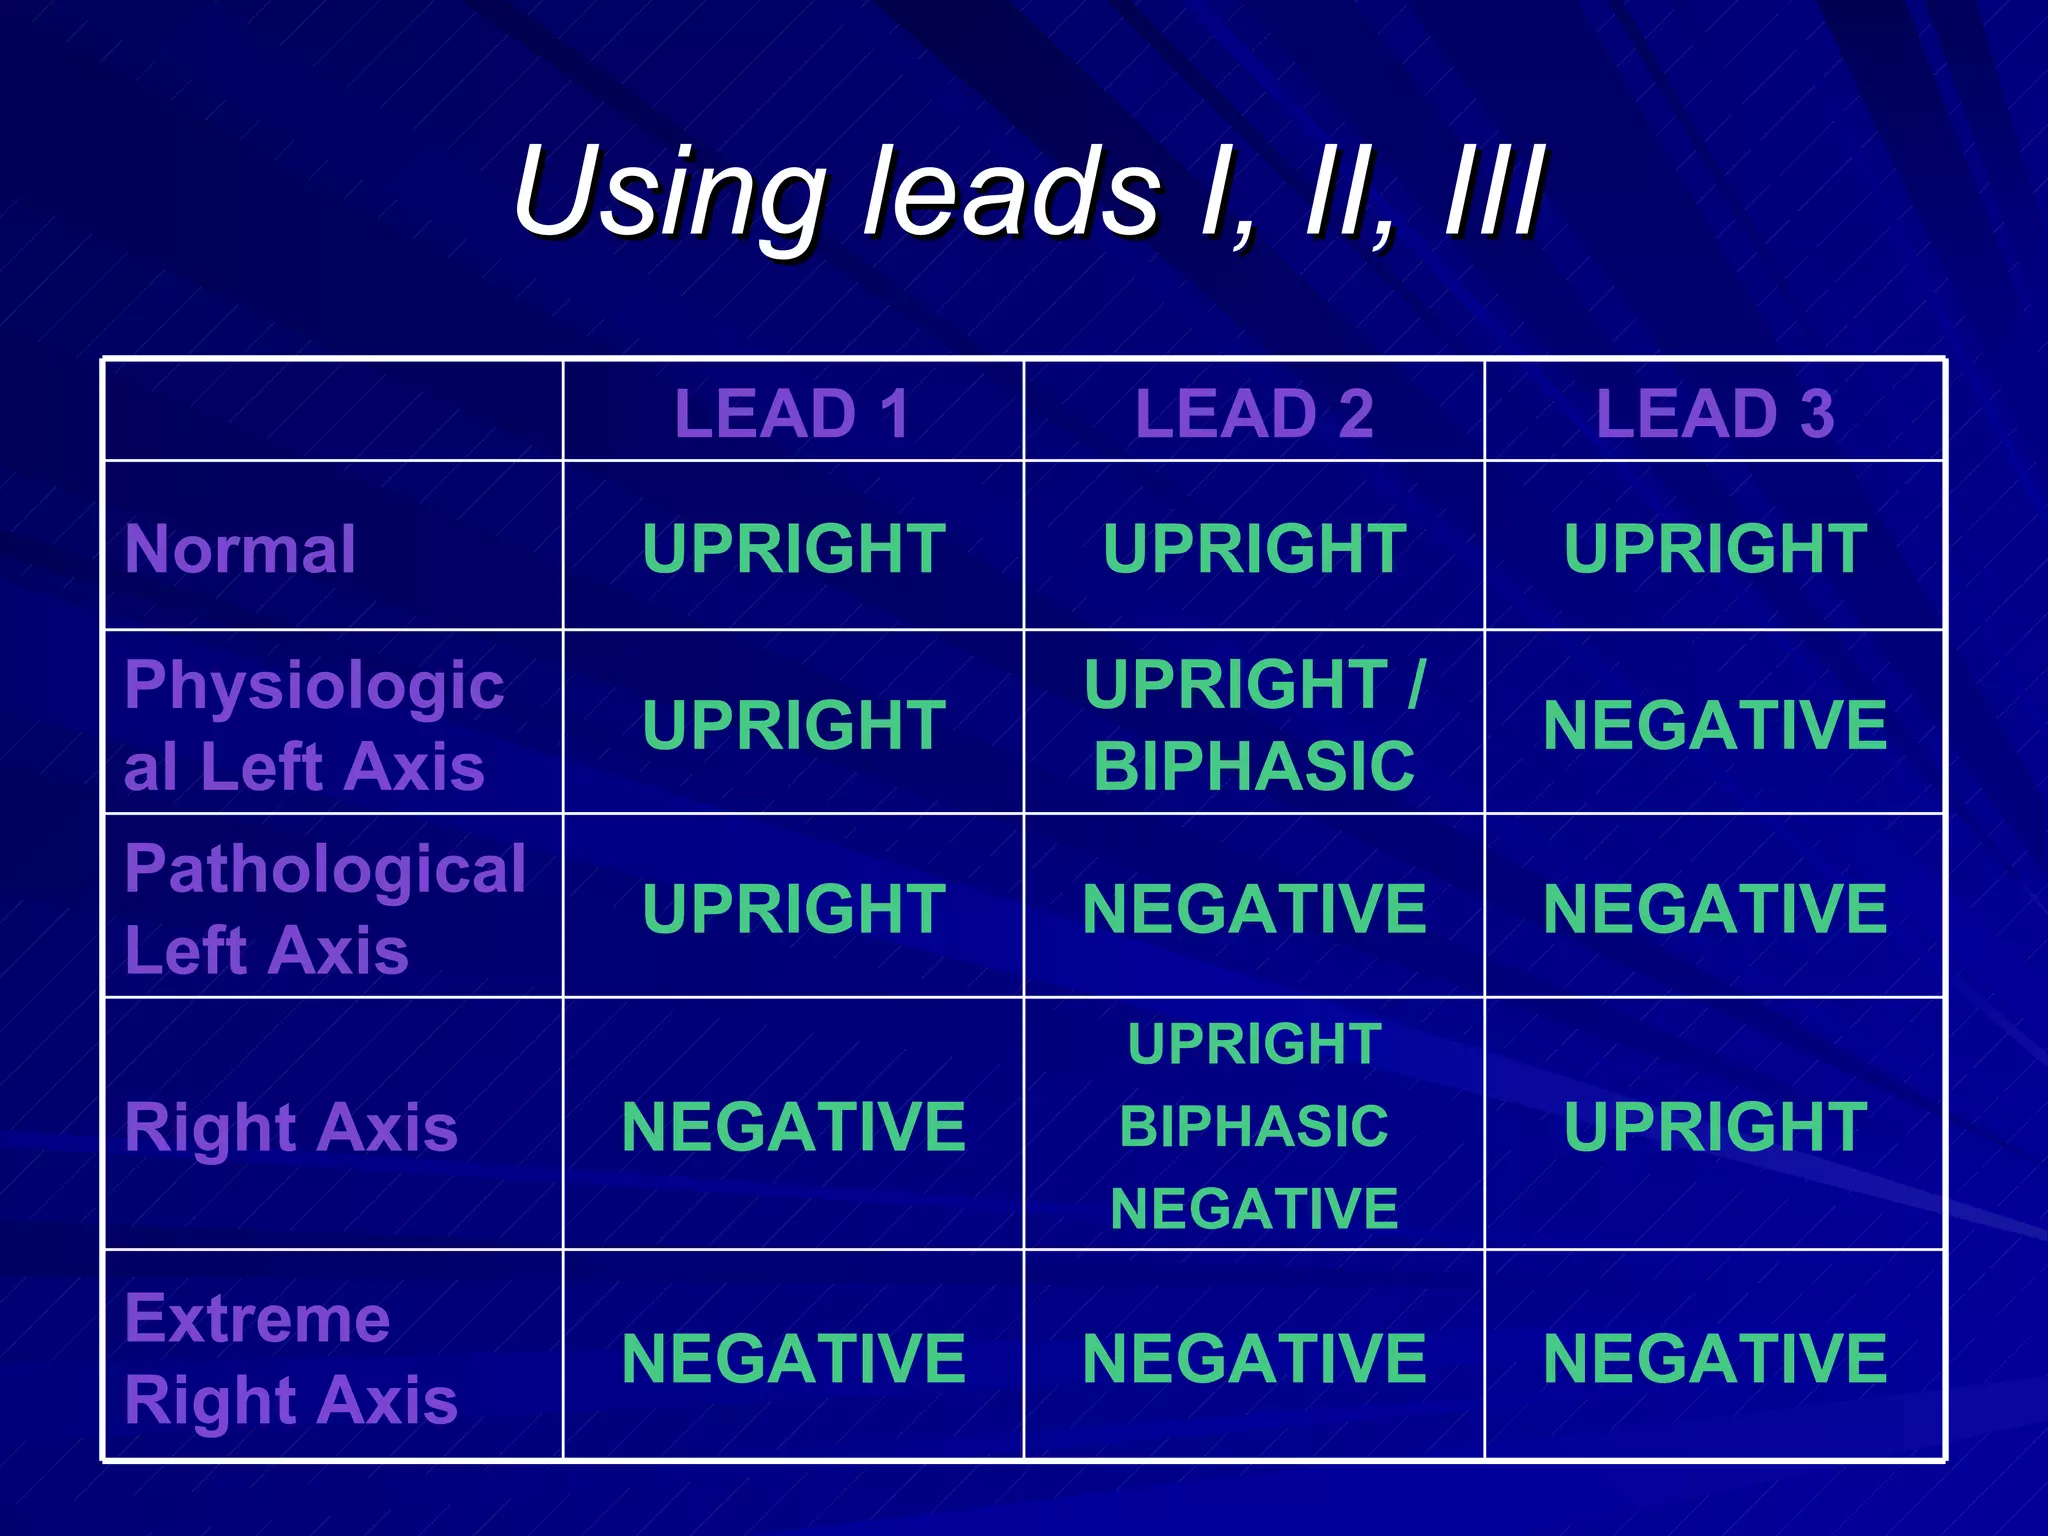
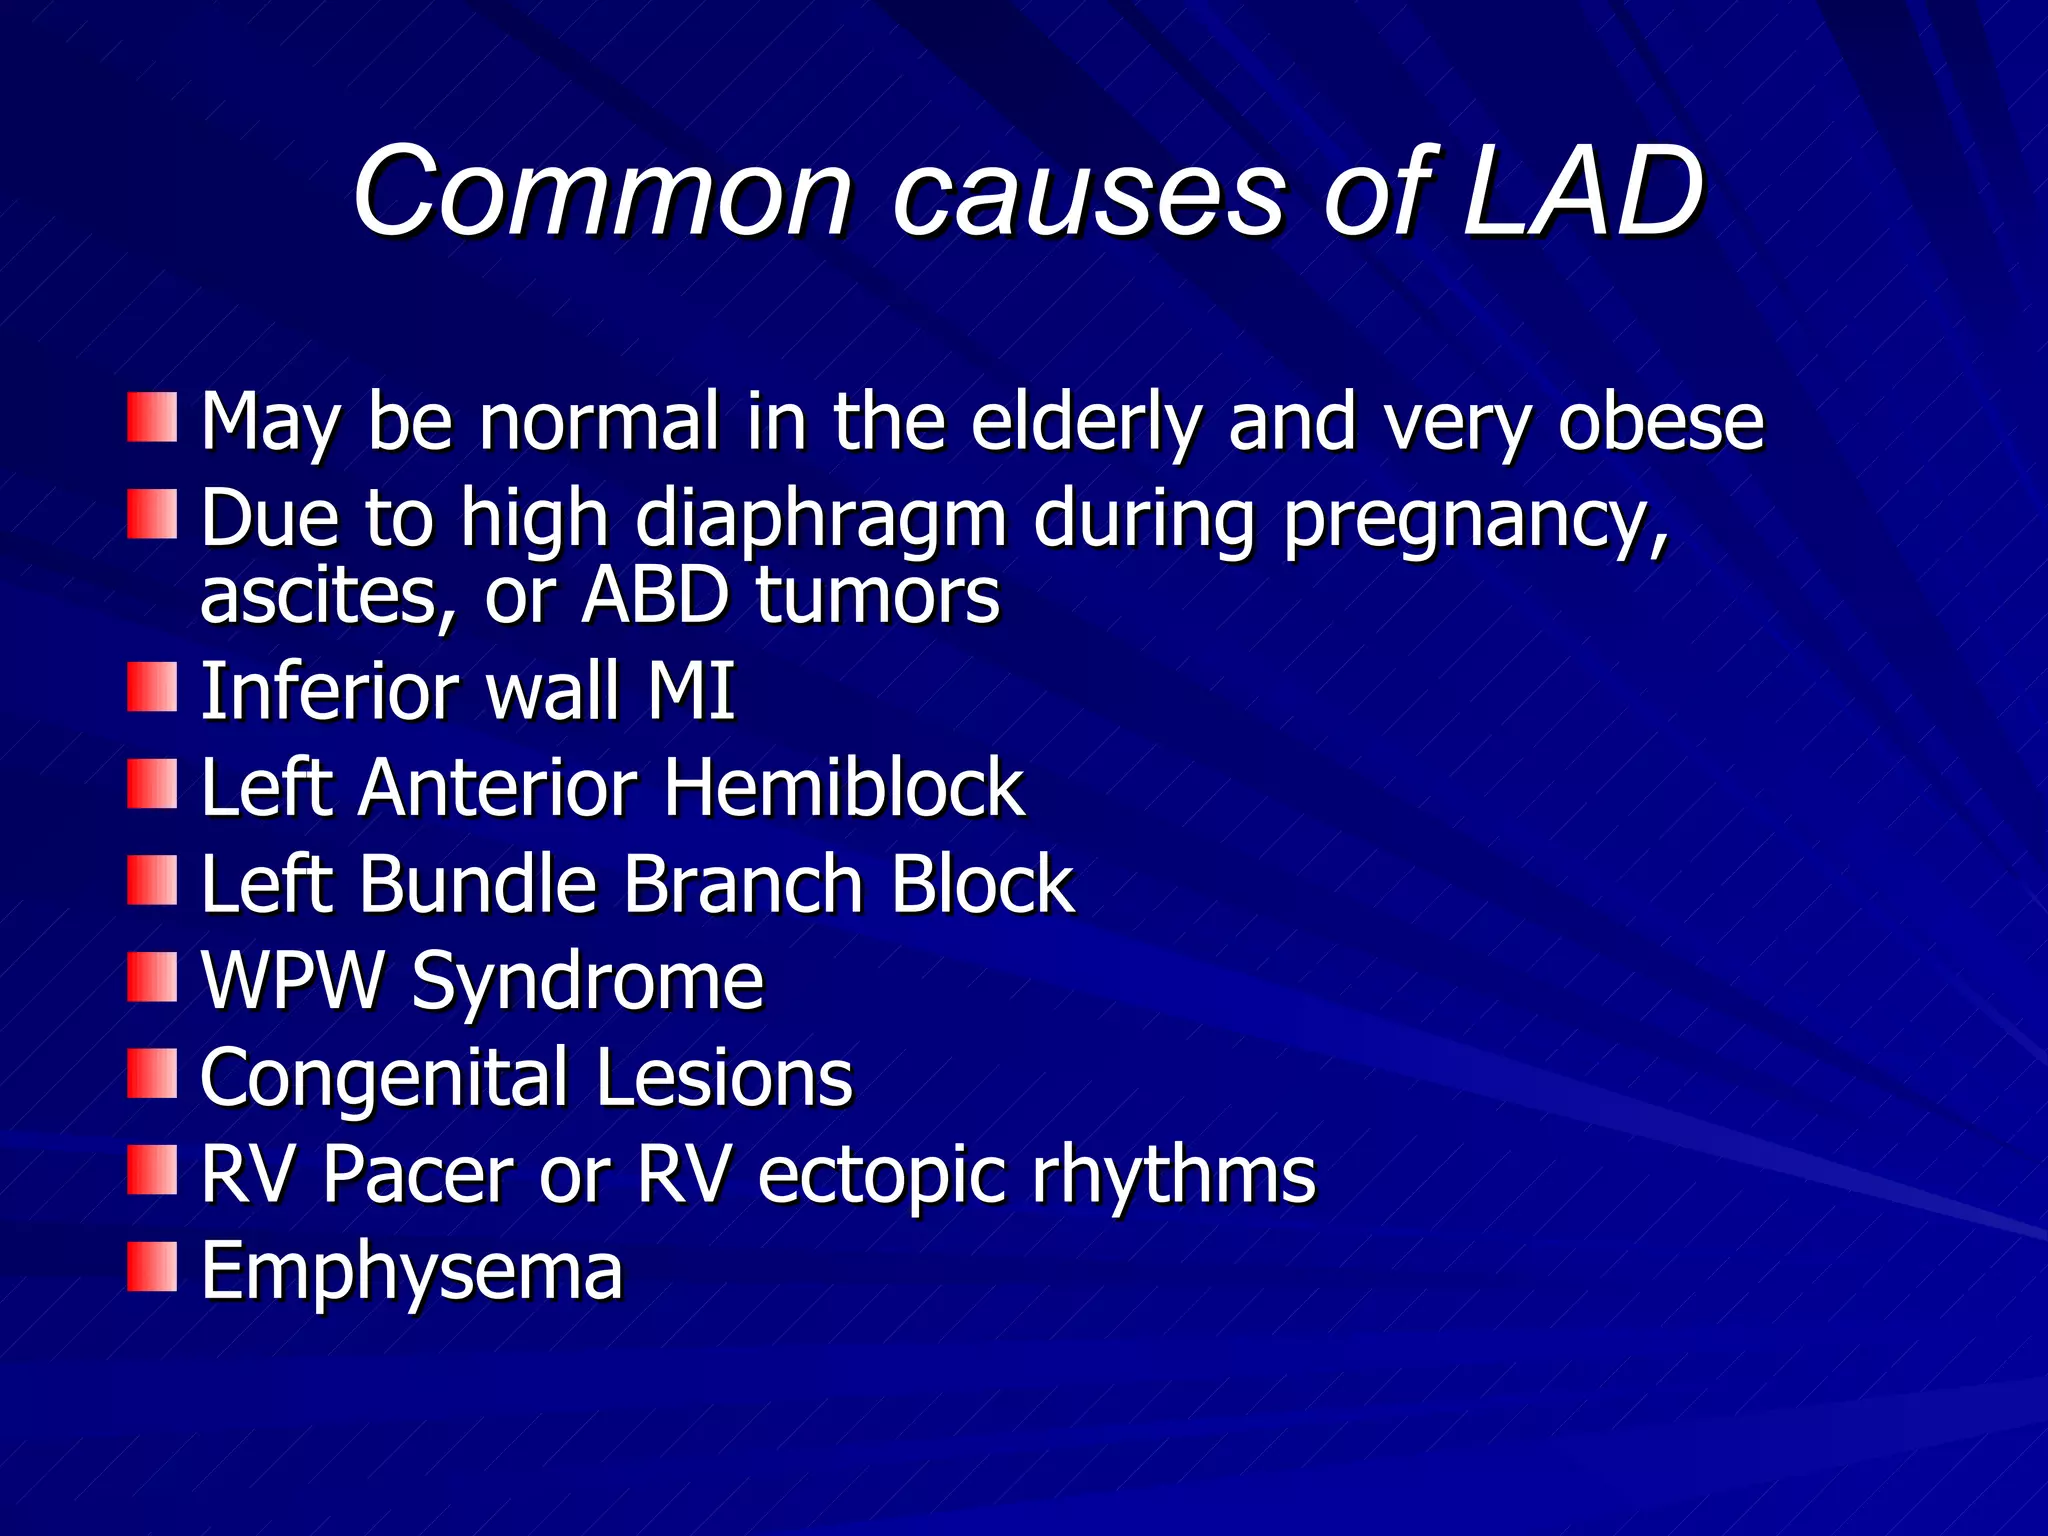
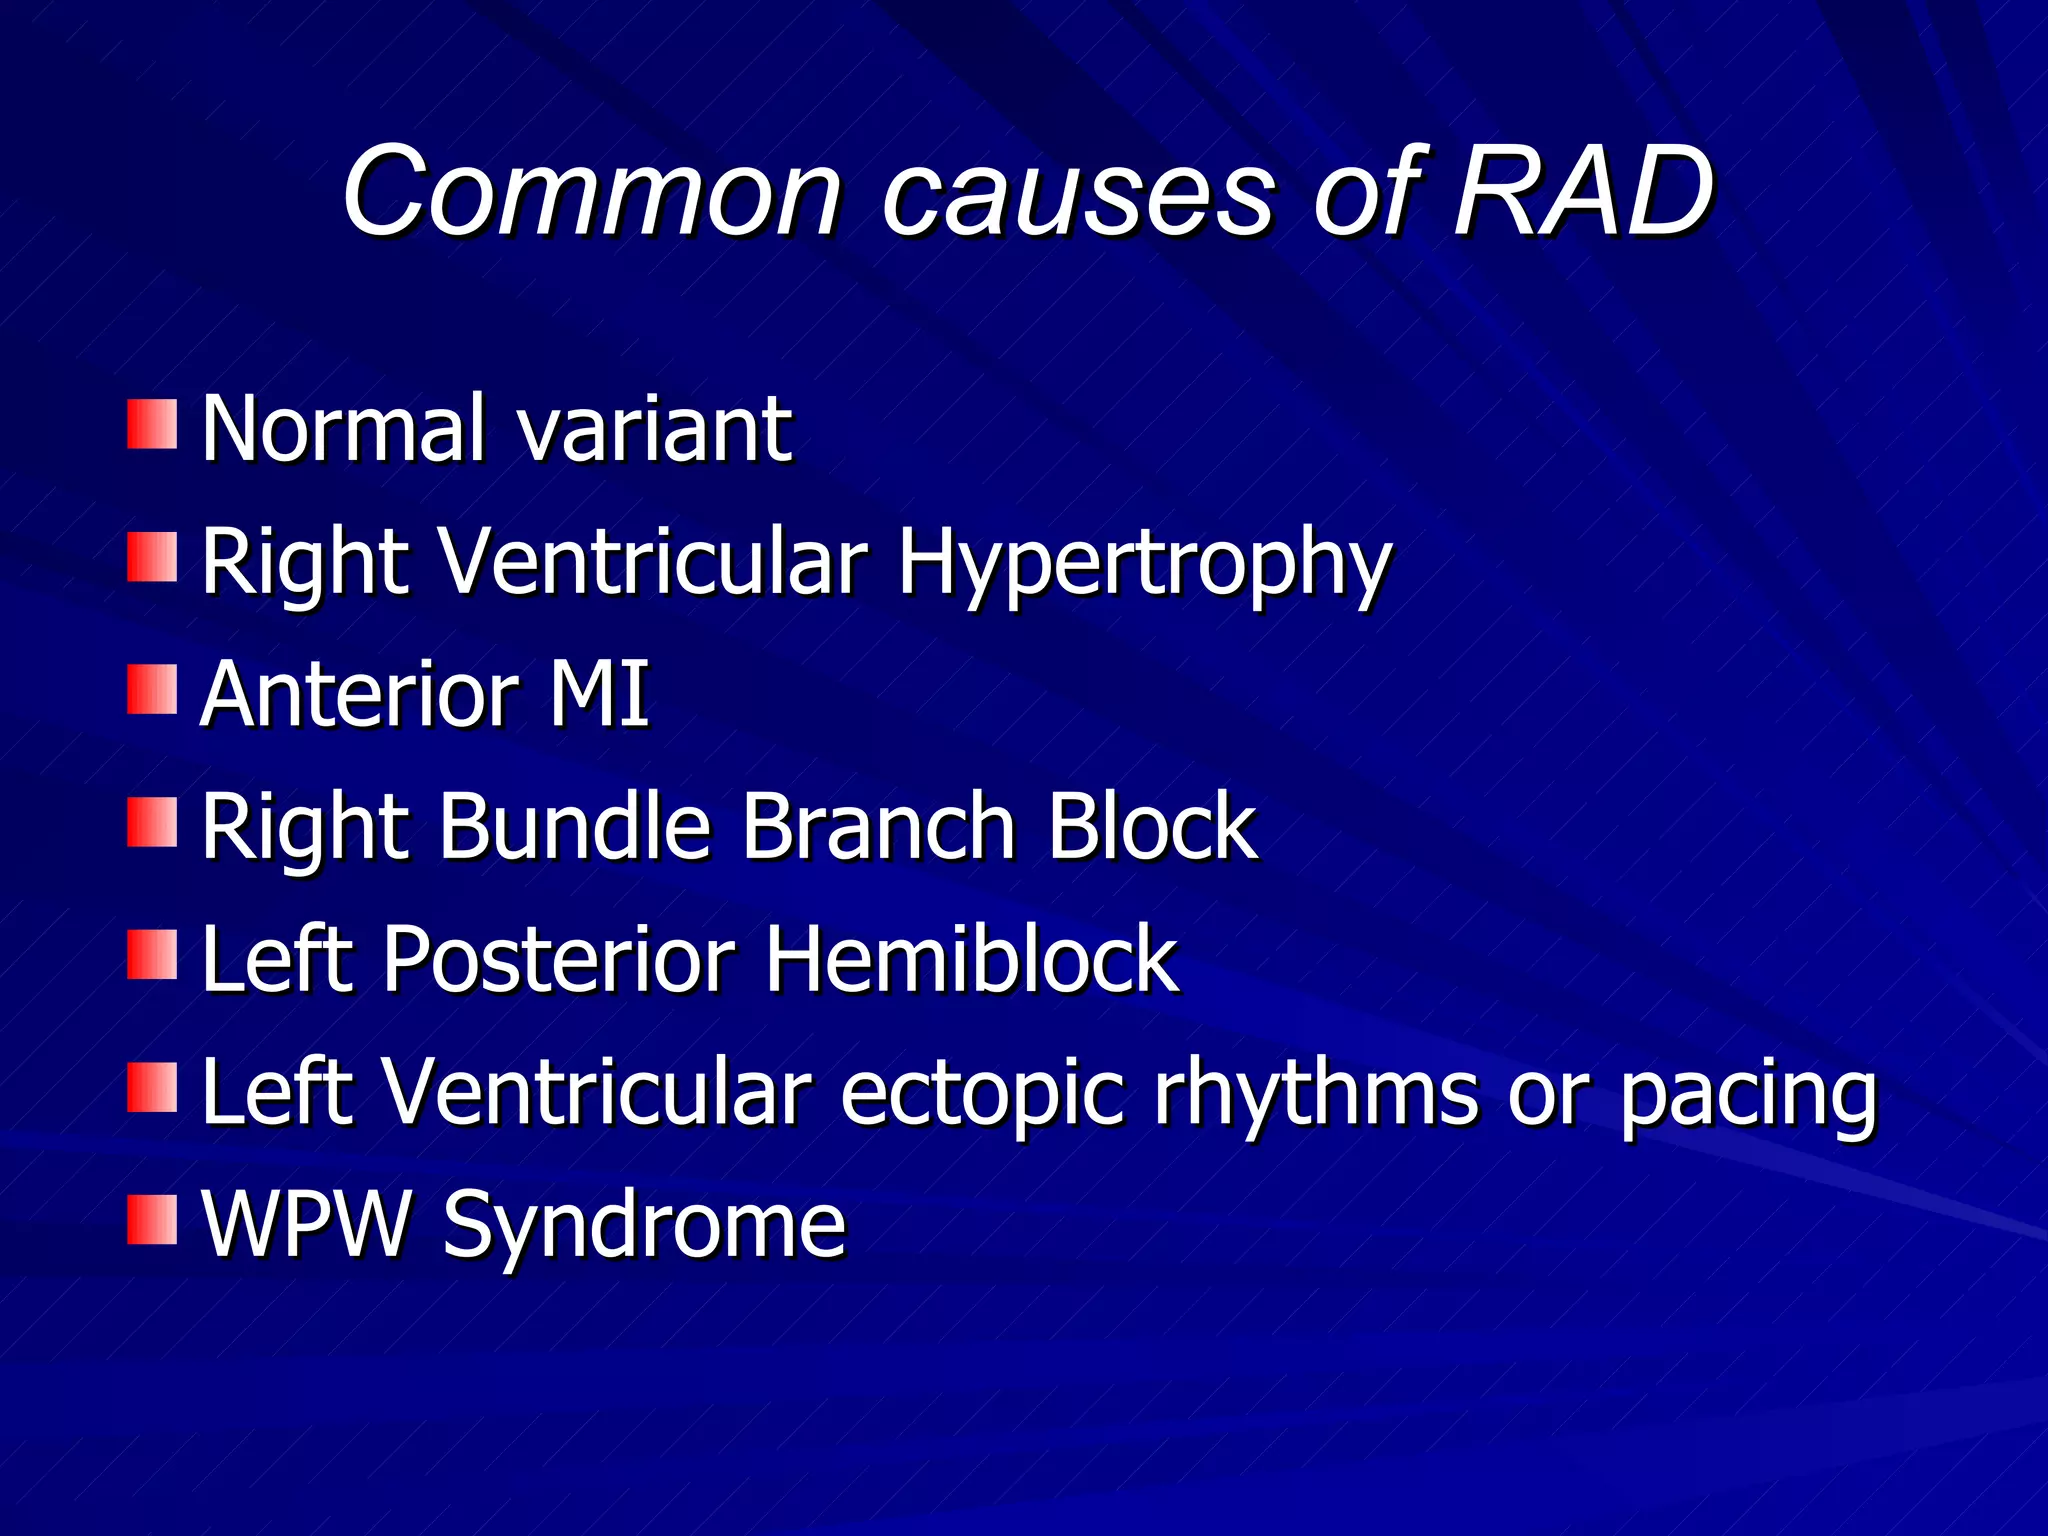
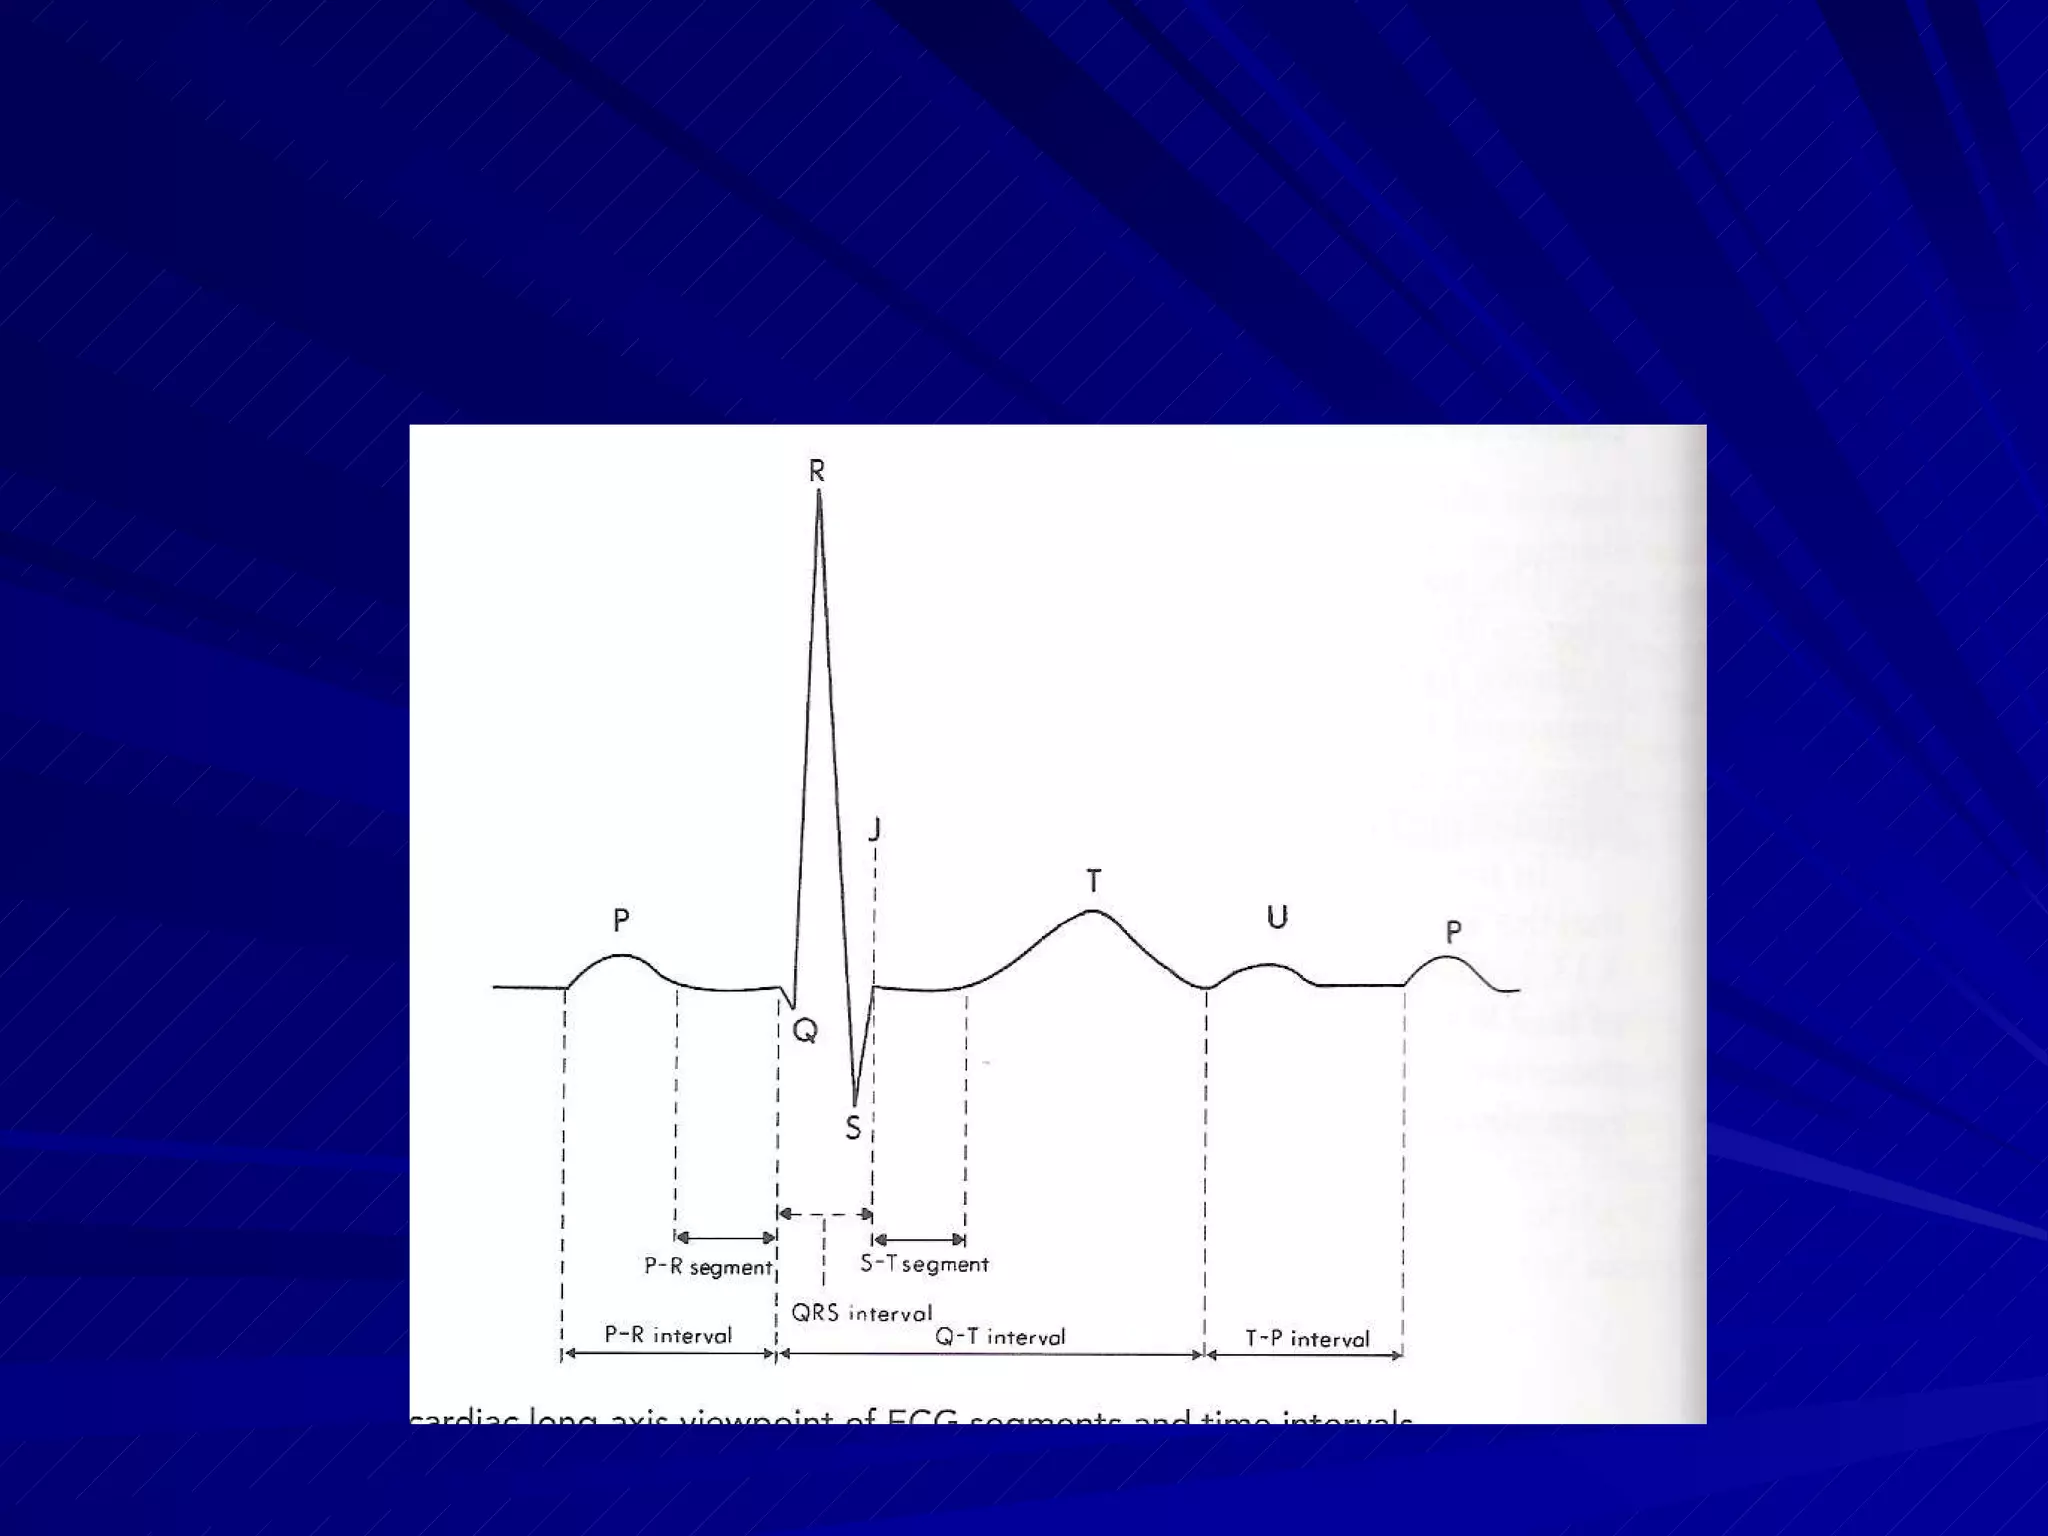
This document provides an overview of electrocardiography (ECG), including how an ECG works, the basics of recording an ECG, ECG leads, normal ECG waveforms and intervals, interpreting an ECG, common abnormalities, and how to report an ECG. It discusses topics such as the cardiac conduction system, Einthoven's triangle, the 12-lead ECG, determining heart rate and axis, normal sinus rhythm, P waves, QRS complex, ST segment, T waves, and the QT interval.
59. The QRS Axis By near-consensus, the normal QRS axis is defined as ranging from -30 ° to +90 ° . -30 ° to -90 ° is referred to as a left axis deviation (LAD) +90 ° to +180 ° is referred to as a right axis deviation (RAD)
70. Using leads I, II, III NEGATIVE NEGATIVE UPRIGHT Pathological Left Axis UPRIGHT UPRIGHT BIPHASIC NEGATIVE NEGATIVE Right Axis NEGATIVE NEGATIVE NEGATIVE Extreme Right Axis NEGATIVE UPRIGHT / BIPHASIC UPRIGHT Physiological Left Axis UPRIGHT UPRIGHT UPRIGHT Normal LEAD 3 LEAD 2 LEAD 1
76. Sinus Arrhythmia ECG Characteristics: Presence of sinus P waves Variation of the PP interval which cannot be attributed to either SA nodal block or PACs When the variations in PP interval occur in phase with respiration, this is considered to be a normal variant. When they are unrelated to respiration, they may be caused by the same etiologies leading to sinus bradycardia.