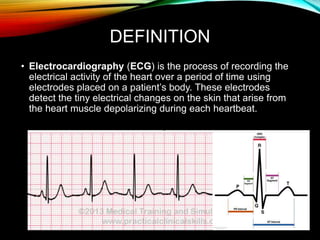
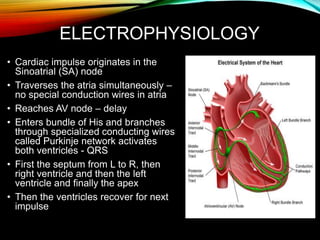
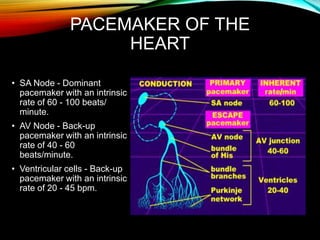
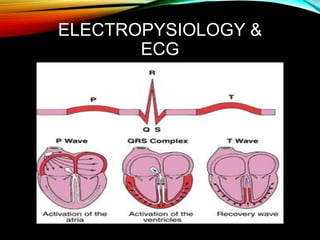
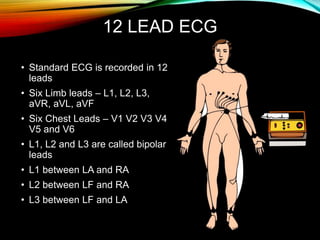
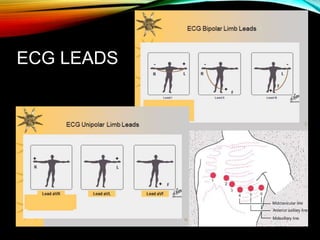
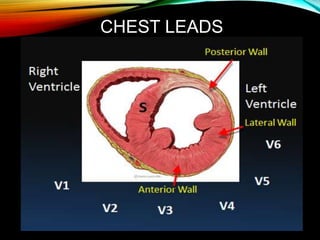
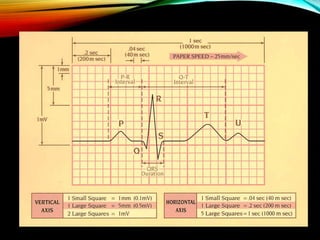
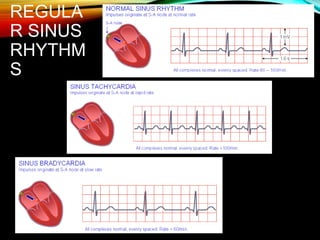
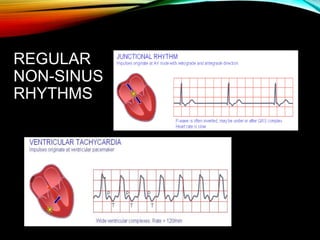
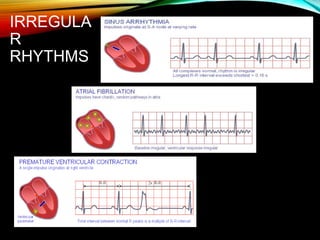
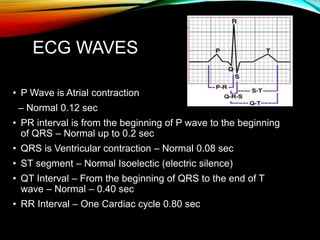
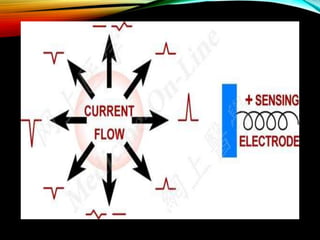
NORMAL ECG
Prepared by: Dr Yousef Biuk
DEFINITION
• Electrocardiography (ECG) is the process of recording the
electrical activity of the heart over a period of time using
electrodes placed on a patient’s body. These electrodes
detect the tiny electrical changes on the skin that arise from
the heart muscle depolarizing during each heartbeat.
ACTION POTENTIAL
VENTRICULAR MUSCLE
CELL ACTION
POTENTIAL
ELECTROPHYSIOLOGY
• Cardiac impulse originates in the
Sinoatrial (SA) node
• Traverses the atria simultaneously –
no special conduction wires in atria
• Reaches AV node – delay
• Enters bundle of His and branches
through specialized conducting wires
called Purkinje network activates
both ventricles - QRS
• First the septum from L to R, then
right ventricle and then the left
ventricle and finally the apex
• Then the ventricles recover for next
impulse
PACEMAKER OF THE
HEART
• SA Node - Dominant
pacemaker with an intrinsic
rate of 60 - 100 beats/
minute.
• AV Node - Back-up
pacemaker with an intrinsic
rate of 40 - 60
beats/minute.
• Ventricular cells - Back-up
pacemaker with an intrinsic
rate of 20 - 45 bpm.
ELECTROPYSIOLOGY &
ECG
12 LEAD ECG
• Standard ECG is recorded in 12
leads
• Six Limb leads – L1, L2, L3,
aVR, aVL, aVF
• Six Chest Leads – V1 V2 V3 V4
V5 and V6
• L1, L2 and L3 are called bipolar
leads
• L1 between LA and RA
• L2 between LF and RA
• L3 between LF and LA
ECG LEADS
CHEST LEADS
ECG PAPER
• X-Axis represents time - 1 mm = 0.04 sec
• Y-Axis represents voltage – 1 mm = 0.1 mV
• One big square on X-Axis = 0.2 sec (big box)
• Two big squares on Y-Axis = 1 milli volt (mV)
• Each small square is 0.04 sec (1 mm in size)
• Each big square on the ECG represents 5
small squares = 0.04 x 5 = 0.2 seconds
• 5 such big squares = 0.2 x 5 = 1sec = 25 mm
• One second is 25 mm or 5 big squares
• One minute is 5 x 60 = 300 big squares
ECG INTERPRETATION
• Rate: At usual speed (25mm/s) each ‘big square’ is 0.2s;
each ‘small square’ is 0.04s.
• To calculate the rate, divide 300 by the number of big
squares per R–R interval; or divide 1500 by the number of
small suares per R-R interval.
ECG INTERPRETATION
• Rhythm: If cycles are not clearly regular, use the ‘card
method’: lay a card along ECG, marking positions of 3
successive R waves. Slide the card to and fro to check that
all intervals are equal.
REGULA
R SINUS
RHYTHM
S
REGULAR
NON-SINUS
RHYTHMS
IRREGULA
R
RHYTHMS
ECG WAVES
• P Wave is Atrial contraction
– Normal 0.12 sec
• PR interval is from the beginning of P wave to the beginning
of QRS – Normal up to 0.2 sec
• QRS is Ventricular contraction – Normal 0.08 sec
• ST segment – Normal Isoelectic (electric silence)
• QT Interval – From the beginning of QRS to the end of T
wave – Normal – 0.40 sec
• RR Interval – One Cardiac cycle 0.80 sec
THE P-WAVE
• The normal P-wave:
• Has a smooth contour
• Is monophasic in lead II
• Is biphasic in lead V1
• upright in II, III, & aVF but inverted in aVR
• Has a duration 0f less than 0.12 sec or 3 small squares
• Height ˂ 2.5 small square
P-WAVE ABNORMALITIES
SEEN IN LEAD II
• In lead II two types of P-wave abnormalities can be seen.
• Right atrial enlargement is seen as a taller than normal P-
wave( increased amplitude) – P pulmonale
• Left atrial enlargement seen as a P-wave with a notch in it.
(Bifid P-wave) – P mitrale
OTHER P-WAVE
ABNORMALITIES
• Absent P wave: AF, sinoatrial block, junctional (AV nodal)
rhythm.
• Dissociation between P waves and QRS complexes
indicates complete heart block.
PR INTERVAL
• Measure from start of P wave to start of QRS
• Normal range: 0.12–0.2s (3–5 small squares)
• A prolonged PR interval implies delayed AV conduction (1st
degree heart block )
• A short PR interval implies unusually fast AV conduction
down an accessory pathway, eg WPW
HEART BLOCK
• 1st and 2nd degree (Mobitz I/II) heart block:
• 3rd degree AV (complete heart) block:
QRS COMPLEX
• normal duration: <0.12s. If ≥0.12s this suggests ventricular
conduction defects, eg: a bundle branch block
• Large QRS complexes suggest ventricular hypertrophy
• Normal Q wave <0.04s wide and <2mm deep (<25% R)
• Pathological Q waves may occur within a few hours of an
acute MI
BUNDLE BRANCH
BLOCK
LEFT VENTRICULAR
HYPERTROHPHY
RIGHT VENTRICULAR
HYPERTROPHY
ELECTRICAL AXIS
• The QRS electrical (vector) axis can have 4 directions
• Normal Axis - when it is downward and to the left –
southeast quadrant – from -30 to +90 degrees
• Right Axis – when it is downward and to the right –
southwest quadrant – from +90 to 180 degrees
• Left Axis – when it is upward and to the left – Northeast
quadrant –from -30 to -90 degrees
• Indeterminate Axis – when it is upward & to the right –
Northwest quadrant – from -90 to +180
CAUSES OF AXIS
DEVIATION
Causes of Left Axis Deviation:
• Left anterior hemiblock
• Inferior MI
• WPW syndrome
• LVH
Causes of Right Axis Deviation:
• RVH
• Pulmonary embolism
• Anterolateral MI
• Left posterior hemiblock
QT INTERVAL
• Measure from start of QRS to end of T wave
• It varies with rate
• Calculate corrected QT: QTc=QT/⏌RR =0.38–0.42s
• Prolonged QT interval: acute myocardial ischaemia,
myocarditis, bradycardia, U&E imbalance (Hypokalemia,
Hypocalcemia, Hypomagnesemia)
ST SEGMENT
• Usually isoelectric
• ST elevation (>1mm) usually implies infarction
• ST depression (>0.5mm) usually implies ischemia, NSTEMI
T-WAVE
• Normally inverted in aVR, V1 and occasionally V2
• Abnormal if inverted in I, II, and V4–V6
• Peaked in hyperkalaemia and flattened in hypokalaemia
NORMAL ECG
• Standardization – 10 mm (2 boxes) = 1 mV
• Sinus Rhythm – Each P followed by QRS, R-R constant
• P waves – always examine for in L2, V1, L1
• QRS positive in L1, L2, L3, aVF and aVL. – Neg in aVR
• QRS is < 0.12 narrow, Q in V5, V6 < 0.04, < 2 mm deep
• R wave progression from V1 to V6, QT interval < 0.4
• Axis normal – L1, L3, and aVF all will be positive
• ST Isoelectric, T waves ↑, Normal T↓ in aVR,V1, V2
NORMAL VARIATIONS
• May have slight left axis due to rotation of heart
• May have high voltage QRS – simulating LVH
• T inversions in V2, V3 and V4 – Juvenile T ↓
• Similarly in women also T↓
• Low voltages in obese women and men
• Non cardiac causes of ECG changes may occur
THANK YOU

Ecg 5th year 2016

  • 1.
  • 2.
    DEFINITION • Electrocardiography (ECG)is the process of recording the electrical activity of the heart over a period of time using electrodes placed on a patient’s body. These electrodes detect the tiny electrical changes on the skin that arise from the heart muscle depolarizing during each heartbeat.
  • 3.
  • 4.
  • 5.
    ELECTROPHYSIOLOGY • Cardiac impulseoriginates in the Sinoatrial (SA) node • Traverses the atria simultaneously – no special conduction wires in atria • Reaches AV node – delay • Enters bundle of His and branches through specialized conducting wires called Purkinje network activates both ventricles - QRS • First the septum from L to R, then right ventricle and then the left ventricle and finally the apex • Then the ventricles recover for next impulse
  • 6.
    PACEMAKER OF THE HEART •SA Node - Dominant pacemaker with an intrinsic rate of 60 - 100 beats/ minute. • AV Node - Back-up pacemaker with an intrinsic rate of 40 - 60 beats/minute. • Ventricular cells - Back-up pacemaker with an intrinsic rate of 20 - 45 bpm.
  • 7.
  • 8.
    12 LEAD ECG •Standard ECG is recorded in 12 leads • Six Limb leads – L1, L2, L3, aVR, aVL, aVF • Six Chest Leads – V1 V2 V3 V4 V5 and V6 • L1, L2 and L3 are called bipolar leads • L1 between LA and RA • L2 between LF and RA • L3 between LF and LA
  • 9.
  • 10.
  • 12.
    ECG PAPER • X-Axisrepresents time - 1 mm = 0.04 sec • Y-Axis represents voltage – 1 mm = 0.1 mV • One big square on X-Axis = 0.2 sec (big box) • Two big squares on Y-Axis = 1 milli volt (mV) • Each small square is 0.04 sec (1 mm in size) • Each big square on the ECG represents 5 small squares = 0.04 x 5 = 0.2 seconds • 5 such big squares = 0.2 x 5 = 1sec = 25 mm • One second is 25 mm or 5 big squares • One minute is 5 x 60 = 300 big squares
  • 14.
    ECG INTERPRETATION • Rate:At usual speed (25mm/s) each ‘big square’ is 0.2s; each ‘small square’ is 0.04s. • To calculate the rate, divide 300 by the number of big squares per R–R interval; or divide 1500 by the number of small suares per R-R interval.
  • 15.
    ECG INTERPRETATION • Rhythm:If cycles are not clearly regular, use the ‘card method’: lay a card along ECG, marking positions of 3 successive R waves. Slide the card to and fro to check that all intervals are equal.
  • 16.
  • 17.
  • 18.
  • 19.
    ECG WAVES • PWave is Atrial contraction – Normal 0.12 sec • PR interval is from the beginning of P wave to the beginning of QRS – Normal up to 0.2 sec • QRS is Ventricular contraction – Normal 0.08 sec • ST segment – Normal Isoelectic (electric silence) • QT Interval – From the beginning of QRS to the end of T wave – Normal – 0.40 sec • RR Interval – One Cardiac cycle 0.80 sec
  • 20.
    THE P-WAVE • Thenormal P-wave: • Has a smooth contour • Is monophasic in lead II • Is biphasic in lead V1 • upright in II, III, & aVF but inverted in aVR • Has a duration 0f less than 0.12 sec or 3 small squares • Height ˂ 2.5 small square
  • 21.
    P-WAVE ABNORMALITIES SEEN INLEAD II • In lead II two types of P-wave abnormalities can be seen. • Right atrial enlargement is seen as a taller than normal P- wave( increased amplitude) – P pulmonale • Left atrial enlargement seen as a P-wave with a notch in it. (Bifid P-wave) – P mitrale
  • 22.
    OTHER P-WAVE ABNORMALITIES • AbsentP wave: AF, sinoatrial block, junctional (AV nodal) rhythm. • Dissociation between P waves and QRS complexes indicates complete heart block.
  • 23.
    PR INTERVAL • Measurefrom start of P wave to start of QRS • Normal range: 0.12–0.2s (3–5 small squares) • A prolonged PR interval implies delayed AV conduction (1st degree heart block ) • A short PR interval implies unusually fast AV conduction down an accessory pathway, eg WPW
  • 24.
    HEART BLOCK • 1stand 2nd degree (Mobitz I/II) heart block: • 3rd degree AV (complete heart) block:
  • 25.
    QRS COMPLEX • normalduration: <0.12s. If ≥0.12s this suggests ventricular conduction defects, eg: a bundle branch block • Large QRS complexes suggest ventricular hypertrophy • Normal Q wave <0.04s wide and <2mm deep (<25% R) • Pathological Q waves may occur within a few hours of an acute MI
  • 26.
  • 27.
  • 28.
  • 29.
    ELECTRICAL AXIS • TheQRS electrical (vector) axis can have 4 directions • Normal Axis - when it is downward and to the left – southeast quadrant – from -30 to +90 degrees • Right Axis – when it is downward and to the right – southwest quadrant – from +90 to 180 degrees • Left Axis – when it is upward and to the left – Northeast quadrant –from -30 to -90 degrees • Indeterminate Axis – when it is upward & to the right – Northwest quadrant – from -90 to +180
  • 32.
    CAUSES OF AXIS DEVIATION Causesof Left Axis Deviation: • Left anterior hemiblock • Inferior MI • WPW syndrome • LVH Causes of Right Axis Deviation: • RVH • Pulmonary embolism • Anterolateral MI • Left posterior hemiblock
  • 33.
    QT INTERVAL • Measurefrom start of QRS to end of T wave • It varies with rate • Calculate corrected QT: QTc=QT/⏌RR =0.38–0.42s • Prolonged QT interval: acute myocardial ischaemia, myocarditis, bradycardia, U&E imbalance (Hypokalemia, Hypocalcemia, Hypomagnesemia)
  • 34.
    ST SEGMENT • Usuallyisoelectric • ST elevation (>1mm) usually implies infarction • ST depression (>0.5mm) usually implies ischemia, NSTEMI
  • 36.
    T-WAVE • Normally invertedin aVR, V1 and occasionally V2 • Abnormal if inverted in I, II, and V4–V6 • Peaked in hyperkalaemia and flattened in hypokalaemia
  • 37.
    NORMAL ECG • Standardization– 10 mm (2 boxes) = 1 mV • Sinus Rhythm – Each P followed by QRS, R-R constant • P waves – always examine for in L2, V1, L1 • QRS positive in L1, L2, L3, aVF and aVL. – Neg in aVR • QRS is < 0.12 narrow, Q in V5, V6 < 0.04, < 2 mm deep • R wave progression from V1 to V6, QT interval < 0.4 • Axis normal – L1, L3, and aVF all will be positive • ST Isoelectric, T waves ↑, Normal T↓ in aVR,V1, V2
  • 38.
    NORMAL VARIATIONS • Mayhave slight left axis due to rotation of heart • May have high voltage QRS – simulating LVH • T inversions in V2, V3 and V4 – Juvenile T ↓ • Similarly in women also T↓ • Low voltages in obese women and men • Non cardiac causes of ECG changes may occur
  • 39.