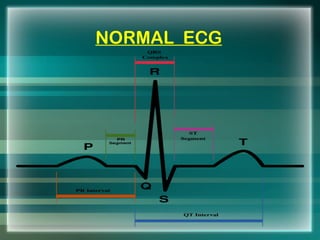
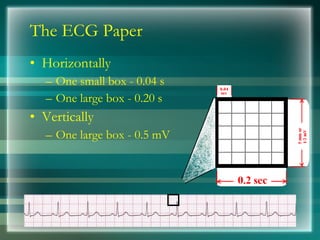
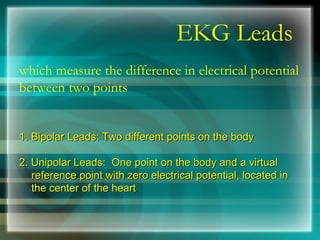
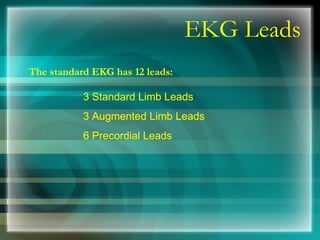
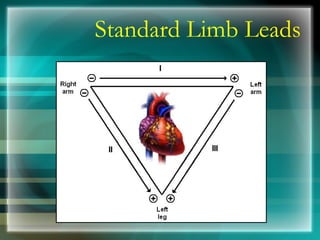
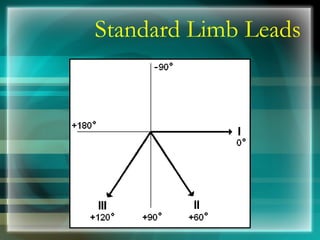
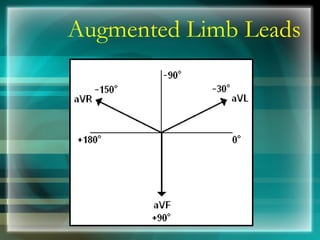
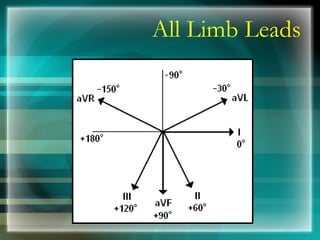
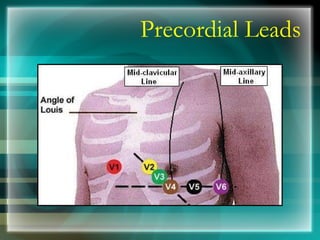
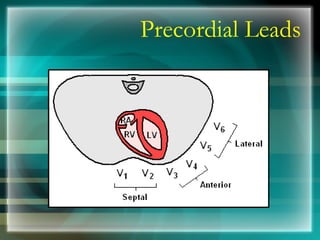
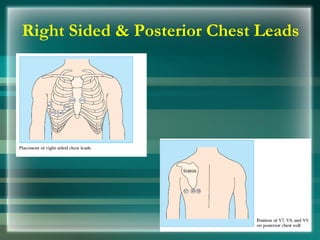
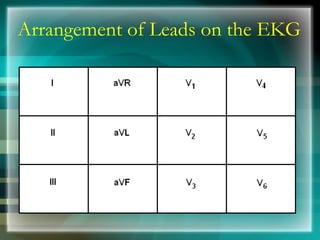
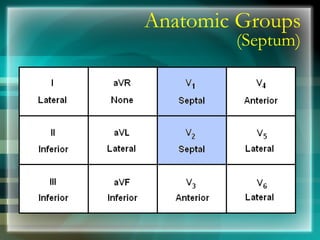
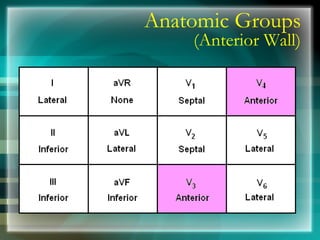
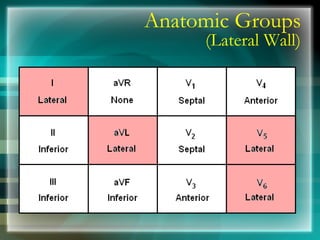
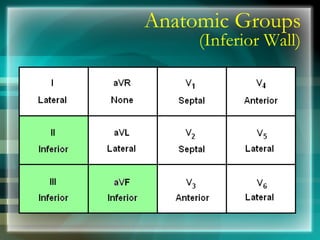
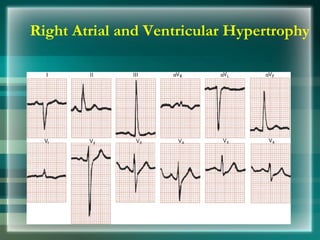
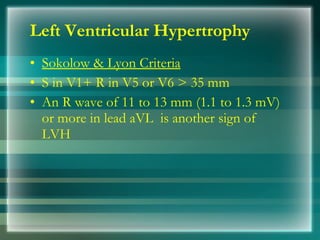
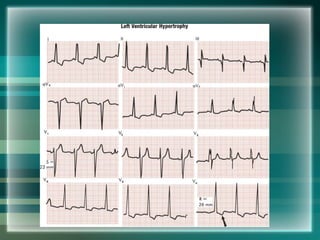
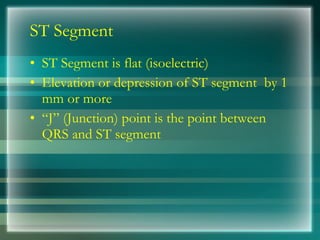
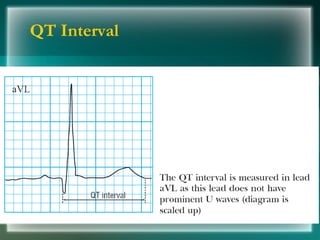
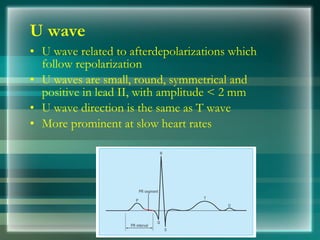
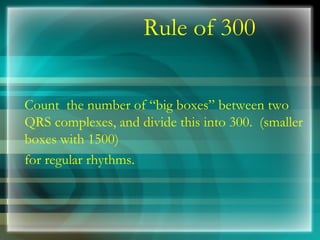
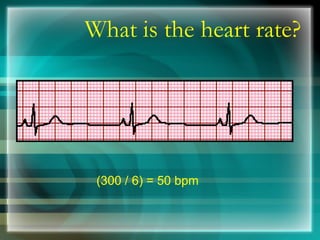
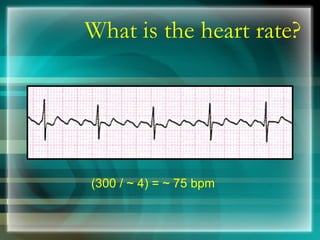
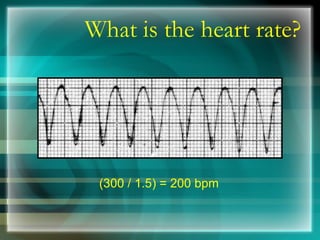
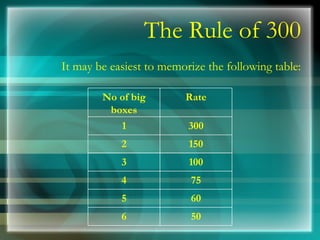
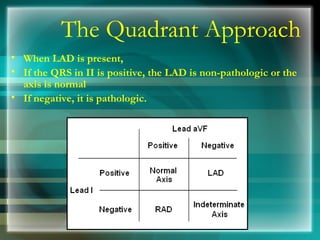
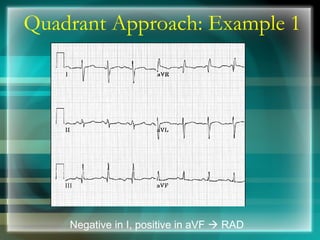
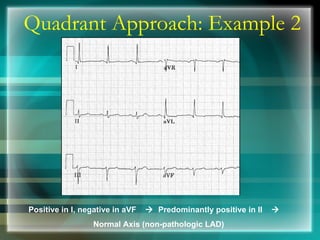
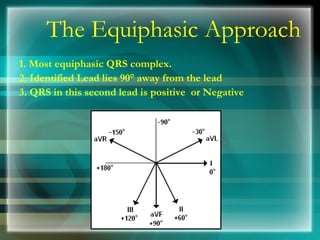
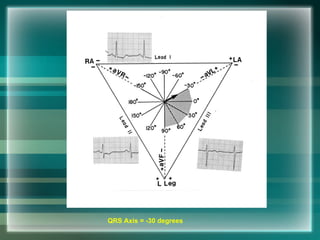
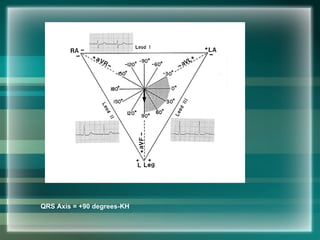
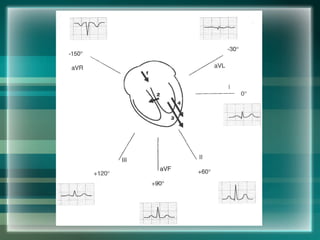
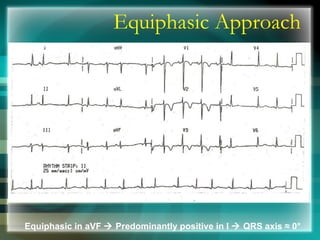
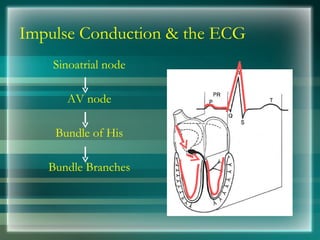
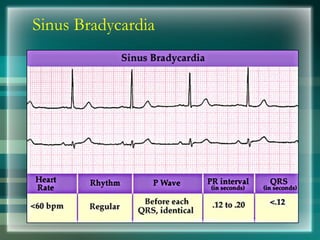
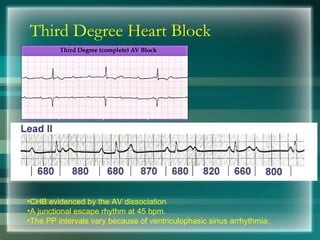
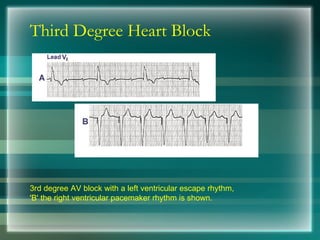
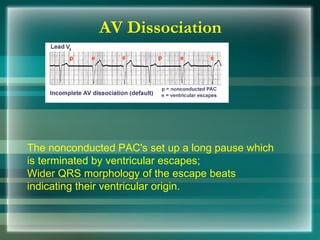
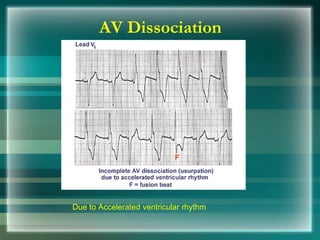
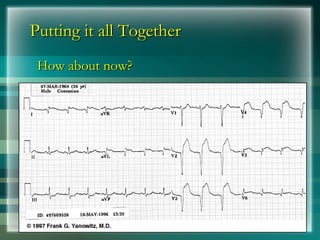
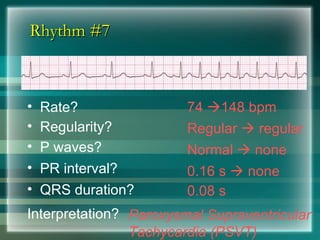
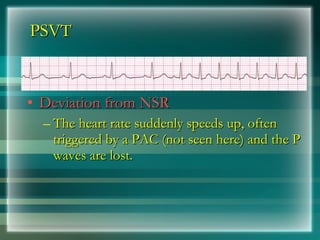
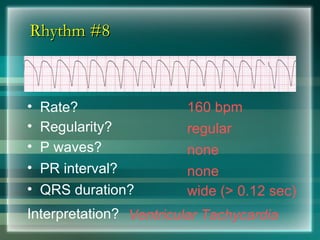
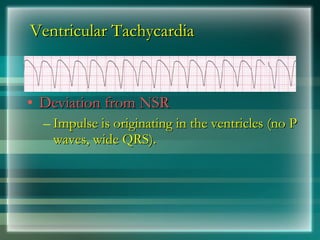
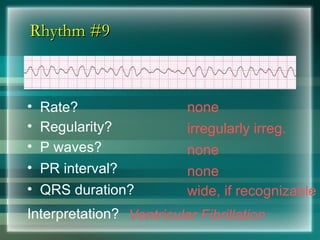
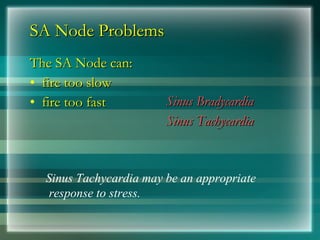
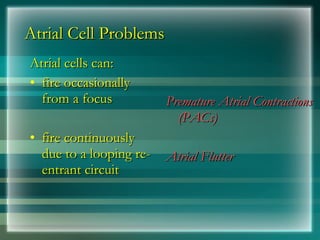
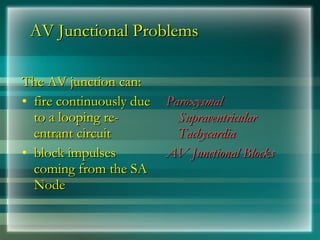
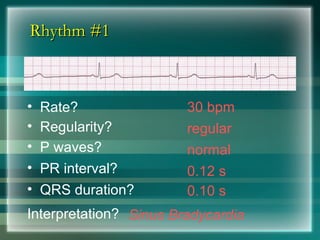
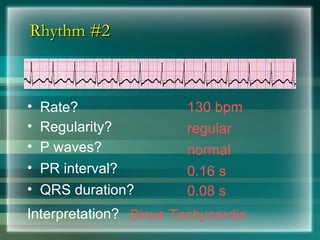
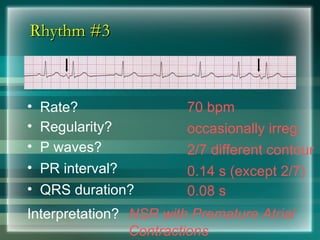
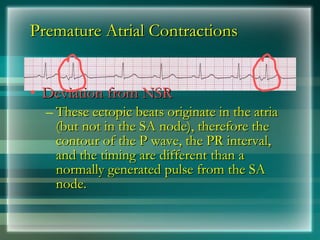
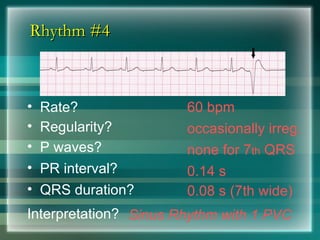
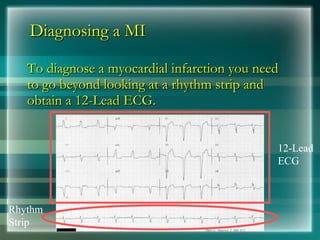
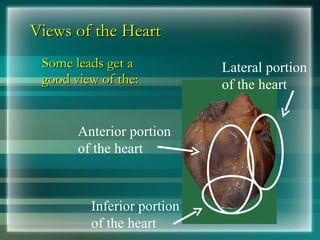
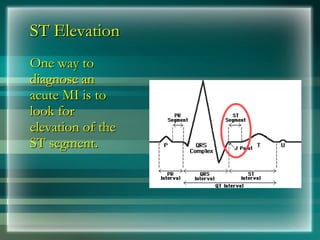
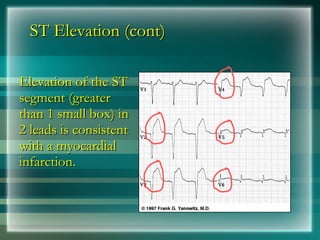
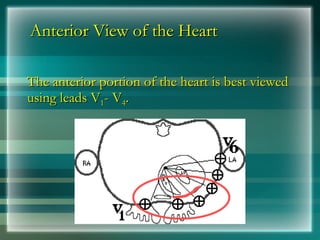
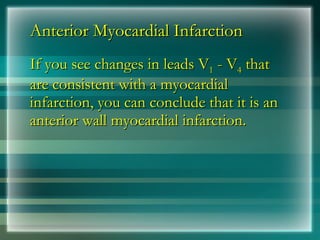
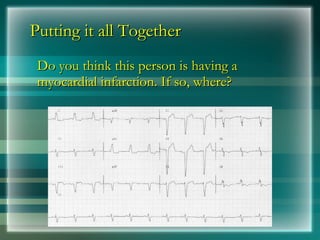
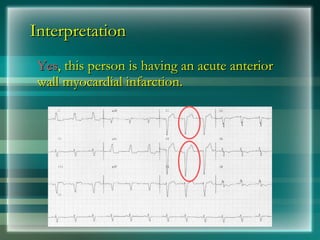
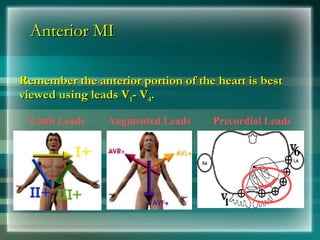
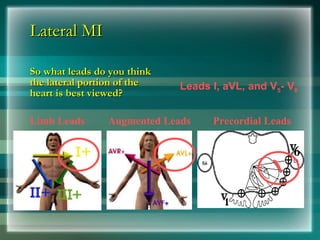
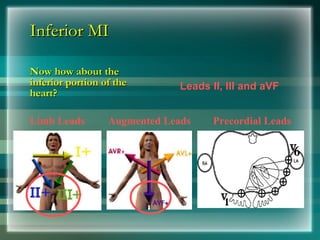
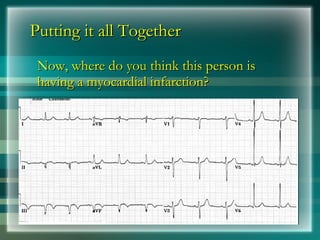
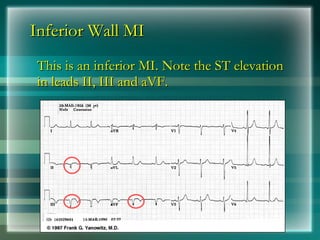
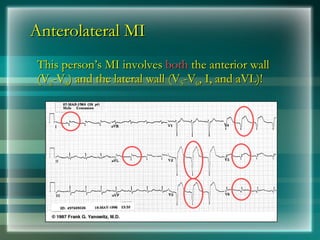
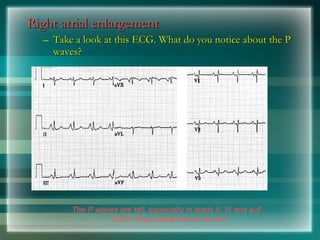
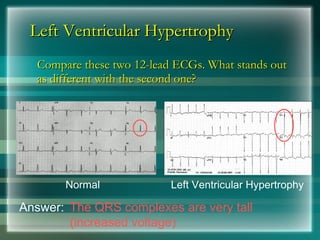
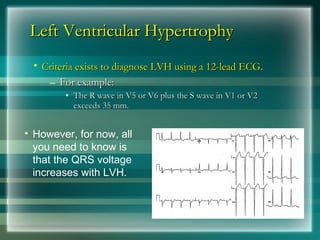
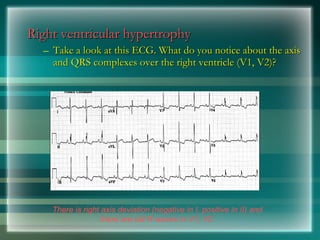
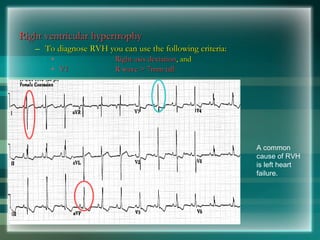
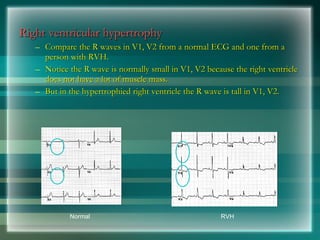
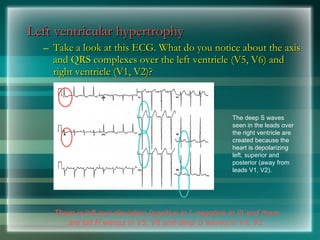
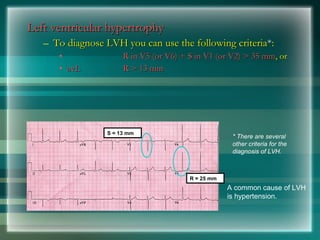
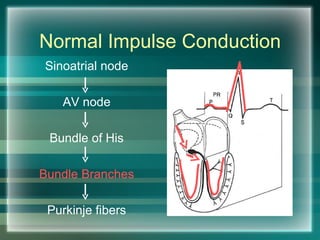
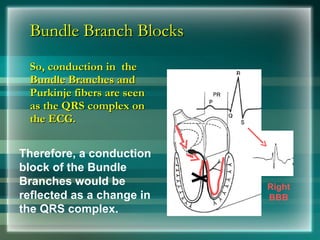
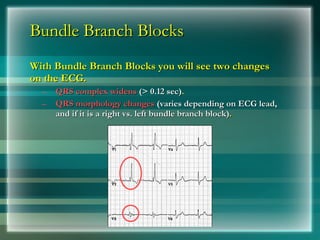
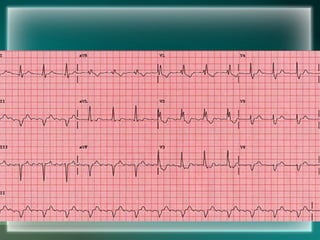
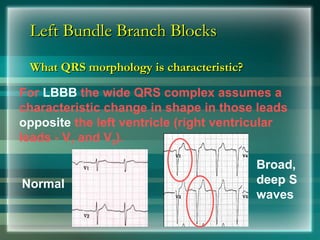
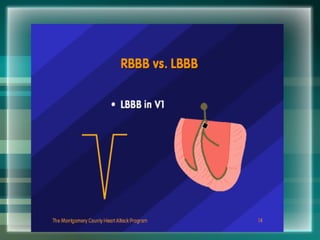
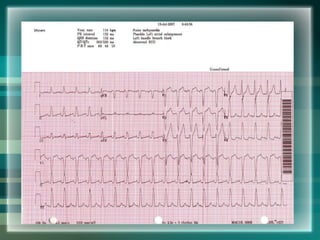
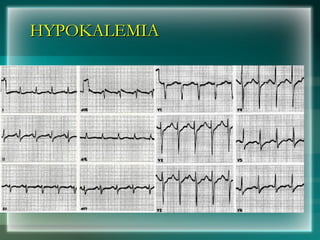
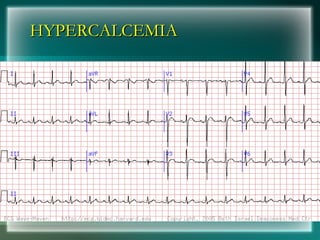
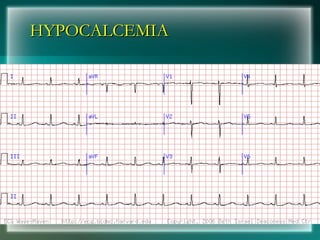
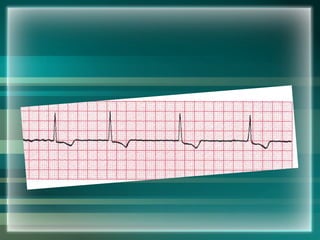
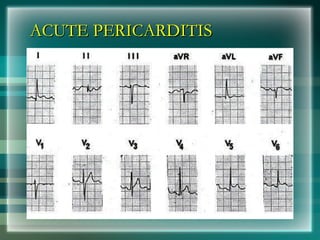
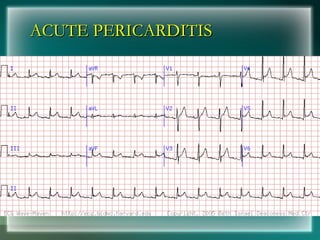
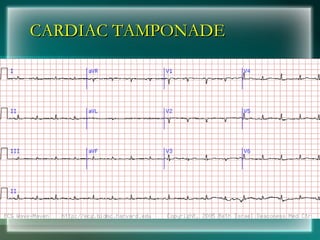
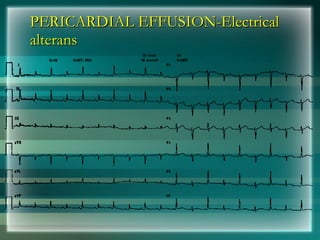
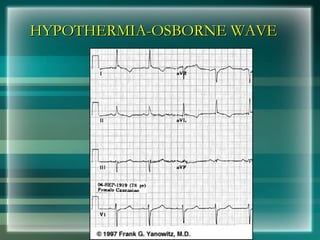
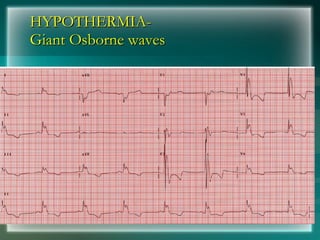
Basics of ECG
http://emergencymedic.blogspot.com
Dr Subroto Mandal, MD, DM, DC
Associate Professor, Cardiology
HISTORY
• 1842- Italian scientist Carlo Matteucci realizes that
electricity is associated with the heart beat
• 1876- Irish scientist Marey analyzes the electric
pattern of frog’s heart
• 1895 - William Einthoven , credited for the
invention of EKG
• 1906 - using the string electrometer EKG,
William Einthoven diagnoses some heart problems
CONTD…
• 1924 - the noble prize for physiology or
medicine is given to William Einthoven for his
work on EKG
• 1938 -AHA and Cardiac society of great Britan
defined and position of chest leads
• 1942- Goldberger increased Wilson’s Unipolar
lead voltage by 50% and made Augmented leads
• 2005- successful reduction in time of onset of
chest pain and PTCA by wireless transmission of
ECG on his PDA.
MODERN ECG INSTRUMENT
What is an EKG?
•The electrocardiogram (EKG) is a representation
of the electrical events of the cardiac cycle.
•Each event has a distinctive waveform
•the study of waveform can lead to greater insight
into a patient’s cardiac pathophysiology.
With EKGs we can identify
Arrhythmias
Myocardial ischemia and infarction
Pericarditis
Chamber hypertrophy
Electrolyte disturbances (i.e. hyperkalemia,
hypokalemia)
Drug toxicity (i.e. digoxin and drugs which
prolong the QT interval)
Depolarization
• Contraction of any muscle is associated with
electrical changes called depolarization
• These changes can be detected by electrodes
attached to the surface of the body
Pacemakers of the Heart
• SA Node - Dominant pacemaker with an
intrinsic rate of 60 - 100 beats/minute.
• AV Node - Back-up pacemaker with an
intrinsic rate of 40 - 60 beats/minute.
• Ventricular cells - Back-up pacemaker with
an intrinsic rate of 20 - 45 bpm.
• Standard calibration
– 25 mm/s
– 0.1 mV/mm
• Electrical impulse that
travels towards the
electrode produces an
upright (“positive”)
deflection
Impulse Conduction & the ECG
Sinoatrial node
AV node
Bundle of His
Bundle Branches
Purkinje fibers
The “PQRST”
• P wave - Atrial
depolarization
• T wave - Ventricular
repolarization
• QRS - Ventricular
depolarization
The PR Interval
Atrial depolarization
+
delay in AV junction
(AV node/Bundle of His)
(delay allows time for
the atria to contract
before the ventricles
contract)
NORMAL ECG
The ECG Paper
• Horizontally
– One small box - 0.04 s
– One large box - 0.20 s
• Vertically
– One large box - 0.5 mV
EKG Leads
which measure the difference in electrical potential
between two points
1. Bipolar Leads: Two different points on the body
2. Unipolar Leads: One point on the body and a virtual
reference point with zero electrical potential, located in
the center of the heart
EKG Leads
The standard EKG has 12 leads:
3 Standard Limb Leads
3 Augmented Limb Leads
6 Precordial Leads
Standard Limb Leads
Standard Limb Leads
Augmented Limb Leads
All Limb Leads
Precordial Leads
Precordial Leads
Right Sided & Posterior Chest Leads
Arrangement of Leads on the EKG
Anatomic Groups
(Septum)
Anatomic Groups
(Anterior Wall)
Anatomic Groups
(Lateral Wall)
Anatomic Groups
(Inferior Wall)
Anatomic Groups
(Summary)
ECG RULES
• Professor Chamberlains 10 rules of normal:-
RULE 1
PR interval should be 120 to 200
milliseconds or 3 to 5 little squares
RULE 2
The width of the QRS complex should not
exceed 110 ms, less than 3 little squares
RULE 3
The QRS complex should be dominantly upright in
leads I and II
RULE 4
QRS and T waves tend to have the same
general direction in the limb leads
RULE 5
All waves are negative in lead aVR
RULE 6
The R wave must grow from V1 to at least V4
The S wave must grow from V1 to at least V3
and disappear in V6
RULE 7
The ST segment should start isoelectric
except in V1 and V2 where it may be elevated
RULE 8
The P waves should be upright in I, II, and V2 to V6
RULE 9
There should be no Q wave or only a small q less
than 0.04 seconds in width in I, II, V2 to V6
RULE 10
The T wave must be upright in I, II, V2 to V6
P wave
• Always positive in lead I and II
• Always negative in lead aVR
• < 3 small squares in duration
• < 2.5 small squares in amplitude
• Commonly biphasic in lead V1
• Best seen in leads II
Right Atrial Enlargement
• Tall (> 2.5 mm), pointed P waves (P Pulmonale)
• Notched/bifid (‘M’ shaped) P wave (P
‘mitrale’) in limb leads
Left Atrial Enlargement
P Pulmonale
P Mitrale
Short PR Interval
• WPW (Wolff-
Parkinson-White)
Syndrome
• Accessory pathway
(Bundle of Kent)
allows early activation
of the ventricle (delta
wave and short PR
interval)
Long PR Interval
• First degree Heart Block
QRS Complexes
• Non­pathological Q waves may present in I, III, aVL,
V5, and V6
• R wave in lead V6 is smaller than V5
• Depth of the S wave, should not exceed 30 mm
• Pathological Q wave > 2mm deep and > 1mm wide or
> 25% amplitude of the subsequent R wave
QRS in LVH & RVH
Conditions with Tall R in V1
Right Atrial and Ventricular Hypertrophy
Left Ventricular Hypertrophy
• Sokolow & Lyon Criteria
• S in V1+ R in V5 or V6 > 35 mm
• An R wave of 11 to 13 mm (1.1 to 1.3 mV)
or more in lead aVL is another sign of
LVH
ST Segment
• ST Segment is flat (isoelectric)
• Elevation or depression of ST segment by 1
mm or more
• “J” (Junction) point is the point between
QRS and ST segment
Variable Shapes Of ST Segment
Elevations in AMI
Goldberger AL. Goldberger: Clinical Electrocardiography: A Simplified Approach. 7th
ed: Mosby Elsevier; 2006.
T wave
• Normal T wave is asymmetrical, first half having a
gradual slope than the second
• Should be at least 1/8 but less than 2/3 of the
amplitude of the R
• T wave amplitude rarely exceeds 10 mm
• Abnormal T waves are symmetrical, tall, peaked,
biphasic or inverted.
• T wave follows the direction of the QRS deflection.
T wave
QT interval
1. Total duration of Depolarization and
Repolarization
2. QT interval decreases when heart rate increases
3. For HR = 70 bpm, QT<0.40 sec.
4. QT interval should be 0.35­ 0.45 s,
5. Should not be more than half of the interval
between adjacent R waves (R­R interval).
QT Interval
U wave
• U wave related to afterdepolarizations which
follow repolarization
• U waves are small, round, symmetrical and
positive in lead II, with amplitude < 2 mm
• U wave direction is the same as T wave
• More prominent at slow heart rates
Determining the Heart Rate
Rule of 300/1500
10 Second Rule
Rule of 300
Count the number of “big boxes” between two
QRS complexes, and divide this into 300. (smaller
boxes with 1500)
for regular rhythms.
What is the heart rate?
(300 / 6) = 50 bpm
What is the heart rate?
(300 / ~ 4) = ~ 75 bpm
What is the heart rate?
(300 / 1.5) = 200 bpm
The Rule of 300
It may be easiest to memorize the following table:
50
6
60
5
75
4
100
3
150
2
300
1
Rate
No of big
boxes
10 Second Rule
EKGs record 10 seconds of rhythm per page,
Count the number of beats present on the EKG
Multiply by 6
For irregular rhythms.
What is the heart rate?
33 x 6 = 198 bpm
Calculation of Heart Rate
Question
• Calculate the heart rate
The QRS Axis
The QRS axis represents overall direction of the
heart’s electrical activity.
Abnormalities hint at:
Ventricular enlargement
Conduction blocks (i.e. hemiblocks)
The QRS Axis
Normal QRS axis from -30° to
+90°.
-30° to -90° is referred to as a
left axis deviation (LAD)
+90° to +180° is referred to as
a right axis deviation (RAD)
Determining the Axis
The Quadrant Approach
The Equiphasic Approach
Determining the Axis
Predominantly
Positive
Predominantly
Negative
Equiphasic
The Quadrant Approach
1. QRS complex in leads I and aVF
2. determine if they are predominantly positive or negative.
3. The combination should place the axis into one of the 4
quadrants below.
The Quadrant Approach
• When LAD is present,
• If the QRS in II is positive, the LAD is non-pathologic or the
axis is normal
• If negative, it is pathologic.
Quadrant Approach: Example 1
Negative in I, positive in aVF  RAD
Quadrant Approach: Example 2
Positive in I, negative in aVF  Predominantly positive in II 
Normal Axis (non-pathologic LAD)
The Equiphasic Approach
1. Most equiphasic QRS complex.
2. Identified Lead lies 90° away from the lead
3. QRS in this second lead is positive or Negative
QRS Axis = -30 degrees
QRS Axis = +90 degrees-KH
Equiphasic Approach
Equiphasic in aVF  Predominantly positive in I  QRS axis ≈ 0°
Thank You
BRADYARRYTHMIA
Dr Subroto Mandal, MD, DM, DC
Associate Professor, Cardiology
Classification
• Sinus Bradycardia
• Junctional Rhythm
• Sino Atrial Block
• Atrioventricular block
Impulse Conduction & the ECG
Sinoatrial node
AV node
Bundle of His
Bundle Branches
Sinus Bradycardia
Junctional Rhythm
SA Block
• Sinus impulses is blocked within the SA junction
• Between SA node and surrounding myocardium
• Abscent of complete Cardiac cycle
• Occures irregularly and unpredictably
• Present :Young athletes, Digitalis, Hypokalemia, Sick
Sinus Syndrome
AV Block
• First Degree AV Block
• Second Degree AV Block
• Third Degree AV Block
First Degree AV Block
• Delay in the conduction through the conducting system
• Prolong P-R interval
• All P waves are followed by QRS
• Associated with : AC Rheumati Carditis, Digitalis, Beta
Blocker, excessive vagal tone, ischemia, intrinsic disease in
the AV junction or bundle branch system.
Second Degree AV Block
• Intermittent failure of AV conduction
• Impulse blocked by AV node
• Types:
• Mobitz type 1 (Wenckebach Phenomenon)
• Mobitz type 2
The 3 rules of "classic AV Wenckebach"
2. Decreasing RR intervals until pause;
2. Pause is less than preceding 2 RR intervals
3. RR interval after the pause is greater than RR prior to
pause.
Mobitz type 1 (Wenckebach Phenomenon)
•Mobitz type 2
•Usually a sign of bilateral bundle branch disease.
•One of the branches should be completely blocked;
•most likely blocked in the right bundle
•P waves may blocked somewhere in the AV junction, the
His bundle.
Third Degree Heart Block
•CHB evidenced by the AV dissociation
•A junctional escape rhythm at 45 bpm.
•The PP intervals vary because of ventriculophasic sinus arrhythmia;
Third Degree Heart Block
3rd degree AV block with a left ventricular escape rhythm,
'B' the right ventricular pacemaker rhythm is shown.
The nonconducted PAC's set up a long pause which
is terminated by ventricular escapes;
Wider QRS morphology of the escape beats
indicating their ventricular origin.
AV Dissociation
AV Dissociation
Due to Accelerated ventricular rhythm
Thank You
Putting it all Together
Do you think this person is having a
myocardial infarction. If so, where?
Interpretation
Interpretation
Yes
Yes, this person is having an acute anterior
, this person is having an acute anterior
wall myocardial infarction.
Putting it all Together
Now, where do you think this person is
having a myocardial infarction?
Inferior Wall MI
Inferior Wall MI
This is an inferior MI. Note the ST elevation
in leads II, III and aVF.
Putting it all Together
How about now?
How about now?
Anterolateral MI
Anterolateral MI
This person’s MI involves
This person’s MI involves both
both the anterior wall
the anterior wall
(V
(V2
2-V
-V4
4) and the lateral wall (V
) and the lateral wall (V5
5-V
-V6
6, I, and aVL)!
, I, and aVL)!
Rhythm #6
Rhythm #6
70 bpm
• Rate?
• Regularity? regular
flutter waves
0.06 s
• P waves?
• PR interval? none
• QRS duration?
Interpretation? Atrial Flutter
Rhythm #7
Rhythm #7
74 148 bpm
• Rate?
• Regularity? Regular  regular
Normal  none
0.08 s
• P waves?
• PR interval? 0.16 s  none
• QRS duration?
Interpretation? Paroxysmal Supraventricular
Tachycardia (PSVT)
PSVT
PSVT
• Deviation from NSR
Deviation from NSR
– The heart rate suddenly speeds up, often
The heart rate suddenly speeds up, often
triggered by a PAC (not seen here) and the P
waves are lost.
waves are lost.
Ventricular Arrhythmias
• Ventricular Tachycardia
Ventricular Tachycardia
• Ventricular Fibrillation
Ventricular Fibrillation
Rhythm #8
Rhythm #8
160 bpm
• Rate?
• Regularity? regular
none
wide (> 0.12 sec)
• P waves?
• PR interval? none
• QRS duration?
Interpretation? Ventricular Tachycardia
Ventricular Tachycardia
• Deviation from NSR
Deviation from NSR
– Impulse is originating in the ventricles (no P
Impulse is originating in the ventricles (no P
waves, wide QRS).
waves, wide QRS).
Rhythm #9
Rhythm #9
none
• Rate?
• Regularity? irregularly irreg.
none
wide, if recognizable
• P waves?
• PR interval? none
• QRS duration?
Interpretation? Ventricular Fibrillation
Ventricular Fibrillation
• Deviation from NSR
Deviation from NSR
– Completely abnormal.
Completely abnormal.
Arrhythmia Formation
Arrhythmias can arise from problems in the:
• Sinus node
Sinus node
• Atrial cells
Atrial cells
• AV junction
AV junction
• Ventricular cells
Ventricular cells
SA Node Problems
SA Node Problems
The SA Node can:
The SA Node can:
• fire too slow
fire too slow
• fire too fast
fire too fast Sinus Bradycardia
Sinus Bradycardia
Sinus Tachycardia
Sinus Tachycardia
Sinus Tachycardia may be an appropriate
response to stress.
Atrial Cell Problems
Atrial cells can:
Atrial cells can:
• fire occasionally
fire occasionally
from a focus
from a focus
• fire continuously
fire continuously
due to a looping re-
entrant circuit
entrant circuit
Premature Atrial Contractions
(PACs)
(PACs)
Atrial Flutter
Atrial Flutter
AV Junctional Problems
The AV junction can:
• fire continuously due
fire continuously due
to a looping re-
to a looping re-
entrant circuit
entrant circuit
• block impulses
block impulses
coming from the SA
coming from the SA
Node
Node
Paroxysmal
Paroxysmal
Supraventricular
Supraventricular
Tachycardia
Tachycardia
AV Junctional Blocks
Rhythm #1
Rhythm #1
30 bpm
• Rate?
• Regularity? regular
normal
0.10 s
• P waves?
• PR interval? 0.12 s
• QRS duration?
Interpretation? Sinus Bradycardia
Rhythm #2
Rhythm #2
130 bpm
• Rate?
• Regularity? regular
normal
0.08 s
• P waves?
• PR interval? 0.16 s
• QRS duration?
Interpretation? Sinus Tachycardia
Rhythm #3
Rhythm #3
70 bpm
• Rate?
• Regularity? occasionally irreg.
2/7 different contour
0.08 s
• P waves?
• PR interval? 0.14 s (except 2/7)
• QRS duration?
Interpretation? NSR with Premature Atrial
Contractions
Premature Atrial Contractions
• Deviation from NSR
Deviation from NSR
– These ectopic beats originate in the atria
These ectopic beats originate in the atria
(but not in the SA node), therefore the
contour of the P wave, the PR interval,
and the timing are different than a
normally generated pulse from the SA
node.
node.
Rhythm #4
Rhythm #4
60 bpm
• Rate?
• Regularity? occasionally irreg.
none for 7th QRS
0.08 s (7th wide)
• P waves?
• PR interval? 0.14 s
• QRS duration?
Interpretation? Sinus Rhythm with 1 PVC
Ventricular Conduction
Normal
Signal moves rapidly
through the ventricles
Abnormal
Signal moves slowly
through the ventricles
AV Nodal Blocks
AV Nodal Blocks
• 1st Degree AV Block
1st Degree AV Block
• 2nd Degree AV Block, Type I
2nd Degree AV Block, Type I
• 2nd Degree AV Block, Type II
2nd Degree AV Block, Type II
• 3rd Degree AV Block
3rd Degree AV Block
Rhythm #10
Rhythm #10
60 bpm
• Rate?
• Regularity? regular
normal
0.08 s
• P waves?
• PR interval? 0.36 s
• QRS duration?
Interpretation? 1st Degree AV Block
1st Degree AV Block
1st Degree AV Block
• Etiology:
Etiology: Prolonged conduction delay in the AV
Prolonged conduction delay in the AV
node or Bundle of His.
Rhythm #11
Rhythm #11
50 bpm
• Rate?
• Regularity? regularly irregular
nl, but 4th no QRS
0.08 s
• P waves?
• PR interval? lengthens
• QRS duration?
Interpretation? 2nd Degree AV Block, Type I
Rhythm #12
Rhythm #12
40 bpm
• Rate?
• Regularity? regular
nl, 2 of 3 no QRS
0.08 s
• P waves?
• PR interval? 0.14 s
• QRS duration?
Interpretation? 2nd Degree AV Block, Type II
2nd Degree AV Block, Type II
• Deviation from NSR
Deviation from NSR
– Occasional P waves are completely blocked
Occasional P waves are completely blocked
(P wave not followed by QRS).
Rhythm #13
Rhythm #13
40 bpm
• Rate?
• Regularity? regular
no relation to QRS
wide (> 0.12 s)
• P waves?
• PR interval? none
• QRS duration?
Interpretation? 3rd Degree AV Block
3rd Degree AV Block
3rd Degree AV Block
• Deviation from NSR
Deviation from NSR
– The P waves are completely blocked in the
The P waves are completely blocked in the
AV junction; QRS complexes originate
independently from below the junction.
Supraventricular Arrhythmias
• Atrial Fibrillation
Atrial Fibrillation
• Atrial Flutter
Atrial Flutter
• Paroxysmal Supraventricular Tachycardia
Paroxysmal Supraventricular Tachycardia
Rhythm #5
Rhythm #5
100 bpm
• Rate?
• Regularity? irregularly irregular
none
0.06 s
• P waves?
• PR interval? none
• QRS duration?
Interpretation? Atrial Fibrillation
Atrial Fibrillation
Atrial Fibrillation
• Deviation from NSR
Deviation from NSR
– No organized atrial depolarization, so no
No organized atrial depolarization, so no
normal P waves (impulses are not originating
from the sinus node).
– Atrial activity is chaotic (resulting in an
Atrial activity is chaotic (resulting in an
irregularly irregular rate).
– Common, affects 2-4%, up to 5-10% if > 80
Common, affects 2-4%, up to 5-10% if > 80
years old
years old
Rhythm #6
Rhythm #6
70 bpm
• Rate?
• Regularity? regular
flutter waves
0.06 s
• P waves?
• PR interval? none
• QRS duration?
Interpretation? Atrial Flutter
Rhythm #7
Rhythm #7
74 148 bpm
• Rate?
• Regularity? Regular  regular
Normal  none
0.08 s
• P waves?
• PR interval? 0.16 s  none
• QRS duration?
Interpretation? Paroxysmal Supraventricular
Tachycardia (PSVT)
PSVT
PSVT
• Deviation from NSR
Deviation from NSR
– The heart rate suddenly speeds up, often
The heart rate suddenly speeds up, often
triggered by a PAC (not seen here) and the P
waves are lost.
waves are lost.
Ventricular Arrhythmias
• Ventricular Tachycardia
Ventricular Tachycardia
• Ventricular Fibrillation
Ventricular Fibrillation
Rhythm #8
Rhythm #8
160 bpm
• Rate?
• Regularity? regular
none
wide (> 0.12 sec)
• P waves?
• PR interval? none
• QRS duration?
Interpretation? Ventricular Tachycardia
Ventricular Tachycardia
• Deviation from NSR
Deviation from NSR
– Impulse is originating in the ventricles (no P
Impulse is originating in the ventricles (no P
waves, wide QRS).
waves, wide QRS).
Rhythm #9
Rhythm #9
none
• Rate?
• Regularity? irregularly irreg.
none
wide, if recognizable
• P waves?
• PR interval? none
• QRS duration?
Interpretation? Ventricular Fibrillation
Ventricular Fibrillation
• Deviation from NSR
Deviation from NSR
– Completely abnormal.
Completely abnormal.
Diagnosing a MI
Diagnosing a MI
To diagnose a myocardial infarction you need
to go beyond looking at a rhythm strip and
obtain a 12-Lead ECG.
Rhythm
Strip
12-Lead
ECG
Views of the Heart
Views of the Heart
Some leads get a
Some leads get a
good view of the:
good view of the:
Anterior portion
of the heart
Lateral portion
of the heart
Inferior portion
of the heart
ST Elevation
ST Elevation
One way to
One way to
diagnose an
diagnose an
acute MI is to
acute MI is to
look for
look for
elevation of the
elevation of the
ST segment.
ST segment.
ST Elevation (cont)
ST Elevation (cont)
Elevation of the ST
Elevation of the ST
segment (greater
segment (greater
than 1 small box) in
2 leads is consistent
with a myocardial
with a myocardial
infarction.
infarction.
Anterior View of the Heart
The anterior portion of the heart is best viewed
using leads V
using leads V1
1- V
- V4
4.
.
Anterior Myocardial Infarction
If you see changes in leads V
If you see changes in leads V1
1 - V
- V4
4 that
that
are consistent with a myocardial
infarction, you can conclude that it is an
anterior wall myocardial infarction.
Putting it all Together
Do you think this person is having a
myocardial infarction. If so, where?
Interpretation
Interpretation
Yes
Yes, this person is having an acute anterior
, this person is having an acute anterior
wall myocardial infarction.
Other MI Locations
Other MI Locations
Now that you know where to look for an
anterior wall myocardial infarction let’s look at
how you would determine if the MI involves
the lateral wall or the inferior wall of the heart.
Other MI Locations
Other MI Locations
First, take a look
First, take a look
again at this picture
of the heart.
of the heart.
Anterior portion
of the heart
Lateral portion
of the heart
Inferior portion
of the heart
Other MI Locations
Other MI Locations
Second, remember that the 12-leads of the ECG look at different
portions of the heart. The limb and augmented leads “see” electrical
activity moving inferiorly (II, III and aVF), to the left (I, aVL) and to
the right (aVR). Whereas, the precordial leads “see” electrical
activity in the posterior to anterior direction.
Limb Leads Augmented Leads Precordial Leads
Other MI Locations
Other MI Locations
Now, using these 3 diagrams let’s figure where to
look for a lateral wall and inferior wall MI.
Limb Leads Augmented Leads Precordial Leads
Anterior MI
Anterior MI
Remember the anterior portion of the heart is best
viewed using leads V
viewed using leads V1
1- V
- V4
4.
.
Limb Leads Augmented Leads Precordial Leads
Lateral MI
Lateral MI
So what leads do you think
the lateral portion of the
heart is best viewed?
Limb Leads Augmented Leads Precordial Leads
Leads I, aVL, and V5- V6
Inferior MI
Inferior MI
Now how about the
Now how about the
inferior portion of the
heart?
heart?
Limb Leads Augmented Leads Precordial Leads
Leads II, III and aVF
Putting it all Together
Now, where do you think this person is
having a myocardial infarction?
Inferior Wall MI
Inferior Wall MI
This is an inferior MI. Note the ST elevation
in leads II, III and aVF.
Putting it all Together
How about now?
How about now?
Anterolateral MI
Anterolateral MI
This person’s MI involves
This person’s MI involves both
both the anterior wall
the anterior wall
(V
(V2
2-V
-V4
4) and the lateral wall (V
) and the lateral wall (V5
5-V
-V6
6, I, and aVL)!
, I, and aVL)!
RIGHT ATRIAL ENLARGEMENT
Right atrial enlargement
– Take a look at this ECG. What do you notice about the P
Take a look at this ECG. What do you notice about the P
waves?
waves?
The P waves are tall, especially in leads II, III and avF.
Ouch! They would hurt to sit on!!
Right atrial enlargement
– To diagnose RAE you can use the following criteria:
To diagnose RAE you can use the following criteria:
• II
II P > 2.5 mm
P > 2.5 mm, or
, or
• V1 or V2
V1 or V2 P > 1.5 mm
P > 1.5 mm
Remember 1 small
box in height = 1 mm
A cause of RAE is RVH from pulmonary hypertension.
> 2 ½ boxes (in height)
> 1 ½ boxes (in height)
Left atrial enlargement
– Take a look at this ECG. What do you notice about the P
Take a look at this ECG. What do you notice about the P
waves?
waves?
The P waves in lead II are notched and in lead V1 they
have a deep and wide negative component.
Notched
Negative deflection
Left atrial enlargement
– To diagnose LAE you can use the following criteria:
To diagnose LAE you can use the following criteria:
• II
II > 0.04 s (1 box) between notched peaks
> 0.04 s (1 box) between notched peaks, or
, or
• V1
V1 Neg. deflection > 1 box wide x 1 box deep
Neg. deflection > 1 box wide x 1 box deep
Normal LAE
A common cause of LAE is LVH from hypertension.
Left Ventricular
Left Ventricular
Hypertrophy
Hypertrophy
Left Ventricular Hypertrophy
Compare these two 12-lead ECGs. What stands out
as different with the second one?
Normal Left Ventricular Hypertrophy
Answer: The QRS complexes are very tall
(increased voltage)
Left Ventricular Hypertrophy
• Criteria exists to diagnose LVH using a 12-lead ECG.
Criteria exists to diagnose LVH using a 12-lead ECG.
– For example:
For example:
• The R wave in V5 or V6 plus the S wave in V1 or V2
The R wave in V5 or V6 plus the S wave in V1 or V2
exceeds 35 mm.
exceeds 35 mm.
• However, for now, all
you need to know is
that the QRS voltage
increases with LVH.
Right ventricular hypertrophy
– Take a look at this ECG. What do you notice about the axis
Take a look at this ECG. What do you notice about the axis
and QRS complexes over the right ventricle (V1, V2)?
There is right axis deviation (negative in I, positive in II) and
there are tall R waves in V1, V2.
Right ventricular hypertrophy
– To diagnose RVH you can use the following criteria:
To diagnose RVH you can use the following criteria:
• Right axis deviation
Right axis deviation, and
, and
• V1
V1 R wave > 7mm tall
R wave > 7mm tall
A common
cause of RVH
is left heart
failure.
Right ventricular hypertrophy
– Compare the R waves in V1, V2 from a normal ECG and one from a
Compare the R waves in V1, V2 from a normal ECG and one from a
person with RVH.
person with RVH.
– Notice the R wave is normally small in V1, V2 because the right ventricle
Notice the R wave is normally small in V1, V2 because the right ventricle
does not have a lot of muscle mass.
– But in the hypertrophied right ventricle the R wave is tall in V1, V2.
But in the hypertrophied right ventricle the R wave is tall in V1, V2.
Normal RVH
Left ventricular hypertrophy
– Take a look at this ECG. What do you notice about the axis
Take a look at this ECG. What do you notice about the axis
and QRS complexes over the left ventricle (V5, V6) and
right ventricle (V1, V2)?
There is left axis deviation (positive in I, negative in II) and there
are tall R waves in V5, V6 and deep S waves in V1, V2.
The deep S waves
seen in the leads over
the right ventricle are
created because the
heart is depolarizing
left, superior and
posterior (away from
leads V1, V2).
Left ventricular hypertrophy
– To diagnose LVH you can use the following criteria
To diagnose LVH you can use the following criteria*
*:
:
• R in V5 (or V6) + S in V1 (or V2) > 35 mm
R in V5 (or V6) + S in V1 (or V2) > 35 mm, or
, or
• avL
avL R > 13 mm
R > 13 mm
A common cause of LVH
is hypertension.
* There are several
other criteria for the
diagnosis of LVH.
S = 13 mm
R = 25 mm
Bundle Branch Blocks
Normal Impulse Conduction
Sinoatrial node
AV node
Bundle of His
Bundle Branches
Purkinje fibers
Bundle Branch Blocks
So, conduction in the
Bundle Branches and
Bundle Branches and
Purkinje fibers are seen
as the QRS complex on
the ECG.
the ECG.
Therefore, a conduction
block of the Bundle
Branches would be
reflected as a change in
the QRS complex.
Right
BBB
Bundle Branch Blocks
With Bundle Branch Blocks you will see two changes
on the ECG.
on the ECG.
– QRS complex widens
QRS complex widens (> 0.12 sec)
(> 0.12 sec).
.
– QRS morphology changes
QRS morphology changes (varies depending on ECG lead,
(varies depending on ECG lead,
and if it is a right vs. left bundle branch block)
and if it is a right vs. left bundle branch block).
.
Right Bundle Branch Blocks
What QRS morphology is characteristic?
V1
For RBBB the wide QRS complex assumes a
unique, virtually diagnostic shape in those
leads overlying the right ventricle (V1 and V2).
“Rabbit Ears”
RBBB
RBBB
Left Bundle Branch Blocks
What QRS morphology is characteristic?
For LBBB the wide QRS complex assumes a
characteristic change in shape in those leads
opposite the left ventricle (right ventricular
leads - V1 and V2).
Broad,
deep S
waves
Normal
HYPERKALEMIA
HYPERKALEMIA
HYPERKALEMIA
HYPERKALEMIA
SEVERE HYPERKALEMIA
SEVERE HYPERKALEMIA
HYPOKALEMIA
HYPOKALEMIA
HYPOKALEMIA
HYPOKALEMIA
HYPOKALEMIA
HYPOKALEMIA
HYPERCALCEMIA
HYPERCALCEMIA
HYPOCALCEMIA
HYPOCALCEMIA
ACUTE PERICARDITIS
ACUTE PERICARDITIS
ACUTE PERICARDITIS
ACUTE PERICARDITIS
CARDIAC TAMPONADE
CARDIAC TAMPONADE
PERICARDIAL EFFUSION-Electrical
alterans
alterans
HYPOTHERMIA-OSBORNE WAVE
HYPOTHERMIA-
HYPOTHERMIA-
Giant Osborne waves
Giant Osborne waves

base-110816084037-phpapp02.pdf

  • 1.
    Basics of ECG http://emergencymedic.blogspot.com DrSubroto Mandal, MD, DM, DC Associate Professor, Cardiology
  • 2.
    HISTORY • 1842- Italianscientist Carlo Matteucci realizes that electricity is associated with the heart beat • 1876- Irish scientist Marey analyzes the electric pattern of frog’s heart • 1895 - William Einthoven , credited for the invention of EKG • 1906 - using the string electrometer EKG, William Einthoven diagnoses some heart problems
  • 3.
    CONTD… • 1924 -the noble prize for physiology or medicine is given to William Einthoven for his work on EKG • 1938 -AHA and Cardiac society of great Britan defined and position of chest leads • 1942- Goldberger increased Wilson’s Unipolar lead voltage by 50% and made Augmented leads • 2005- successful reduction in time of onset of chest pain and PTCA by wireless transmission of ECG on his PDA.
  • 5.
  • 6.
    What is anEKG? •The electrocardiogram (EKG) is a representation of the electrical events of the cardiac cycle. •Each event has a distinctive waveform •the study of waveform can lead to greater insight into a patient’s cardiac pathophysiology.
  • 7.
    With EKGs wecan identify Arrhythmias Myocardial ischemia and infarction Pericarditis Chamber hypertrophy Electrolyte disturbances (i.e. hyperkalemia, hypokalemia) Drug toxicity (i.e. digoxin and drugs which prolong the QT interval)
  • 8.
    Depolarization • Contraction ofany muscle is associated with electrical changes called depolarization • These changes can be detected by electrodes attached to the surface of the body
  • 9.
    Pacemakers of theHeart • SA Node - Dominant pacemaker with an intrinsic rate of 60 - 100 beats/minute. • AV Node - Back-up pacemaker with an intrinsic rate of 40 - 60 beats/minute. • Ventricular cells - Back-up pacemaker with an intrinsic rate of 20 - 45 bpm.
  • 10.
    • Standard calibration –25 mm/s – 0.1 mV/mm • Electrical impulse that travels towards the electrode produces an upright (“positive”) deflection
  • 11.
    Impulse Conduction &the ECG Sinoatrial node AV node Bundle of His Bundle Branches Purkinje fibers
  • 12.
    The “PQRST” • Pwave - Atrial depolarization • T wave - Ventricular repolarization • QRS - Ventricular depolarization
  • 13.
    The PR Interval Atrialdepolarization + delay in AV junction (AV node/Bundle of His) (delay allows time for the atria to contract before the ventricles contract)
  • 14.
  • 15.
    The ECG Paper •Horizontally – One small box - 0.04 s – One large box - 0.20 s • Vertically – One large box - 0.5 mV
  • 16.
    EKG Leads which measurethe difference in electrical potential between two points 1. Bipolar Leads: Two different points on the body 1. Bipolar Leads: Two different points on the body 2. Unipolar Leads: One point on the body and a virtual 2. Unipolar Leads: One point on the body and a virtual reference point with zero electrical potential, located in reference point with zero electrical potential, located in the center of the heart the center of the heart
  • 17.
    EKG Leads The standardEKG has 12 leads: 3 Standard Limb Leads 3 Augmented Limb Leads 6 Precordial Leads
  • 18.
  • 19.
  • 20.
  • 21.
  • 22.
  • 23.
  • 24.
    Right Sided &Posterior Chest Leads
  • 25.
  • 26.
  • 27.
  • 28.
  • 29.
  • 30.
  • 31.
    ECG RULES • ProfessorChamberlains 10 rules of normal:-
  • 32.
    RULE 1 PR intervalshould be 120 to 200 milliseconds or 3 to 5 little squares
  • 33.
    RULE 2 The widthof the QRS complex should not exceed 110 ms, less than 3 little squares
  • 34.
    RULE 3 The QRScomplex should be dominantly upright in leads I and II
  • 35.
    RULE 4 QRS andT waves tend to have the same general direction in the limb leads
  • 36.
    RULE 5 All wavesare negative in lead aVR
  • 37.
    RULE 6 The Rwave must grow from V1 to at least V4 The S wave must grow from V1 to at least V3 and disappear in V6
  • 38.
    RULE 7 The STsegment should start isoelectric except in V1 and V2 where it may be elevated
  • 39.
    RULE 8 The Pwaves should be upright in I, II, and V2 to V6
  • 40.
    RULE 9 There shouldbe no Q wave or only a small q less than 0.04 seconds in width in I, II, V2 to V6
  • 41.
    RULE 10 The Twave must be upright in I, II, V2 to V6
  • 42.
    P wave • Alwayspositive in lead I and II • Always negative in lead aVR • < 3 small squares in duration • < 2.5 small squares in amplitude • Commonly biphasic in lead V1 • Best seen in leads II
  • 43.
    Right Atrial Enlargement •Tall (> 2.5 mm), pointed P waves (P Pulmonale)
  • 44.
    • Notched/bifid (‘M’shaped) P wave (P ‘mitrale’) in limb leads Left Atrial Enlargement
  • 45.
  • 46.
    Short PR Interval •WPW (Wolff- Parkinson-White) Syndrome • Accessory pathway (Bundle of Kent) allows early activation of the ventricle (delta wave and short PR interval)
  • 47.
    Long PR Interval •First degree Heart Block
  • 48.
    QRS Complexes • Non­pathologicalQ waves may present in I, III, aVL, V5, and V6 • R wave in lead V6 is smaller than V5 • Depth of the S wave, should not exceed 30 mm • Pathological Q wave > 2mm deep and > 1mm wide or > 25% amplitude of the subsequent R wave
  • 49.
  • 50.
  • 51.
    Right Atrial andVentricular Hypertrophy
  • 52.
    Left Ventricular Hypertrophy •Sokolow & Lyon Criteria • S in V1+ R in V5 or V6 > 35 mm • An R wave of 11 to 13 mm (1.1 to 1.3 mV) or more in lead aVL is another sign of LVH
  • 54.
    ST Segment • STSegment is flat (isoelectric) • Elevation or depression of ST segment by 1 mm or more • “J” (Junction) point is the point between QRS and ST segment
  • 55.
    Variable Shapes OfST Segment Elevations in AMI Goldberger AL. Goldberger: Clinical Electrocardiography: A Simplified Approach. 7th ed: Mosby Elsevier; 2006.
  • 56.
    T wave • NormalT wave is asymmetrical, first half having a gradual slope than the second • Should be at least 1/8 but less than 2/3 of the amplitude of the R • T wave amplitude rarely exceeds 10 mm • Abnormal T waves are symmetrical, tall, peaked, biphasic or inverted. • T wave follows the direction of the QRS deflection.
  • 57.
  • 58.
    QT interval 1. Totalduration of Depolarization and Repolarization 2. QT interval decreases when heart rate increases 3. For HR = 70 bpm, QT<0.40 sec. 4. QT interval should be 0.35­ 0.45 s, 5. Should not be more than half of the interval between adjacent R waves (R­R interval).
  • 59.
  • 60.
    U wave • Uwave related to afterdepolarizations which follow repolarization • U waves are small, round, symmetrical and positive in lead II, with amplitude < 2 mm • U wave direction is the same as T wave • More prominent at slow heart rates
  • 61.
    Determining the HeartRate Rule of 300/1500 10 Second Rule
  • 62.
    Rule of 300 Countthe number of “big boxes” between two QRS complexes, and divide this into 300. (smaller boxes with 1500) for regular rhythms.
  • 63.
    What is theheart rate? (300 / 6) = 50 bpm
  • 64.
    What is theheart rate? (300 / ~ 4) = ~ 75 bpm
  • 65.
    What is theheart rate? (300 / 1.5) = 200 bpm
  • 66.
    The Rule of300 It may be easiest to memorize the following table: 50 6 60 5 75 4 100 3 150 2 300 1 Rate No of big boxes
  • 67.
    10 Second Rule EKGsrecord 10 seconds of rhythm per page, Count the number of beats present on the EKG Multiply by 6 For irregular rhythms.
  • 68.
    What is theheart rate? 33 x 6 = 198 bpm
  • 69.
  • 70.
  • 71.
    The QRS Axis TheQRS axis represents overall direction of the heart’s electrical activity. Abnormalities hint at: Ventricular enlargement Conduction blocks (i.e. hemiblocks)
  • 72.
    The QRS Axis NormalQRS axis from -30° to +90°. -30° to -90° is referred to as a left axis deviation (LAD) +90° to +180° is referred to as a right axis deviation (RAD)
  • 73.
    Determining the Axis TheQuadrant Approach The Equiphasic Approach
  • 74.
  • 75.
    The Quadrant Approach 1.QRS complex in leads I and aVF 2. determine if they are predominantly positive or negative. 3. The combination should place the axis into one of the 4 quadrants below.
  • 76.
    The Quadrant Approach •When LAD is present, • If the QRS in II is positive, the LAD is non-pathologic or the axis is normal • If negative, it is pathologic.
  • 77.
    Quadrant Approach: Example1 Negative in I, positive in aVF  RAD
  • 78.
    Quadrant Approach: Example2 Positive in I, negative in aVF  Predominantly positive in II  Normal Axis (non-pathologic LAD)
  • 79.
    The Equiphasic Approach 1.Most equiphasic QRS complex. 2. Identified Lead lies 90° away from the lead 3. QRS in this second lead is positive or Negative
  • 80.
    QRS Axis =-30 degrees
  • 81.
    QRS Axis =+90 degrees-KH
  • 83.
    Equiphasic Approach Equiphasic inaVF  Predominantly positive in I  QRS axis ≈ 0°
  • 84.
  • 85.
    BRADYARRYTHMIA Dr Subroto Mandal,MD, DM, DC Associate Professor, Cardiology
  • 86.
    Classification • Sinus Bradycardia •Junctional Rhythm • Sino Atrial Block • Atrioventricular block
  • 87.
    Impulse Conduction &the ECG Sinoatrial node AV node Bundle of His Bundle Branches
  • 88.
  • 89.
  • 90.
    SA Block • Sinusimpulses is blocked within the SA junction • Between SA node and surrounding myocardium • Abscent of complete Cardiac cycle • Occures irregularly and unpredictably • Present :Young athletes, Digitalis, Hypokalemia, Sick Sinus Syndrome
  • 91.
    AV Block • FirstDegree AV Block • Second Degree AV Block • Third Degree AV Block
  • 92.
    First Degree AVBlock • Delay in the conduction through the conducting system • Prolong P-R interval • All P waves are followed by QRS • Associated with : AC Rheumati Carditis, Digitalis, Beta Blocker, excessive vagal tone, ischemia, intrinsic disease in the AV junction or bundle branch system.
  • 93.
    Second Degree AVBlock • Intermittent failure of AV conduction • Impulse blocked by AV node • Types: • Mobitz type 1 (Wenckebach Phenomenon) • Mobitz type 2
  • 94.
    The 3 rulesof "classic AV Wenckebach" 2. Decreasing RR intervals until pause; 2. Pause is less than preceding 2 RR intervals 3. RR interval after the pause is greater than RR prior to pause. Mobitz type 1 (Wenckebach Phenomenon)
  • 95.
    Mobitz type 1(Wenckebach Phenomenon)
  • 96.
    •Mobitz type 2 •Usuallya sign of bilateral bundle branch disease. •One of the branches should be completely blocked; •most likely blocked in the right bundle •P waves may blocked somewhere in the AV junction, the His bundle.
  • 97.
    Third Degree HeartBlock •CHB evidenced by the AV dissociation •A junctional escape rhythm at 45 bpm. •The PP intervals vary because of ventriculophasic sinus arrhythmia;
  • 98.
    Third Degree HeartBlock 3rd degree AV block with a left ventricular escape rhythm, 'B' the right ventricular pacemaker rhythm is shown.
  • 99.
    The nonconducted PAC'sset up a long pause which is terminated by ventricular escapes; Wider QRS morphology of the escape beats indicating their ventricular origin. AV Dissociation
  • 100.
    AV Dissociation Due toAccelerated ventricular rhythm
  • 101.
  • 102.
    Putting it allTogether Putting it all Together Do you think this person is having a Do you think this person is having a myocardial infarction. If so, where? myocardial infarction. If so, where?
  • 103.
    Interpretation Interpretation Yes Yes, this personis having an acute anterior , this person is having an acute anterior wall myocardial infarction. wall myocardial infarction.
  • 104.
    Putting it allTogether Putting it all Together Now, where do you think this person is Now, where do you think this person is having a myocardial infarction? having a myocardial infarction?
  • 105.
    Inferior Wall MI InferiorWall MI This is an inferior MI. Note the ST elevation This is an inferior MI. Note the ST elevation in leads II, III and aVF. in leads II, III and aVF.
  • 106.
    Putting it allTogether Putting it all Together How about now? How about now?
  • 107.
    Anterolateral MI Anterolateral MI Thisperson’s MI involves This person’s MI involves both both the anterior wall the anterior wall (V (V2 2-V -V4 4) and the lateral wall (V ) and the lateral wall (V5 5-V -V6 6, I, and aVL)! , I, and aVL)!
  • 108.
    Rhythm #6 Rhythm #6 70bpm • Rate? • Regularity? regular flutter waves 0.06 s • P waves? • PR interval? none • QRS duration? Interpretation? Atrial Flutter
  • 109.
    Rhythm #7 Rhythm #7 74148 bpm • Rate? • Regularity? Regular  regular Normal  none 0.08 s • P waves? • PR interval? 0.16 s  none • QRS duration? Interpretation? Paroxysmal Supraventricular Tachycardia (PSVT)
  • 110.
    PSVT PSVT • Deviation fromNSR Deviation from NSR – The heart rate suddenly speeds up, often The heart rate suddenly speeds up, often triggered by a PAC (not seen here) and the P triggered by a PAC (not seen here) and the P waves are lost. waves are lost.
  • 111.
    Ventricular Arrhythmias Ventricular Arrhythmias •Ventricular Tachycardia Ventricular Tachycardia • Ventricular Fibrillation Ventricular Fibrillation
  • 112.
    Rhythm #8 Rhythm #8 160bpm • Rate? • Regularity? regular none wide (> 0.12 sec) • P waves? • PR interval? none • QRS duration? Interpretation? Ventricular Tachycardia
  • 113.
    Ventricular Tachycardia Ventricular Tachycardia •Deviation from NSR Deviation from NSR – Impulse is originating in the ventricles (no P Impulse is originating in the ventricles (no P waves, wide QRS). waves, wide QRS).
  • 114.
    Rhythm #9 Rhythm #9 none •Rate? • Regularity? irregularly irreg. none wide, if recognizable • P waves? • PR interval? none • QRS duration? Interpretation? Ventricular Fibrillation
  • 115.
    Ventricular Fibrillation Ventricular Fibrillation •Deviation from NSR Deviation from NSR – Completely abnormal. Completely abnormal.
  • 116.
    Arrhythmia Formation Arrhythmia Formation Arrhythmiascan arise from problems in the: Arrhythmias can arise from problems in the: • Sinus node Sinus node • Atrial cells Atrial cells • AV junction AV junction • Ventricular cells Ventricular cells
  • 117.
    SA Node Problems SANode Problems The SA Node can: The SA Node can: • fire too slow fire too slow • fire too fast fire too fast Sinus Bradycardia Sinus Bradycardia Sinus Tachycardia Sinus Tachycardia Sinus Tachycardia may be an appropriate response to stress.
  • 118.
    Atrial Cell Problems AtrialCell Problems Atrial cells can: Atrial cells can: • fire occasionally fire occasionally from a focus from a focus • fire continuously fire continuously due to a looping re- due to a looping re- entrant circuit entrant circuit Premature Atrial Contractions Premature Atrial Contractions (PACs) (PACs) Atrial Flutter Atrial Flutter
  • 119.
    AV Junctional Problems AVJunctional Problems The AV junction can: The AV junction can: • fire continuously due fire continuously due to a looping re- to a looping re- entrant circuit entrant circuit • block impulses block impulses coming from the SA coming from the SA Node Node Paroxysmal Paroxysmal Supraventricular Supraventricular Tachycardia Tachycardia AV Junctional Blocks AV Junctional Blocks
  • 120.
    Rhythm #1 Rhythm #1 30bpm • Rate? • Regularity? regular normal 0.10 s • P waves? • PR interval? 0.12 s • QRS duration? Interpretation? Sinus Bradycardia
  • 121.
    Rhythm #2 Rhythm #2 130bpm • Rate? • Regularity? regular normal 0.08 s • P waves? • PR interval? 0.16 s • QRS duration? Interpretation? Sinus Tachycardia
  • 122.
    Rhythm #3 Rhythm #3 70bpm • Rate? • Regularity? occasionally irreg. 2/7 different contour 0.08 s • P waves? • PR interval? 0.14 s (except 2/7) • QRS duration? Interpretation? NSR with Premature Atrial Contractions
  • 123.
    Premature Atrial Contractions PrematureAtrial Contractions • Deviation from NSR Deviation from NSR – These ectopic beats originate in the atria These ectopic beats originate in the atria (but not in the SA node), therefore the (but not in the SA node), therefore the contour of the P wave, the PR interval, contour of the P wave, the PR interval, and the timing are different than a and the timing are different than a normally generated pulse from the SA normally generated pulse from the SA node. node.
  • 124.
    Rhythm #4 Rhythm #4 60bpm • Rate? • Regularity? occasionally irreg. none for 7th QRS 0.08 s (7th wide) • P waves? • PR interval? 0.14 s • QRS duration? Interpretation? Sinus Rhythm with 1 PVC
  • 125.
    Ventricular Conduction Ventricular Conduction Normal Signalmoves rapidly through the ventricles Abnormal Signal moves slowly through the ventricles
  • 126.
    AV Nodal Blocks AVNodal Blocks • 1st Degree AV Block 1st Degree AV Block • 2nd Degree AV Block, Type I 2nd Degree AV Block, Type I • 2nd Degree AV Block, Type II 2nd Degree AV Block, Type II • 3rd Degree AV Block 3rd Degree AV Block
  • 127.
    Rhythm #10 Rhythm #10 60bpm • Rate? • Regularity? regular normal 0.08 s • P waves? • PR interval? 0.36 s • QRS duration? Interpretation? 1st Degree AV Block
  • 128.
    1st Degree AVBlock 1st Degree AV Block • Etiology: Etiology: Prolonged conduction delay in the AV Prolonged conduction delay in the AV node or Bundle of His. node or Bundle of His.
  • 129.
    Rhythm #11 Rhythm #11 50bpm • Rate? • Regularity? regularly irregular nl, but 4th no QRS 0.08 s • P waves? • PR interval? lengthens • QRS duration? Interpretation? 2nd Degree AV Block, Type I
  • 130.
    Rhythm #12 Rhythm #12 40bpm • Rate? • Regularity? regular nl, 2 of 3 no QRS 0.08 s • P waves? • PR interval? 0.14 s • QRS duration? Interpretation? 2nd Degree AV Block, Type II
  • 131.
    2nd Degree AVBlock, Type II 2nd Degree AV Block, Type II • Deviation from NSR Deviation from NSR – Occasional P waves are completely blocked Occasional P waves are completely blocked (P wave not followed by QRS). (P wave not followed by QRS).
  • 132.
    Rhythm #13 Rhythm #13 40bpm • Rate? • Regularity? regular no relation to QRS wide (> 0.12 s) • P waves? • PR interval? none • QRS duration? Interpretation? 3rd Degree AV Block
  • 133.
    3rd Degree AVBlock 3rd Degree AV Block • Deviation from NSR Deviation from NSR – The P waves are completely blocked in the The P waves are completely blocked in the AV junction; QRS complexes originate AV junction; QRS complexes originate independently from below the junction. independently from below the junction.
  • 134.
    Supraventricular Arrhythmias Supraventricular Arrhythmias •Atrial Fibrillation Atrial Fibrillation • Atrial Flutter Atrial Flutter • Paroxysmal Supraventricular Tachycardia Paroxysmal Supraventricular Tachycardia
  • 135.
    Rhythm #5 Rhythm #5 100bpm • Rate? • Regularity? irregularly irregular none 0.06 s • P waves? • PR interval? none • QRS duration? Interpretation? Atrial Fibrillation
  • 136.
    Atrial Fibrillation Atrial Fibrillation •Deviation from NSR Deviation from NSR – No organized atrial depolarization, so no No organized atrial depolarization, so no normal P waves (impulses are not originating normal P waves (impulses are not originating from the sinus node). from the sinus node). – Atrial activity is chaotic (resulting in an Atrial activity is chaotic (resulting in an irregularly irregular rate). irregularly irregular rate). – Common, affects 2-4%, up to 5-10% if > 80 Common, affects 2-4%, up to 5-10% if > 80 years old years old
  • 137.
    Rhythm #6 Rhythm #6 70bpm • Rate? • Regularity? regular flutter waves 0.06 s • P waves? • PR interval? none • QRS duration? Interpretation? Atrial Flutter
  • 138.
    Rhythm #7 Rhythm #7 74148 bpm • Rate? • Regularity? Regular  regular Normal  none 0.08 s • P waves? • PR interval? 0.16 s  none • QRS duration? Interpretation? Paroxysmal Supraventricular Tachycardia (PSVT)
  • 139.
    PSVT PSVT • Deviation fromNSR Deviation from NSR – The heart rate suddenly speeds up, often The heart rate suddenly speeds up, often triggered by a PAC (not seen here) and the P triggered by a PAC (not seen here) and the P waves are lost. waves are lost.
  • 140.
    Ventricular Arrhythmias Ventricular Arrhythmias •Ventricular Tachycardia Ventricular Tachycardia • Ventricular Fibrillation Ventricular Fibrillation
  • 141.
    Rhythm #8 Rhythm #8 160bpm • Rate? • Regularity? regular none wide (> 0.12 sec) • P waves? • PR interval? none • QRS duration? Interpretation? Ventricular Tachycardia
  • 142.
    Ventricular Tachycardia Ventricular Tachycardia •Deviation from NSR Deviation from NSR – Impulse is originating in the ventricles (no P Impulse is originating in the ventricles (no P waves, wide QRS). waves, wide QRS).
  • 143.
    Rhythm #9 Rhythm #9 none •Rate? • Regularity? irregularly irreg. none wide, if recognizable • P waves? • PR interval? none • QRS duration? Interpretation? Ventricular Fibrillation
  • 144.
    Ventricular Fibrillation Ventricular Fibrillation •Deviation from NSR Deviation from NSR – Completely abnormal. Completely abnormal.
  • 145.
    Diagnosing a MI Diagnosinga MI To diagnose a myocardial infarction you need To diagnose a myocardial infarction you need to go beyond looking at a rhythm strip and to go beyond looking at a rhythm strip and obtain a 12-Lead ECG. obtain a 12-Lead ECG. Rhythm Strip 12-Lead ECG
  • 146.
    Views of theHeart Views of the Heart Some leads get a Some leads get a good view of the: good view of the: Anterior portion of the heart Lateral portion of the heart Inferior portion of the heart
  • 147.
    ST Elevation ST Elevation Oneway to One way to diagnose an diagnose an acute MI is to acute MI is to look for look for elevation of the elevation of the ST segment. ST segment.
  • 148.
    ST Elevation (cont) STElevation (cont) Elevation of the ST Elevation of the ST segment (greater segment (greater than 1 small box) in than 1 small box) in 2 leads is consistent 2 leads is consistent with a myocardial with a myocardial infarction. infarction.
  • 149.
    Anterior View ofthe Heart Anterior View of the Heart The anterior portion of the heart is best viewed The anterior portion of the heart is best viewed using leads V using leads V1 1- V - V4 4. .
  • 150.
    Anterior Myocardial Infarction AnteriorMyocardial Infarction If you see changes in leads V If you see changes in leads V1 1 - V - V4 4 that that are consistent with a myocardial are consistent with a myocardial infarction, you can conclude that it is an infarction, you can conclude that it is an anterior wall myocardial infarction. anterior wall myocardial infarction.
  • 151.
    Putting it allTogether Putting it all Together Do you think this person is having a Do you think this person is having a myocardial infarction. If so, where? myocardial infarction. If so, where?
  • 152.
    Interpretation Interpretation Yes Yes, this personis having an acute anterior , this person is having an acute anterior wall myocardial infarction. wall myocardial infarction.
  • 153.
    Other MI Locations OtherMI Locations Now that you know where to look for an Now that you know where to look for an anterior wall myocardial infarction let’s look at anterior wall myocardial infarction let’s look at how you would determine if the MI involves how you would determine if the MI involves the lateral wall or the inferior wall of the heart. the lateral wall or the inferior wall of the heart.
  • 154.
    Other MI Locations OtherMI Locations First, take a look First, take a look again at this picture again at this picture of the heart. of the heart. Anterior portion of the heart Lateral portion of the heart Inferior portion of the heart
  • 155.
    Other MI Locations OtherMI Locations Second, remember that the 12-leads of the ECG look at different Second, remember that the 12-leads of the ECG look at different portions of the heart. The limb and augmented leads “see” electrical portions of the heart. The limb and augmented leads “see” electrical activity moving inferiorly (II, III and aVF), to the left (I, aVL) and to activity moving inferiorly (II, III and aVF), to the left (I, aVL) and to the right (aVR). Whereas, the precordial leads “see” electrical the right (aVR). Whereas, the precordial leads “see” electrical activity in the posterior to anterior direction. activity in the posterior to anterior direction. Limb Leads Augmented Leads Precordial Leads
  • 156.
    Other MI Locations OtherMI Locations Now, using these 3 diagrams let’s figure where to Now, using these 3 diagrams let’s figure where to look for a lateral wall and inferior wall MI. look for a lateral wall and inferior wall MI. Limb Leads Augmented Leads Precordial Leads
  • 157.
    Anterior MI Anterior MI Rememberthe anterior portion of the heart is best Remember the anterior portion of the heart is best viewed using leads V viewed using leads V1 1- V - V4 4. . Limb Leads Augmented Leads Precordial Leads
  • 158.
    Lateral MI Lateral MI Sowhat leads do you think So what leads do you think the lateral portion of the the lateral portion of the heart is best viewed? heart is best viewed? Limb Leads Augmented Leads Precordial Leads Leads I, aVL, and V5- V6
  • 159.
    Inferior MI Inferior MI Nowhow about the Now how about the inferior portion of the inferior portion of the heart? heart? Limb Leads Augmented Leads Precordial Leads Leads II, III and aVF
  • 160.
    Putting it allTogether Putting it all Together Now, where do you think this person is Now, where do you think this person is having a myocardial infarction? having a myocardial infarction?
  • 161.
    Inferior Wall MI InferiorWall MI This is an inferior MI. Note the ST elevation This is an inferior MI. Note the ST elevation in leads II, III and aVF. in leads II, III and aVF.
  • 162.
    Putting it allTogether Putting it all Together How about now? How about now?
  • 163.
    Anterolateral MI Anterolateral MI Thisperson’s MI involves This person’s MI involves both both the anterior wall the anterior wall (V (V2 2-V -V4 4) and the lateral wall (V ) and the lateral wall (V5 5-V -V6 6, I, and aVL)! , I, and aVL)!
  • 164.
  • 165.
    Right atrial enlargement Rightatrial enlargement – Take a look at this ECG. What do you notice about the P Take a look at this ECG. What do you notice about the P waves? waves? The P waves are tall, especially in leads II, III and avF. Ouch! They would hurt to sit on!!
  • 166.
    Right atrial enlargement Rightatrial enlargement – To diagnose RAE you can use the following criteria: To diagnose RAE you can use the following criteria: • II II P > 2.5 mm P > 2.5 mm, or , or • V1 or V2 V1 or V2 P > 1.5 mm P > 1.5 mm Remember 1 small box in height = 1 mm A cause of RAE is RVH from pulmonary hypertension. > 2 ½ boxes (in height) > 1 ½ boxes (in height)
  • 167.
    Left atrial enlargement Leftatrial enlargement – Take a look at this ECG. What do you notice about the P Take a look at this ECG. What do you notice about the P waves? waves? The P waves in lead II are notched and in lead V1 they have a deep and wide negative component. Notched Negative deflection
  • 168.
    Left atrial enlargement Leftatrial enlargement – To diagnose LAE you can use the following criteria: To diagnose LAE you can use the following criteria: • II II > 0.04 s (1 box) between notched peaks > 0.04 s (1 box) between notched peaks, or , or • V1 V1 Neg. deflection > 1 box wide x 1 box deep Neg. deflection > 1 box wide x 1 box deep Normal LAE A common cause of LAE is LVH from hypertension.
  • 169.
  • 170.
    Left Ventricular Hypertrophy LeftVentricular Hypertrophy Compare these two 12-lead ECGs. What stands out Compare these two 12-lead ECGs. What stands out as different with the second one? as different with the second one? Normal Left Ventricular Hypertrophy Answer: The QRS complexes are very tall (increased voltage)
  • 171.
    Left Ventricular Hypertrophy LeftVentricular Hypertrophy • Criteria exists to diagnose LVH using a 12-lead ECG. Criteria exists to diagnose LVH using a 12-lead ECG. – For example: For example: • The R wave in V5 or V6 plus the S wave in V1 or V2 The R wave in V5 or V6 plus the S wave in V1 or V2 exceeds 35 mm. exceeds 35 mm. • However, for now, all you need to know is that the QRS voltage increases with LVH.
  • 172.
    Right ventricular hypertrophy Rightventricular hypertrophy – Take a look at this ECG. What do you notice about the axis Take a look at this ECG. What do you notice about the axis and QRS complexes over the right ventricle (V1, V2)? and QRS complexes over the right ventricle (V1, V2)? There is right axis deviation (negative in I, positive in II) and there are tall R waves in V1, V2.
  • 173.
    Right ventricular hypertrophy Rightventricular hypertrophy – To diagnose RVH you can use the following criteria: To diagnose RVH you can use the following criteria: • Right axis deviation Right axis deviation, and , and • V1 V1 R wave > 7mm tall R wave > 7mm tall A common cause of RVH is left heart failure.
  • 174.
    Right ventricular hypertrophy Rightventricular hypertrophy – Compare the R waves in V1, V2 from a normal ECG and one from a Compare the R waves in V1, V2 from a normal ECG and one from a person with RVH. person with RVH. – Notice the R wave is normally small in V1, V2 because the right ventricle Notice the R wave is normally small in V1, V2 because the right ventricle does not have a lot of muscle mass. does not have a lot of muscle mass. – But in the hypertrophied right ventricle the R wave is tall in V1, V2. But in the hypertrophied right ventricle the R wave is tall in V1, V2. Normal RVH
  • 175.
    Left ventricular hypertrophy Leftventricular hypertrophy – Take a look at this ECG. What do you notice about the axis Take a look at this ECG. What do you notice about the axis and QRS complexes over the left ventricle (V5, V6) and and QRS complexes over the left ventricle (V5, V6) and right ventricle (V1, V2)? right ventricle (V1, V2)? There is left axis deviation (positive in I, negative in II) and there are tall R waves in V5, V6 and deep S waves in V1, V2. The deep S waves seen in the leads over the right ventricle are created because the heart is depolarizing left, superior and posterior (away from leads V1, V2).
  • 176.
    Left ventricular hypertrophy Leftventricular hypertrophy – To diagnose LVH you can use the following criteria To diagnose LVH you can use the following criteria* *: : • R in V5 (or V6) + S in V1 (or V2) > 35 mm R in V5 (or V6) + S in V1 (or V2) > 35 mm, or , or • avL avL R > 13 mm R > 13 mm A common cause of LVH is hypertension. * There are several other criteria for the diagnosis of LVH. S = 13 mm R = 25 mm
  • 177.
  • 178.
    Normal Impulse Conduction Sinoatrialnode AV node Bundle of His Bundle Branches Purkinje fibers
  • 179.
    Bundle Branch Blocks BundleBranch Blocks So, conduction in the So, conduction in the Bundle Branches and Bundle Branches and Purkinje fibers are seen Purkinje fibers are seen as the QRS complex on as the QRS complex on the ECG. the ECG. Therefore, a conduction block of the Bundle Branches would be reflected as a change in the QRS complex. Right BBB
  • 180.
    Bundle Branch Blocks BundleBranch Blocks With Bundle Branch Blocks you will see two changes With Bundle Branch Blocks you will see two changes on the ECG. on the ECG. – QRS complex widens QRS complex widens (> 0.12 sec) (> 0.12 sec). . – QRS morphology changes QRS morphology changes (varies depending on ECG lead, (varies depending on ECG lead, and if it is a right vs. left bundle branch block) and if it is a right vs. left bundle branch block). .
  • 182.
    Right Bundle BranchBlocks Right Bundle Branch Blocks What QRS morphology is characteristic? What QRS morphology is characteristic? V1 For RBBB the wide QRS complex assumes a unique, virtually diagnostic shape in those leads overlying the right ventricle (V1 and V2). “Rabbit Ears”
  • 183.
  • 185.
    Left Bundle BranchBlocks Left Bundle Branch Blocks What QRS morphology is characteristic? What QRS morphology is characteristic? For LBBB the wide QRS complex assumes a characteristic change in shape in those leads opposite the left ventricle (right ventricular leads - V1 and V2). Broad, deep S waves Normal
  • 191.
  • 192.
  • 194.
  • 195.
  • 196.
  • 197.
  • 198.
  • 199.
  • 201.
  • 202.
  • 203.
  • 204.
  • 205.
  • 206.