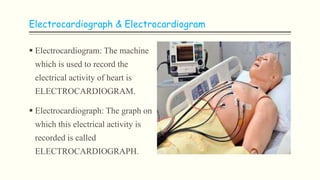
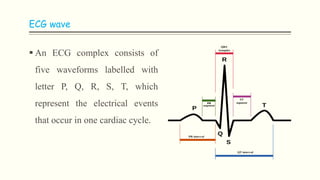
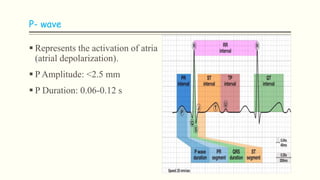
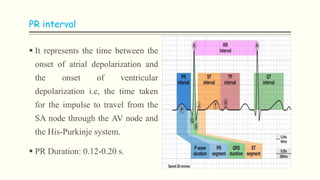
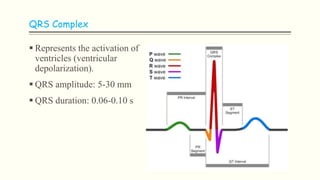
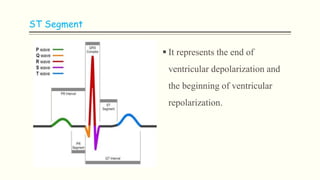
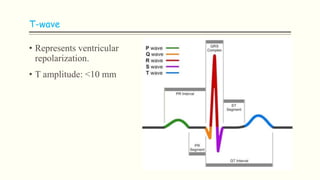
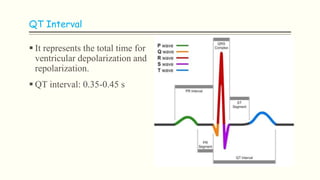
ELECTROCARDIOGRAM (ECG)
Dr. Shilpasree Saha(PT)
MPT (Cardio-Thoracic Disorders)
Assistant Professor, JVWU
Introduction
 ECGs detect the sequence of electrical events that occur during
contraction (depolarization) and relaxation (repolarization) cycle of
heart.
 Depolarization is initiated by sinoatrial node (SA node), natural
pacemaker of heart, transmits electrical stimulus to atrioventricular
(AV) node.
 From here, the impulse is conducted through Bundle of His & along
the Bundle branches to Purkinje fibres causing the heart to contract.
 When there is dysfunction of pacemaker of SA node, AV node acts
as a pacemaker.
Electrocardiograph & Electrocardiogram
 Electrocardiogram: The machine
which is used to record the
electrical activity of heart is
ELECTROCARDIOGRAM.
 Electrocardiograph: The graph on
which this electrical activity is
recorded is called
ELECTROCARDIOGRAPH.
Significance of ECG
 ECG gives information about rate and rhythm of the heart.
 The physical orientation of heart i.e axis.
 Its a diagnostic tool for various heart conditions like hypertrophies ,
ischemia, infarction , arrhythmias conduction problems and pace
maker activity.
Basic Idea
 ECG are recorded on a graph
paper that travels at 25 mm/sec.
It is divided into large squares of
5 mm width, which represents
0.2 sec horizontally.
 Each large square is divided into
five square of 1 mm width (0.04
sec horizontally).
 Electrical activity is measured in
millivolts (mV).
ECG wave
 An ECG complex consists of
five waveforms labelled with
letter P, Q, R, S, T, which
represent the electrical events
that occur in one cardiac cycle.
P- wave
 Represents the activation of atria
(atrial depolarization).
 P Amplitude: ˂2.5 mm
 P Duration: 0.06-0.12 s
PR interval
 It represents the time between the
onset of atrial depolarization and
the onset of ventricular
depolarization i.e, the time taken
for the impulse to travel from the
SA node through the AV node and
the His-Purkinje system.
 PR Duration: 0.12-0.20 s.
QRS Complex
 Represents the activation of
ventricles (ventricular
depolarization).
 QRS amplitude: 5-30 mm
 QRS duration: 0.06-0.10 s
ST Segment
 It represents the end of
ventricular depolarization and
the beginning of ventricular
repolarization.
T-wave
• Represents ventricular
repolarization.
• T amplitude: ˂10 mm
QT Interval
 It represents the total time for
ventricular depolarization and
repolarization.
 QT interval: 0.35-0.45 s
U wave
 It represents repolarization of
the His-Purkinje system and is
not present always in an ECG.
Heart rate count
 Normal range at rest is between 60-100 beats per minute (bpm).
 Bradycardia: It is an abnormal condition when the heart beats
slower than normal heart rate, i.e, ˂60 beats/minute.
 Tachycardia: It is an abnormal condition when the heart beats faster
than normal heart rate, i.e, ˃100 beats/minute.
 HR = 300 / number of large squares between successive R waves.
 HR = 1500 / number of small squares between successive R waves.
Count the heart rate
Ecg

Ecg

  • 1.
    ELECTROCARDIOGRAM (ECG) Dr. ShilpasreeSaha(PT) MPT (Cardio-Thoracic Disorders) Assistant Professor, JVWU
  • 2.
    Introduction  ECGs detectthe sequence of electrical events that occur during contraction (depolarization) and relaxation (repolarization) cycle of heart.  Depolarization is initiated by sinoatrial node (SA node), natural pacemaker of heart, transmits electrical stimulus to atrioventricular (AV) node.  From here, the impulse is conducted through Bundle of His & along the Bundle branches to Purkinje fibres causing the heart to contract.  When there is dysfunction of pacemaker of SA node, AV node acts as a pacemaker.
  • 3.
    Electrocardiograph & Electrocardiogram Electrocardiogram: The machine which is used to record the electrical activity of heart is ELECTROCARDIOGRAM.  Electrocardiograph: The graph on which this electrical activity is recorded is called ELECTROCARDIOGRAPH.
  • 4.
    Significance of ECG ECG gives information about rate and rhythm of the heart.  The physical orientation of heart i.e axis.  Its a diagnostic tool for various heart conditions like hypertrophies , ischemia, infarction , arrhythmias conduction problems and pace maker activity.
  • 5.
    Basic Idea  ECGare recorded on a graph paper that travels at 25 mm/sec. It is divided into large squares of 5 mm width, which represents 0.2 sec horizontally.  Each large square is divided into five square of 1 mm width (0.04 sec horizontally).  Electrical activity is measured in millivolts (mV).
  • 6.
    ECG wave  AnECG complex consists of five waveforms labelled with letter P, Q, R, S, T, which represent the electrical events that occur in one cardiac cycle.
  • 7.
    P- wave  Representsthe activation of atria (atrial depolarization).  P Amplitude: ˂2.5 mm  P Duration: 0.06-0.12 s
  • 8.
    PR interval  Itrepresents the time between the onset of atrial depolarization and the onset of ventricular depolarization i.e, the time taken for the impulse to travel from the SA node through the AV node and the His-Purkinje system.  PR Duration: 0.12-0.20 s.
  • 9.
    QRS Complex  Representsthe activation of ventricles (ventricular depolarization).  QRS amplitude: 5-30 mm  QRS duration: 0.06-0.10 s
  • 10.
    ST Segment  Itrepresents the end of ventricular depolarization and the beginning of ventricular repolarization.
  • 11.
  • 12.
    QT Interval  Itrepresents the total time for ventricular depolarization and repolarization.  QT interval: 0.35-0.45 s
  • 13.
    U wave  Itrepresents repolarization of the His-Purkinje system and is not present always in an ECG.
  • 14.
    Heart rate count Normal range at rest is between 60-100 beats per minute (bpm).  Bradycardia: It is an abnormal condition when the heart beats slower than normal heart rate, i.e, ˂60 beats/minute.  Tachycardia: It is an abnormal condition when the heart beats faster than normal heart rate, i.e, ˃100 beats/minute.  HR = 300 / number of large squares between successive R waves.  HR = 1500 / number of small squares between successive R waves.
  • 15.
  • 16.

Editor's Notes

  • #2 NOTE: To change the image on this slide, select the picture and delete it. Then click the Pictures icon in the placeholder to insert your own image.