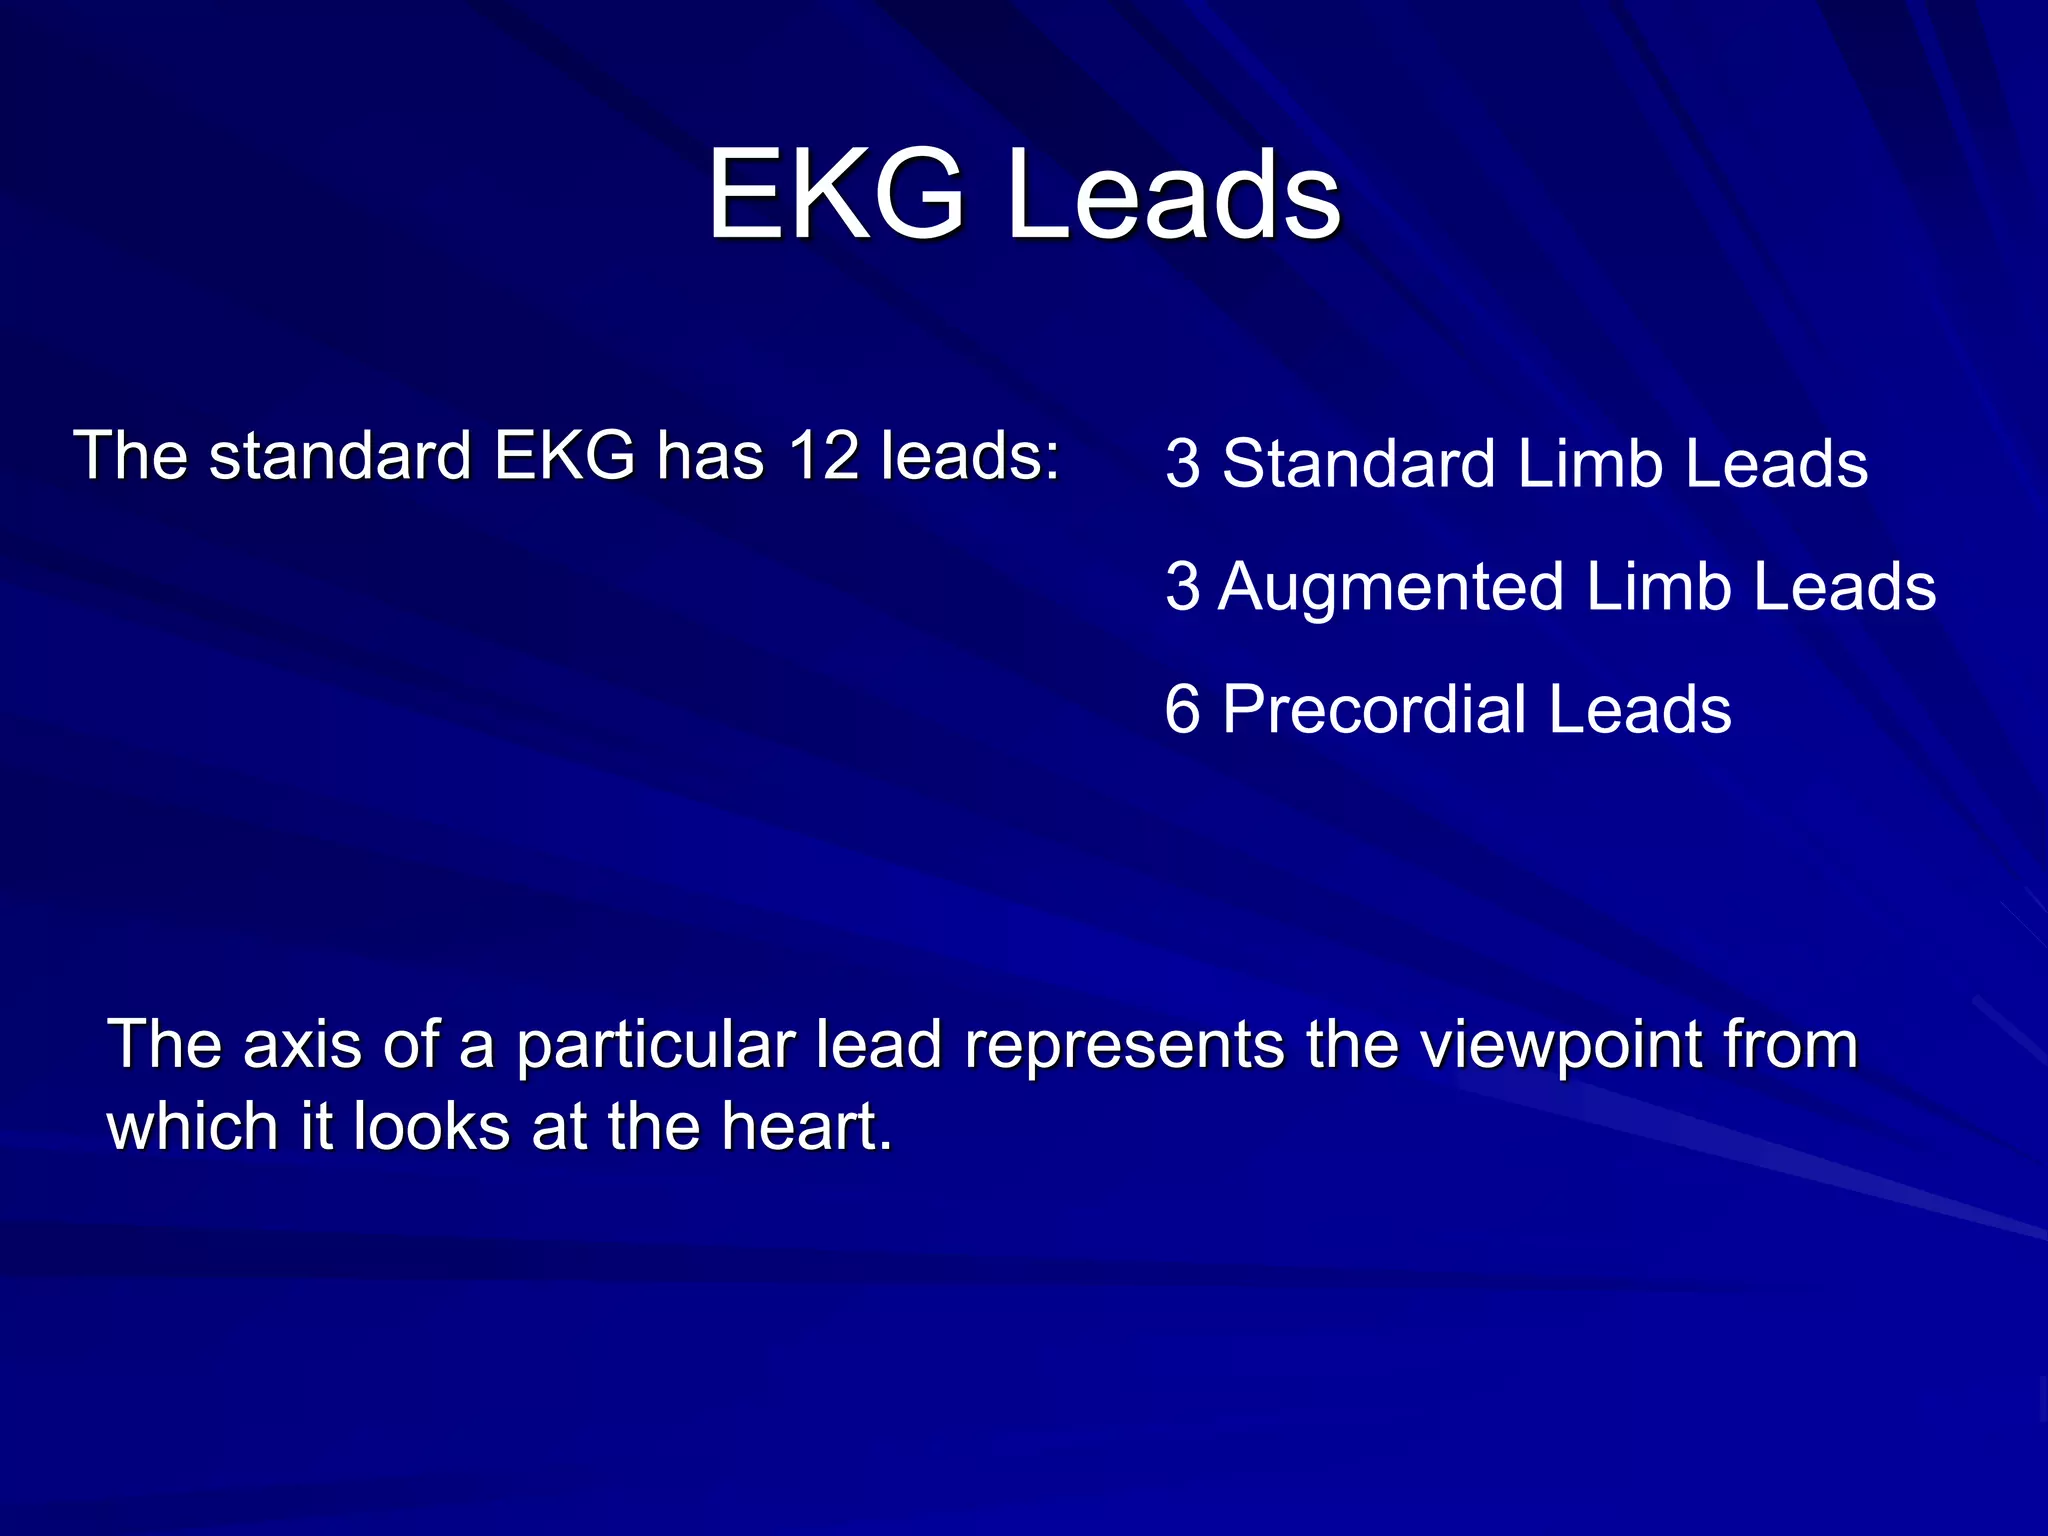
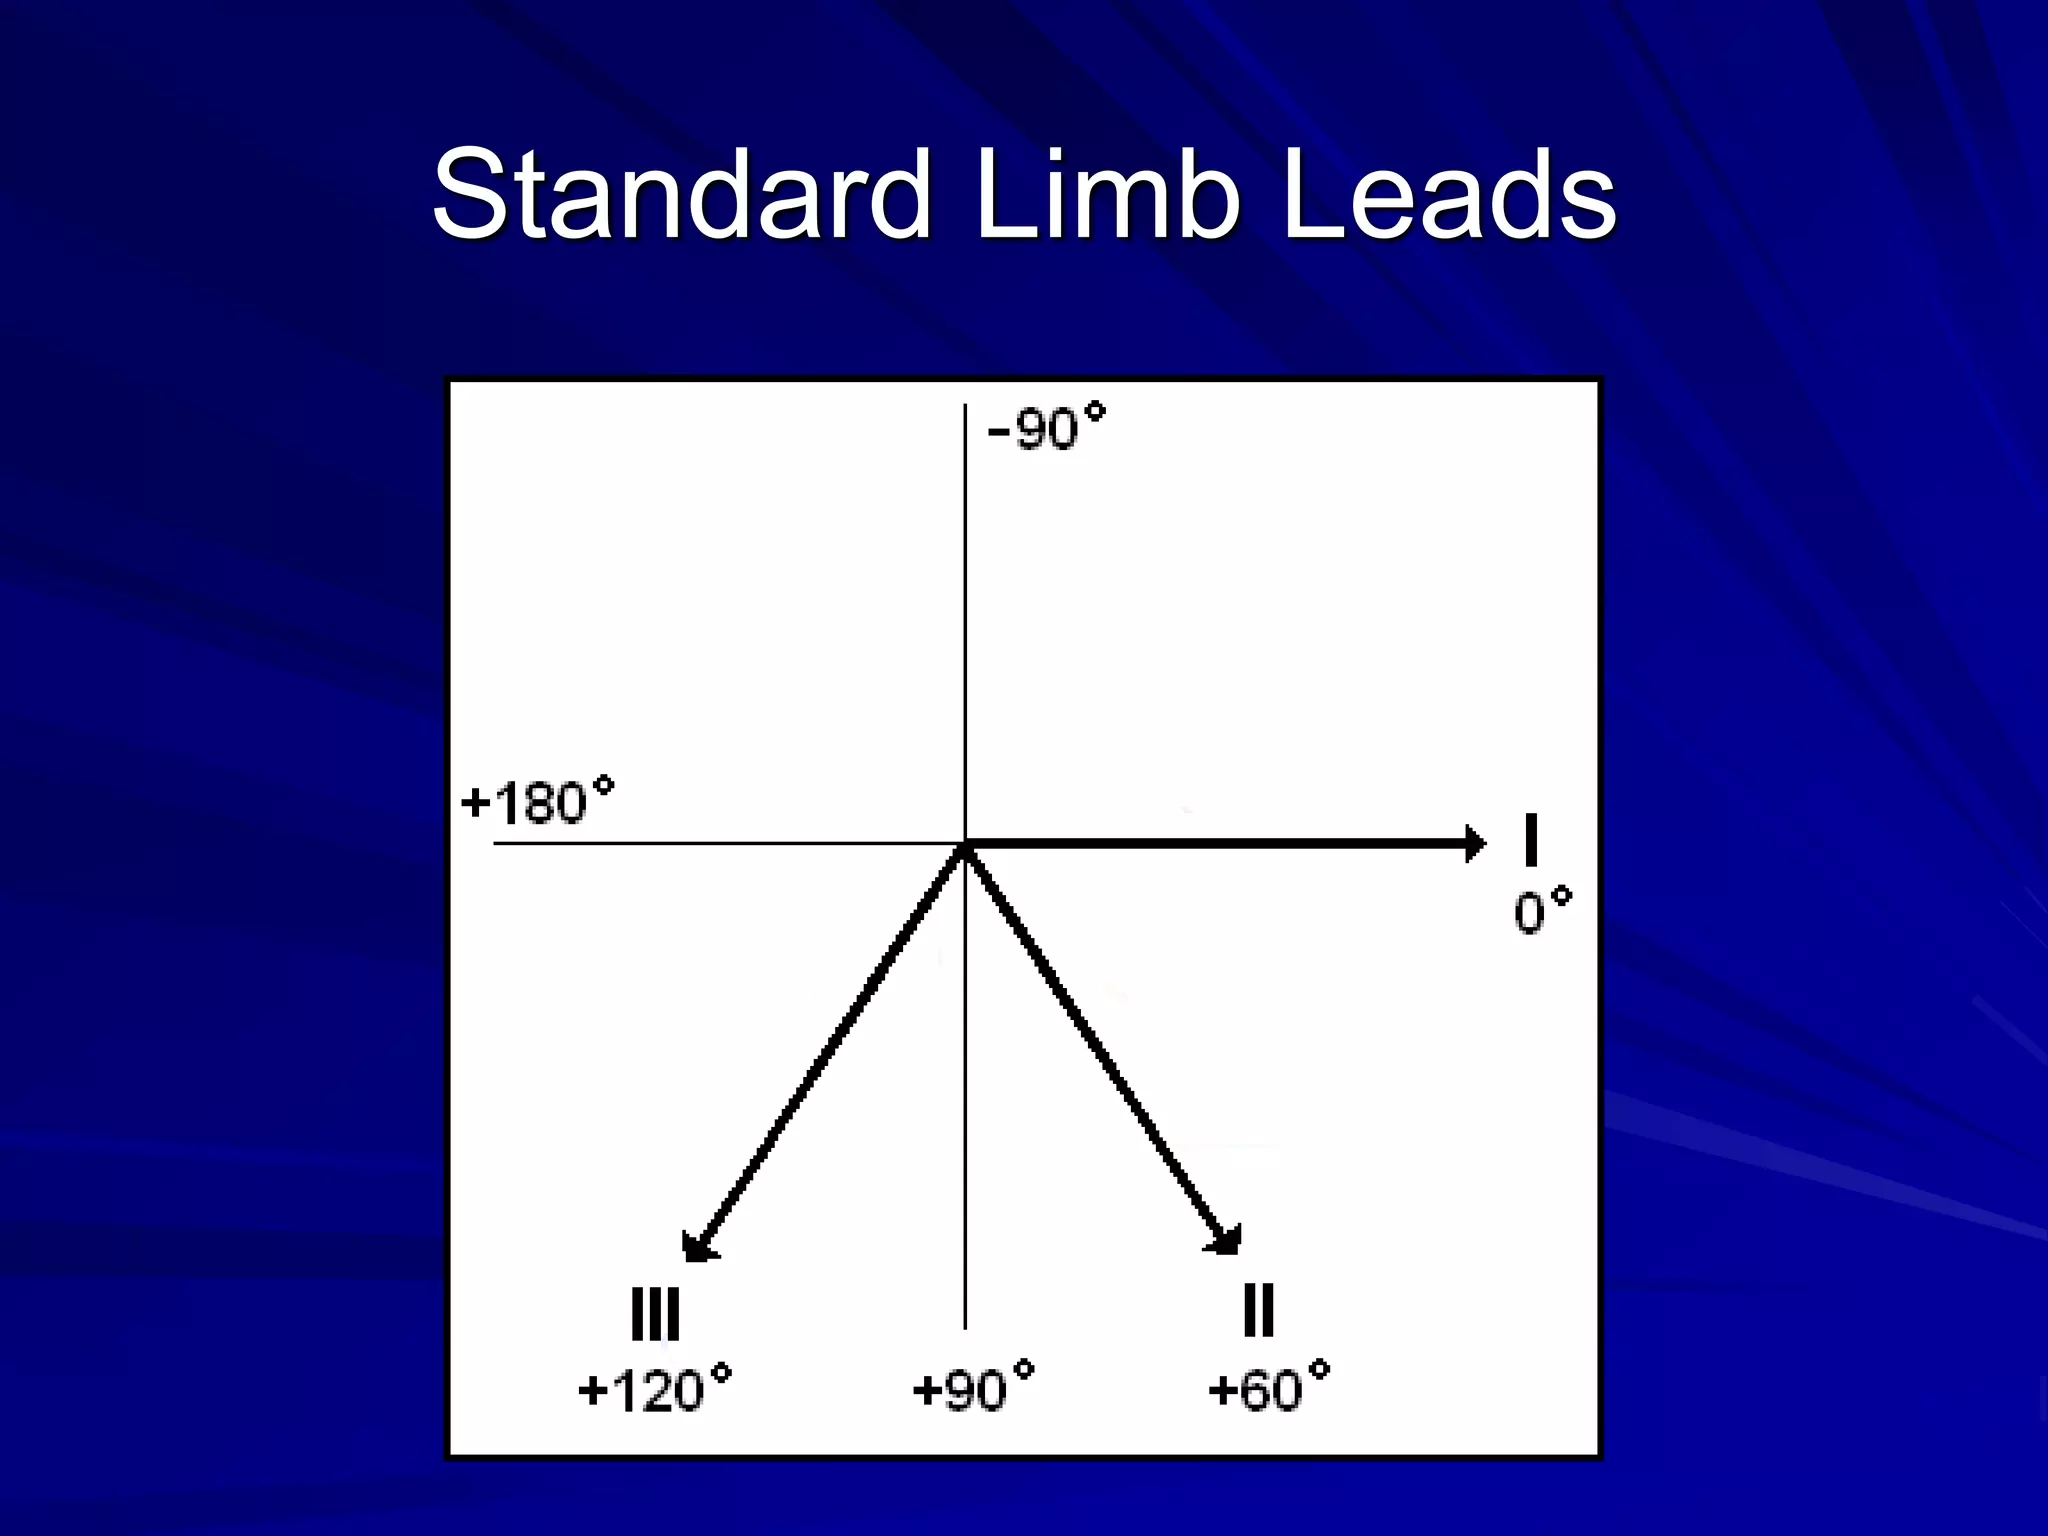
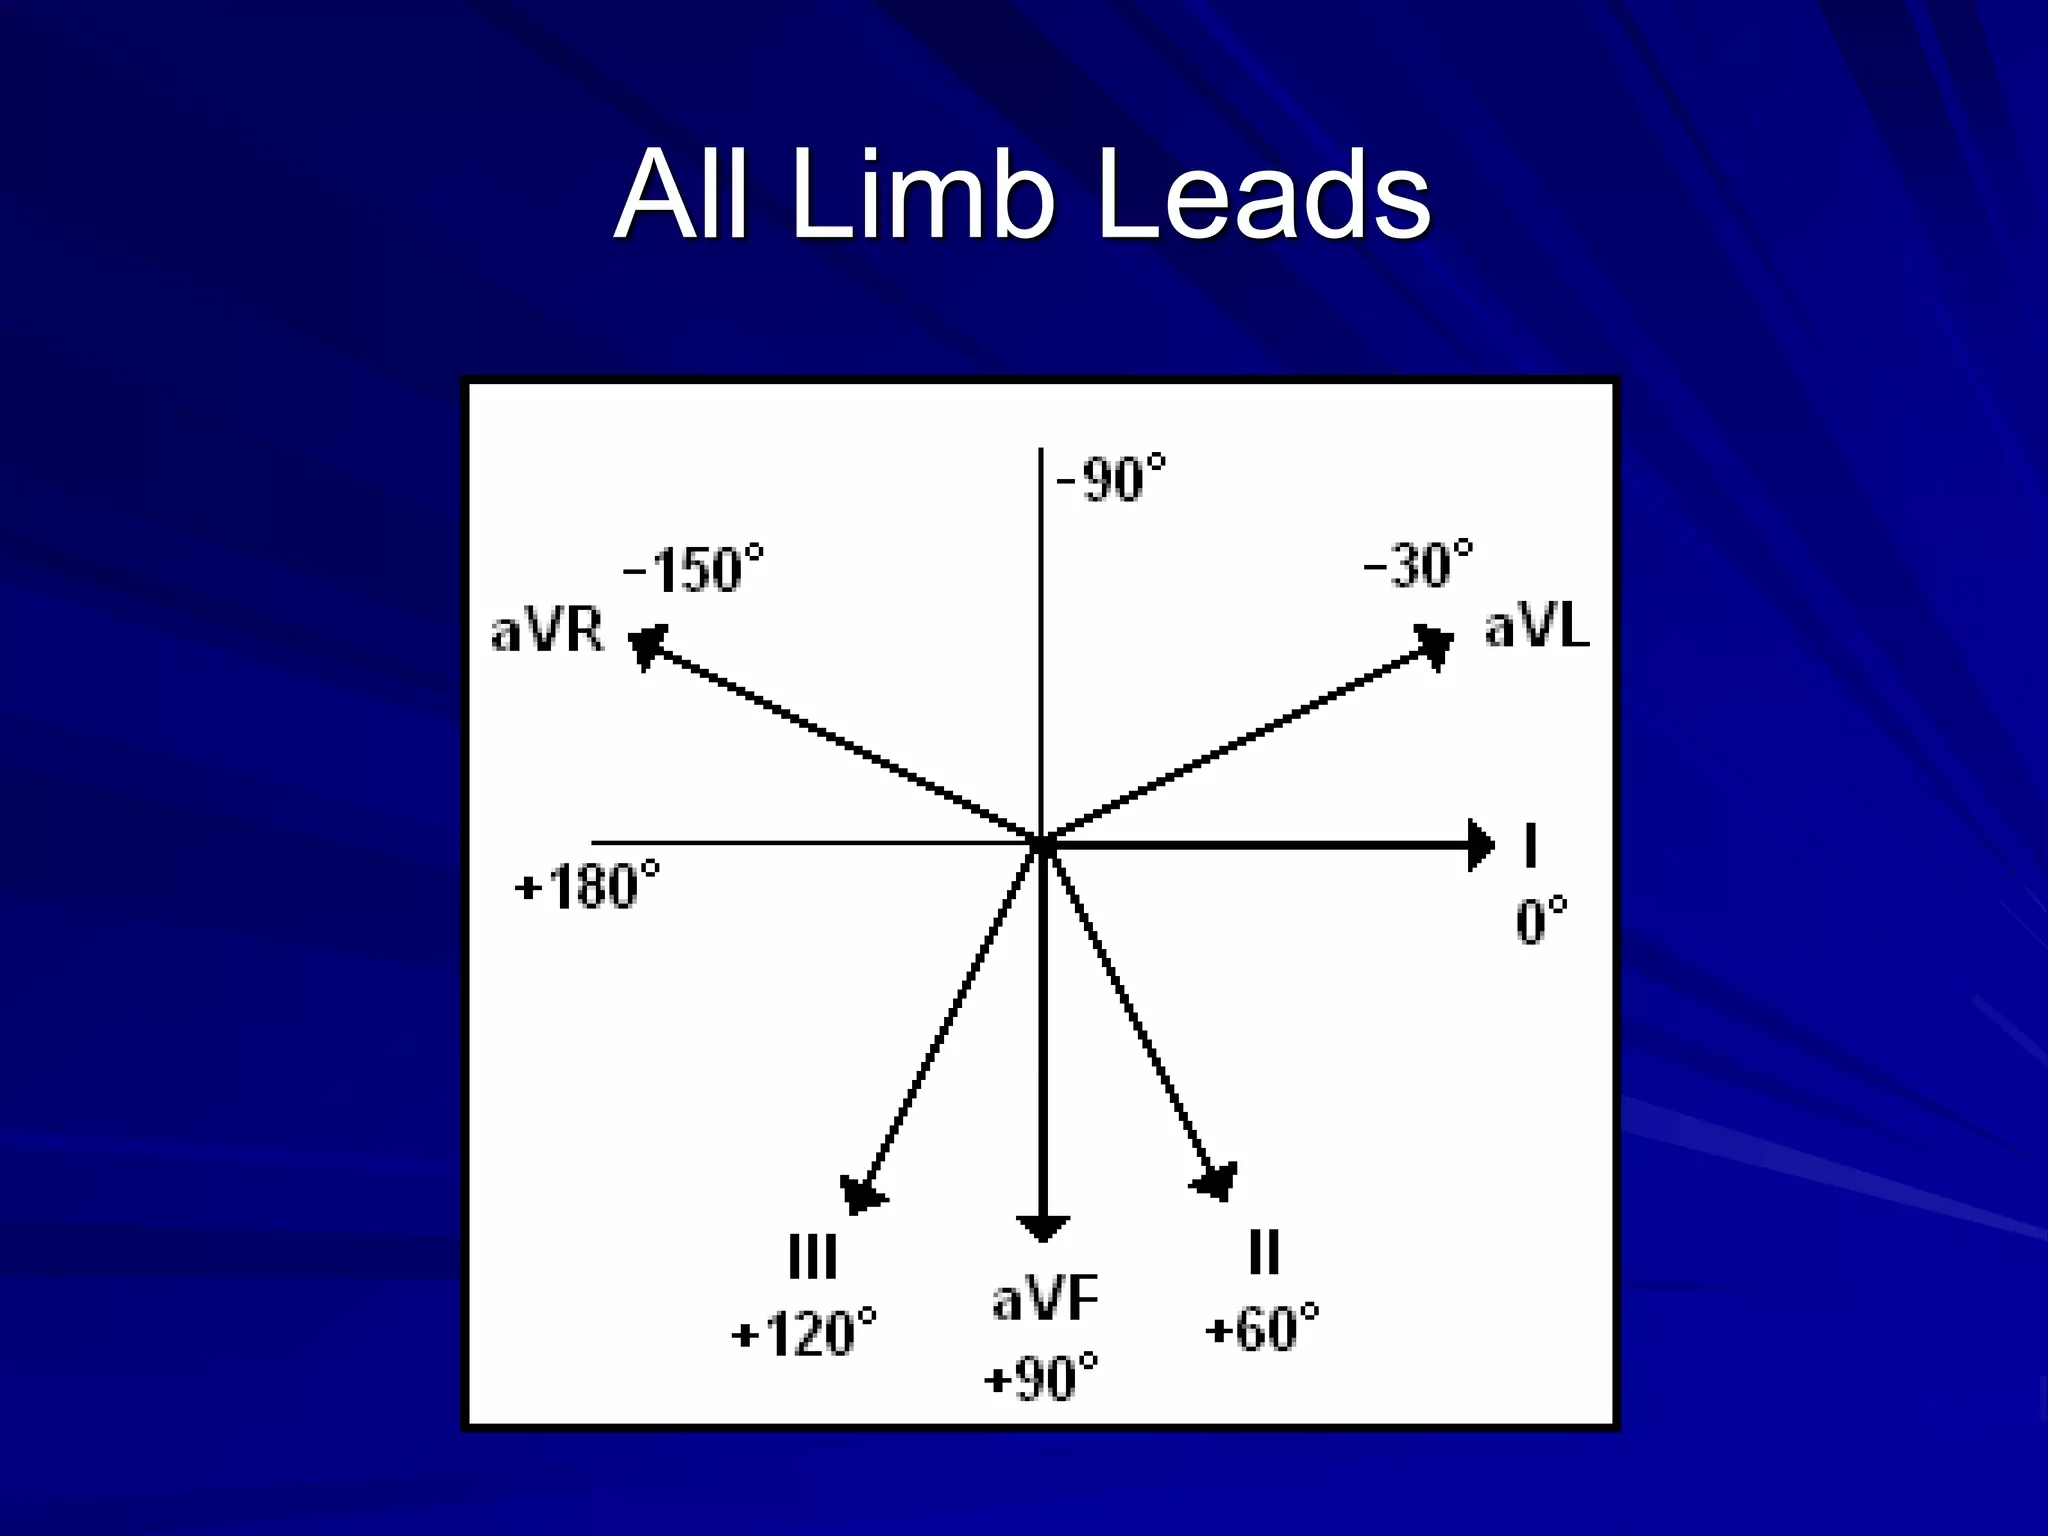
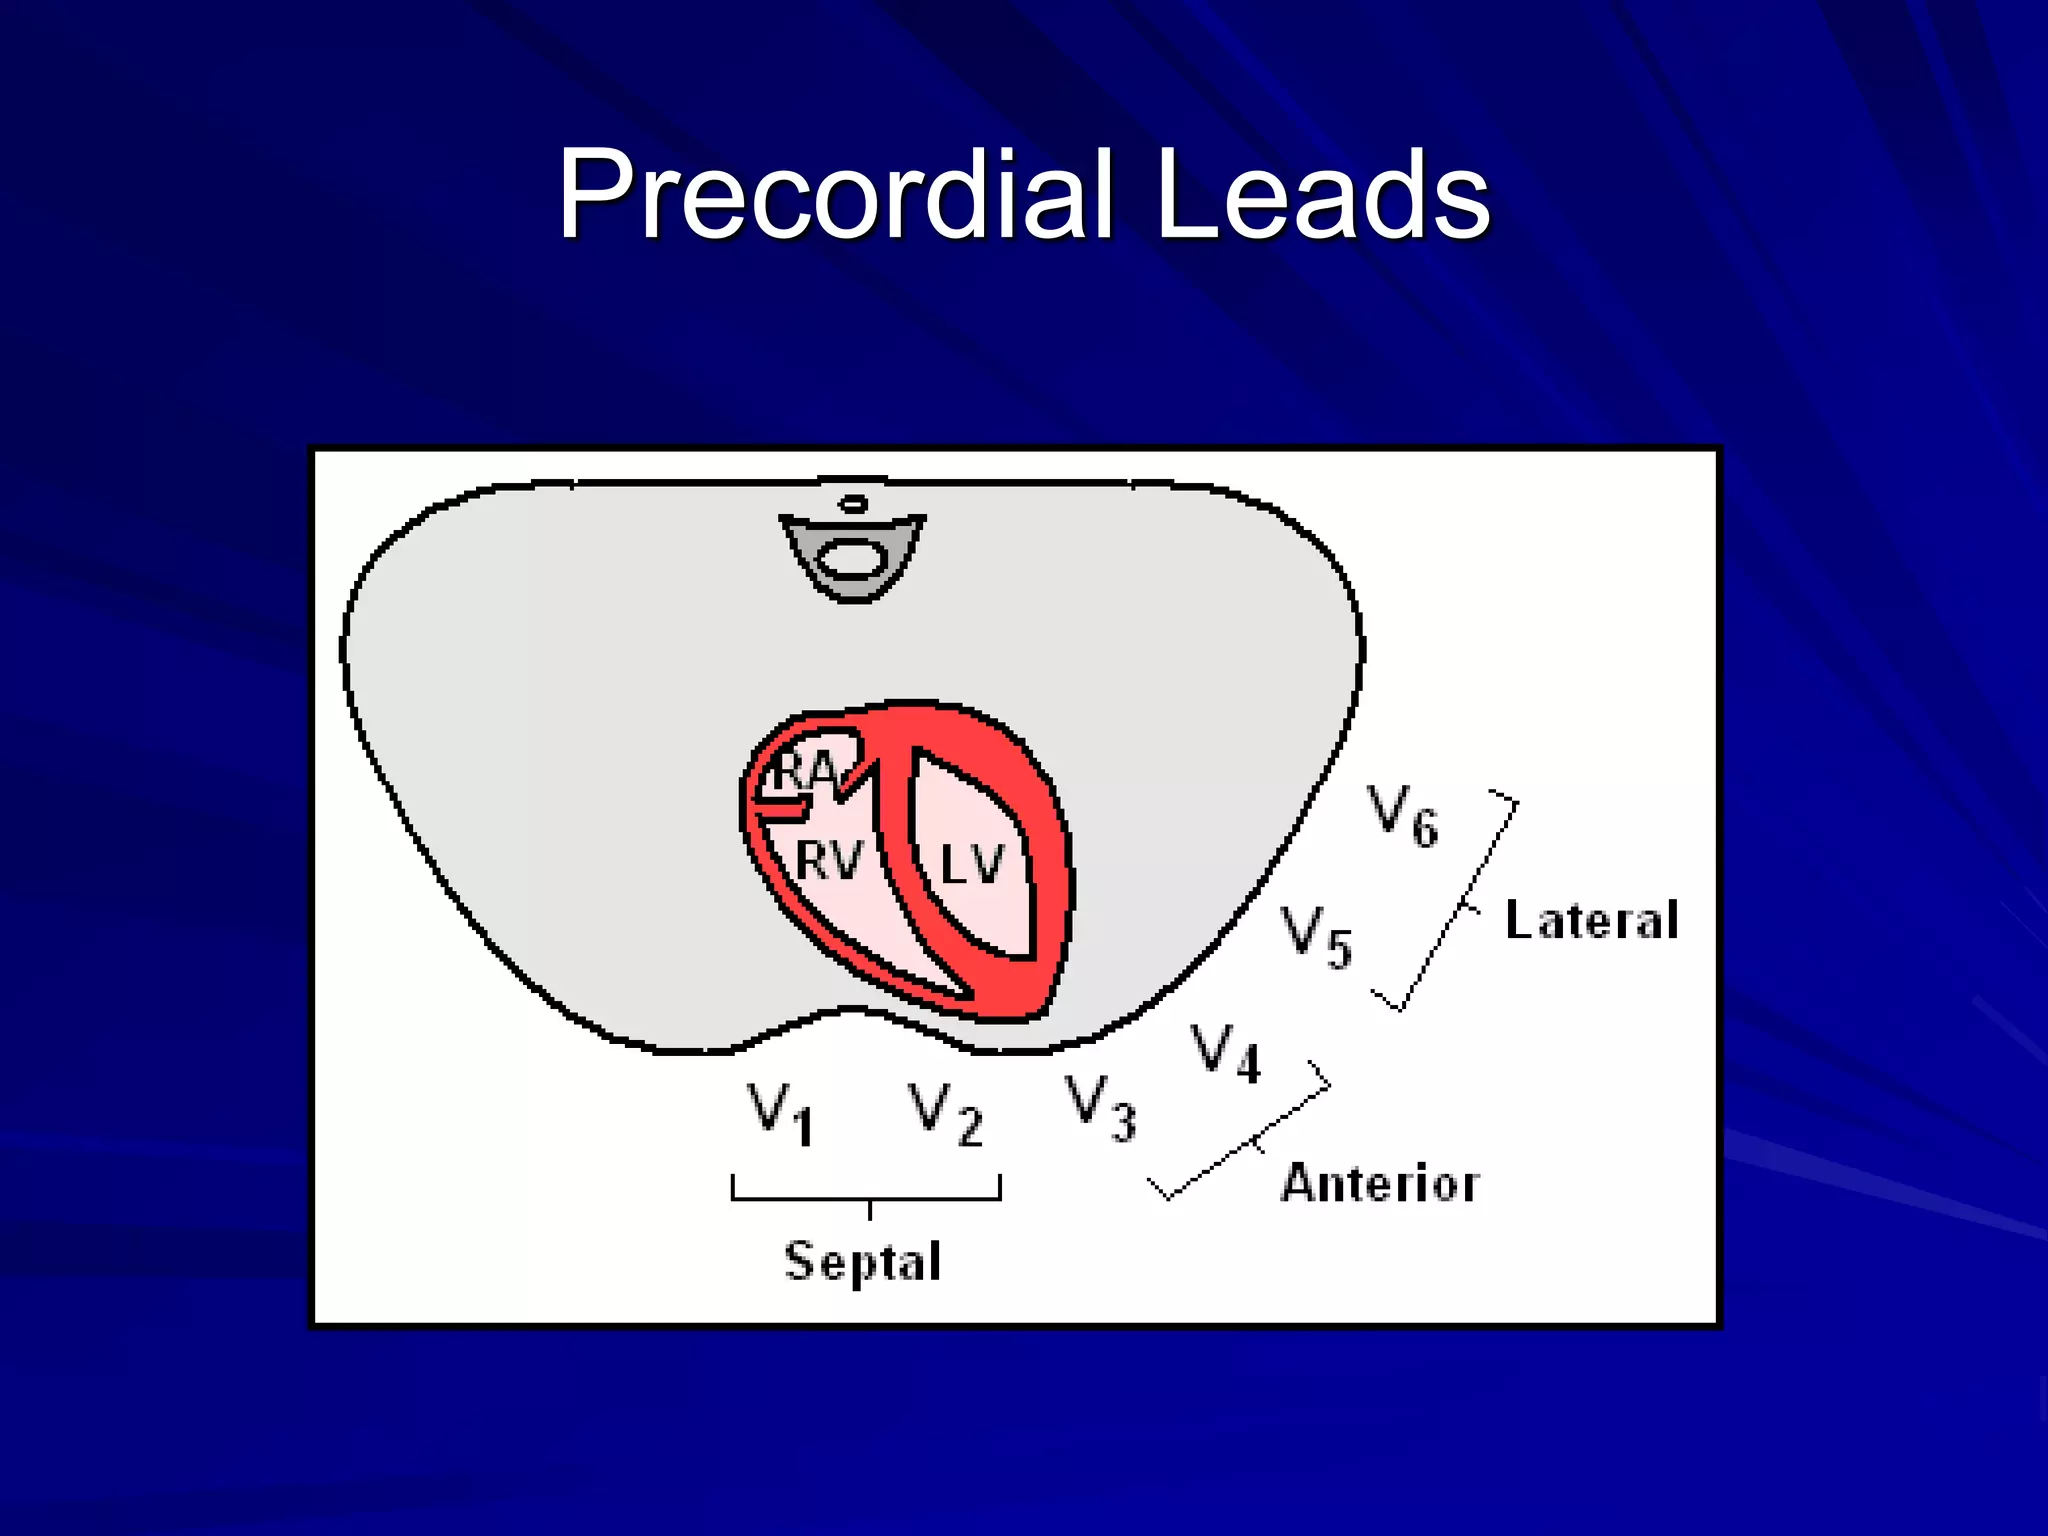
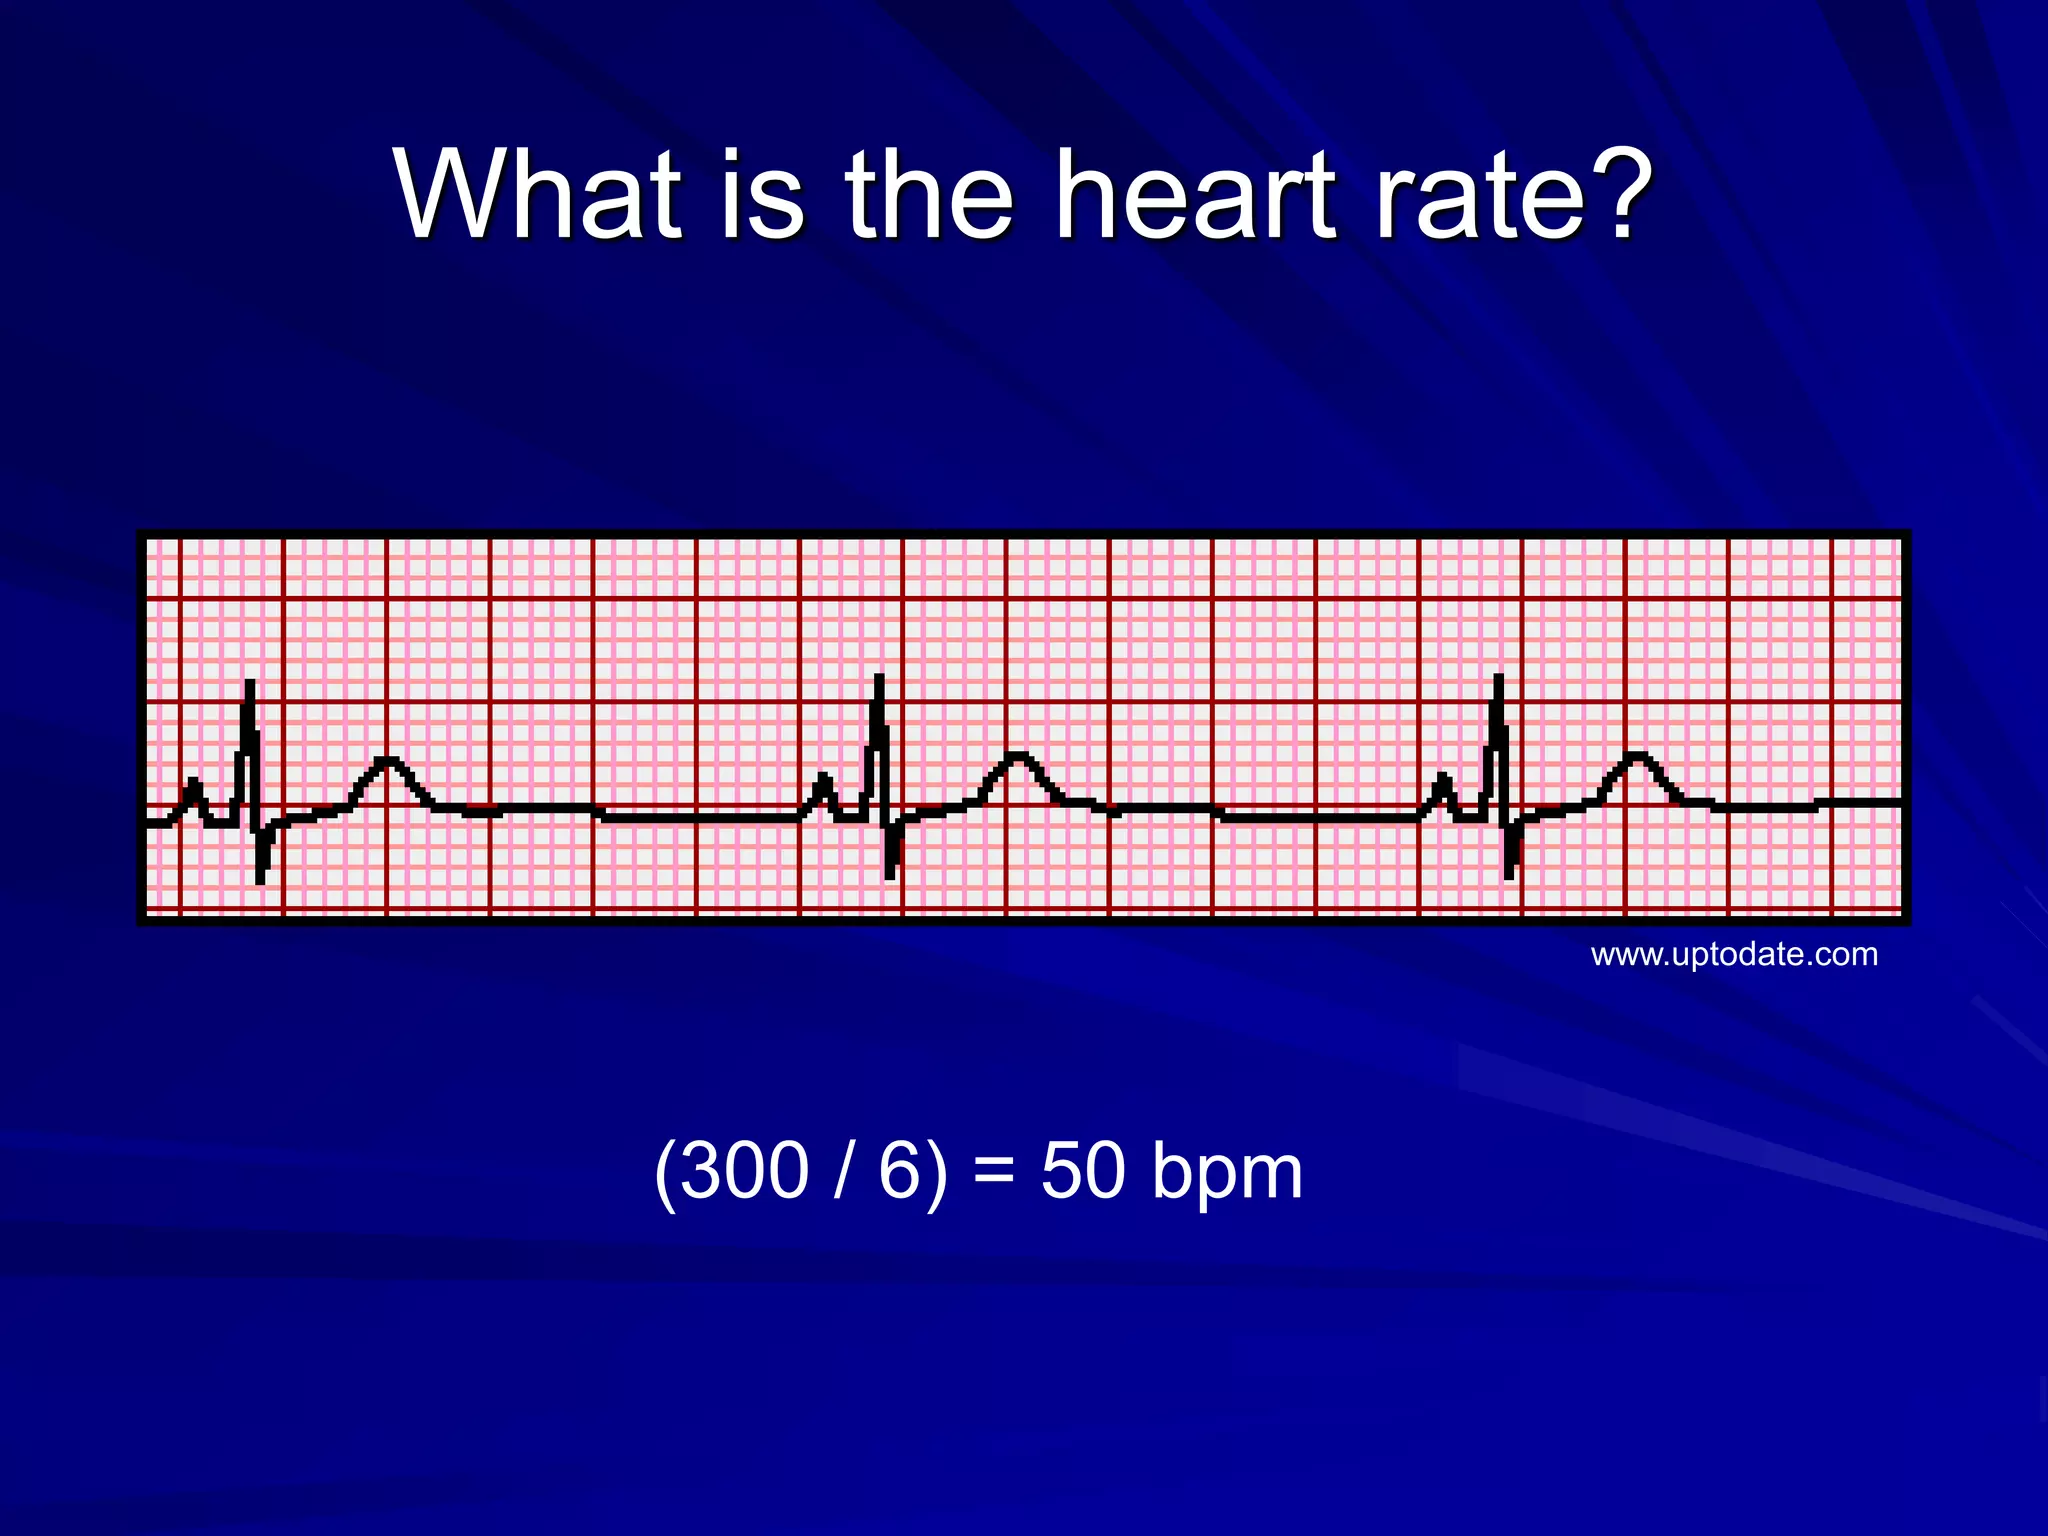
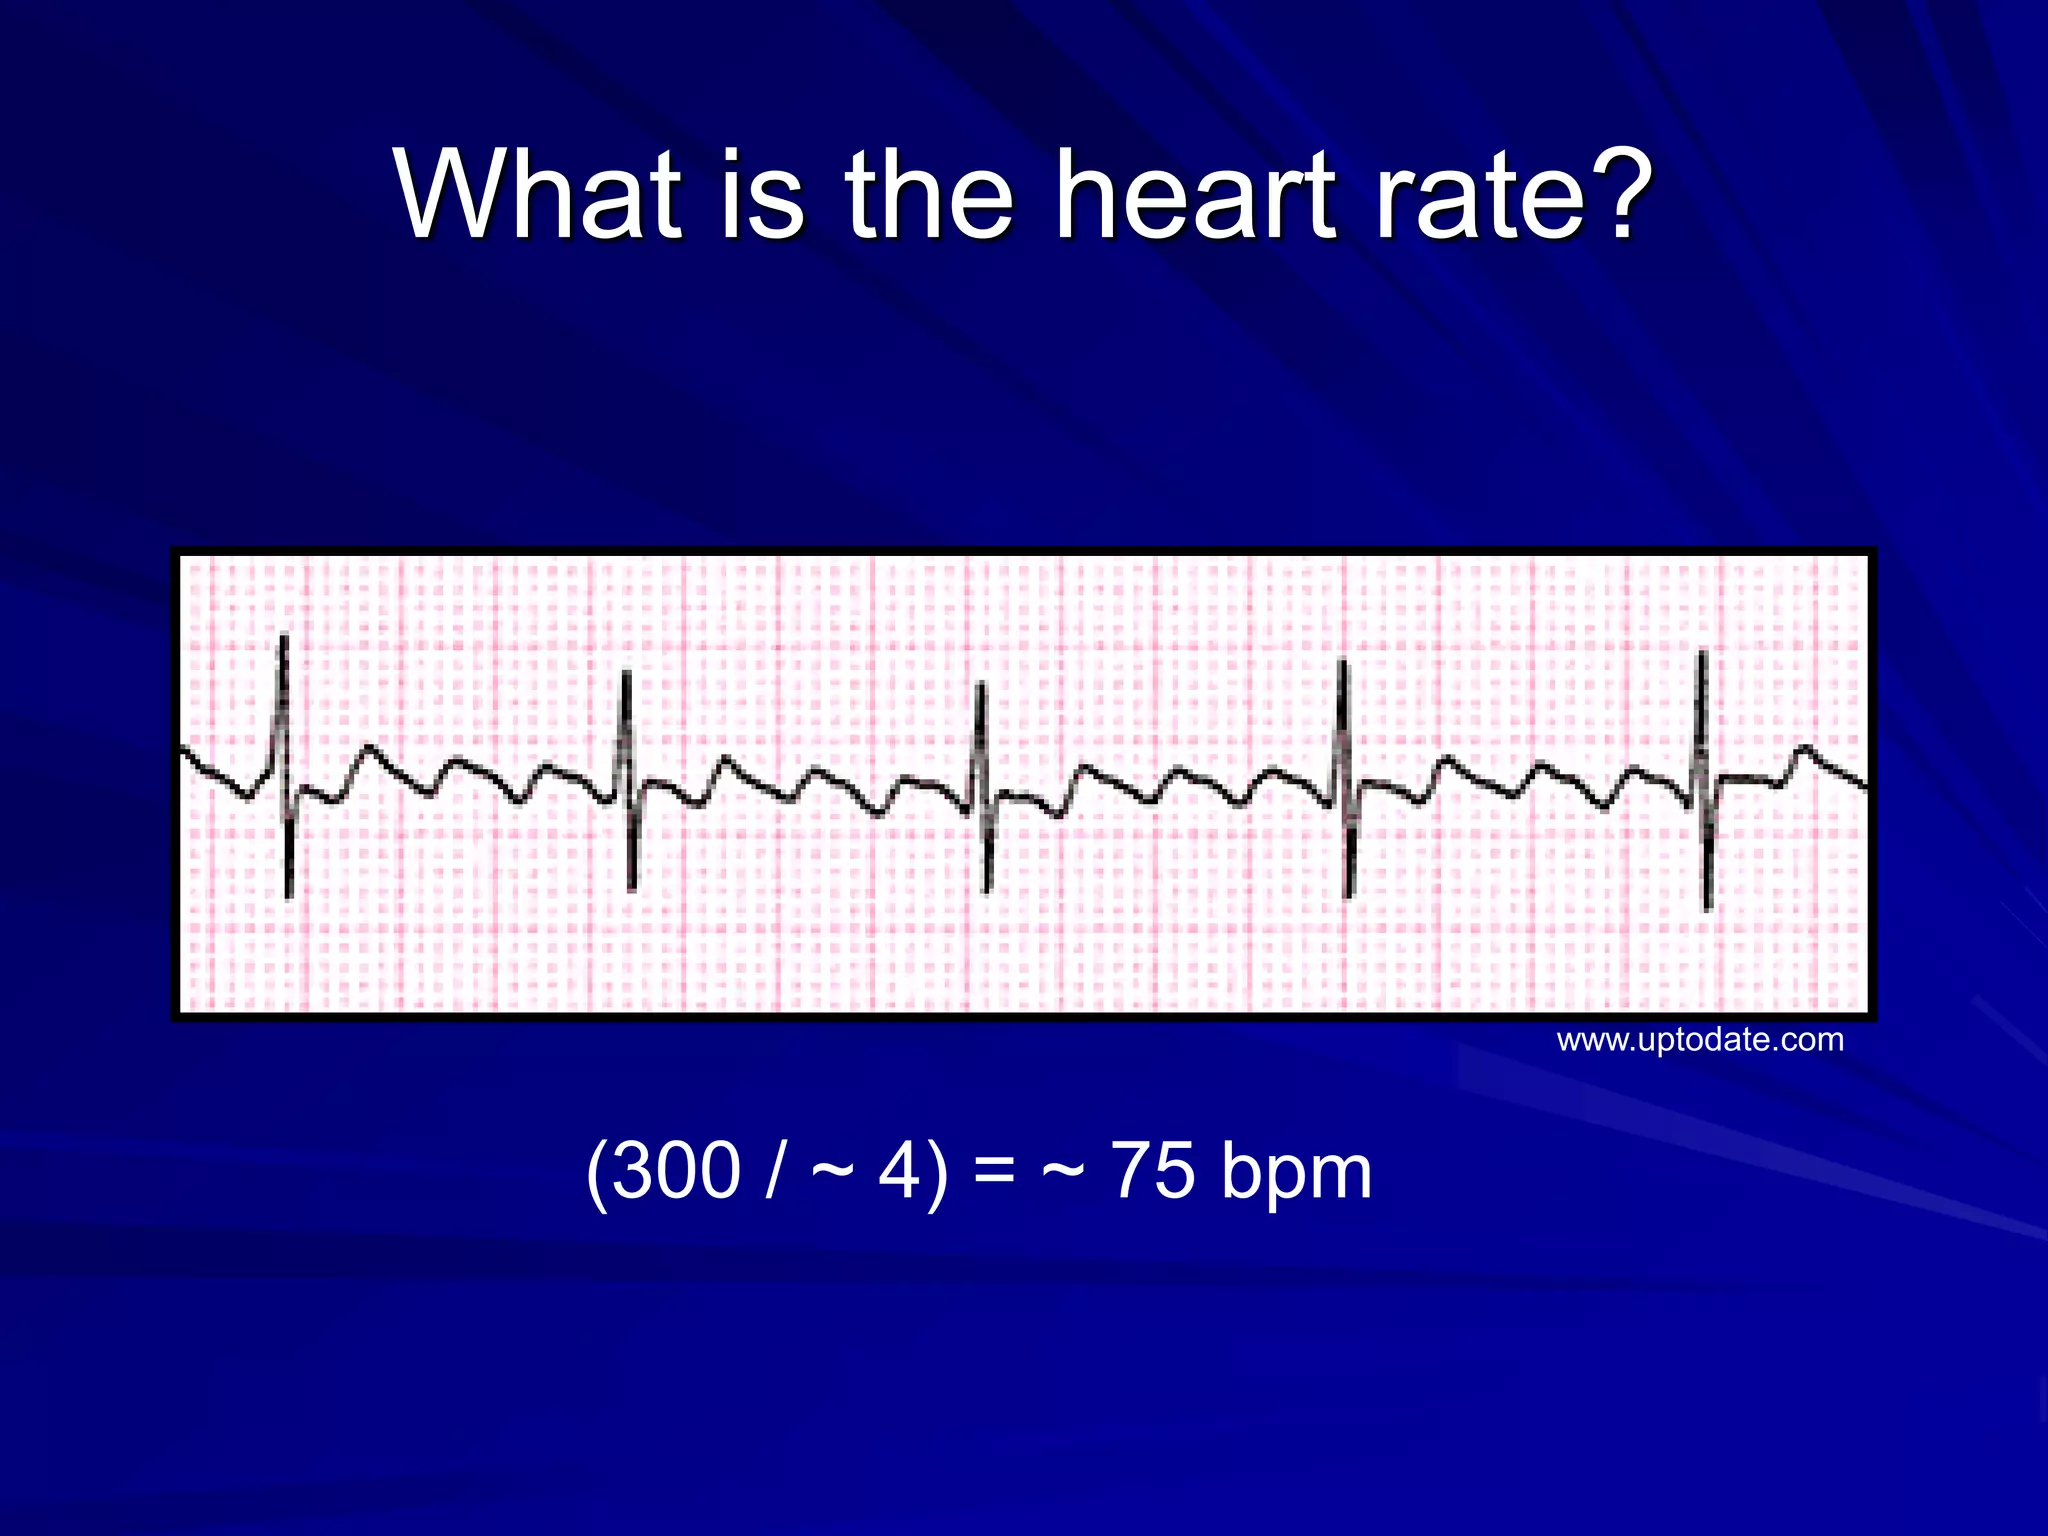
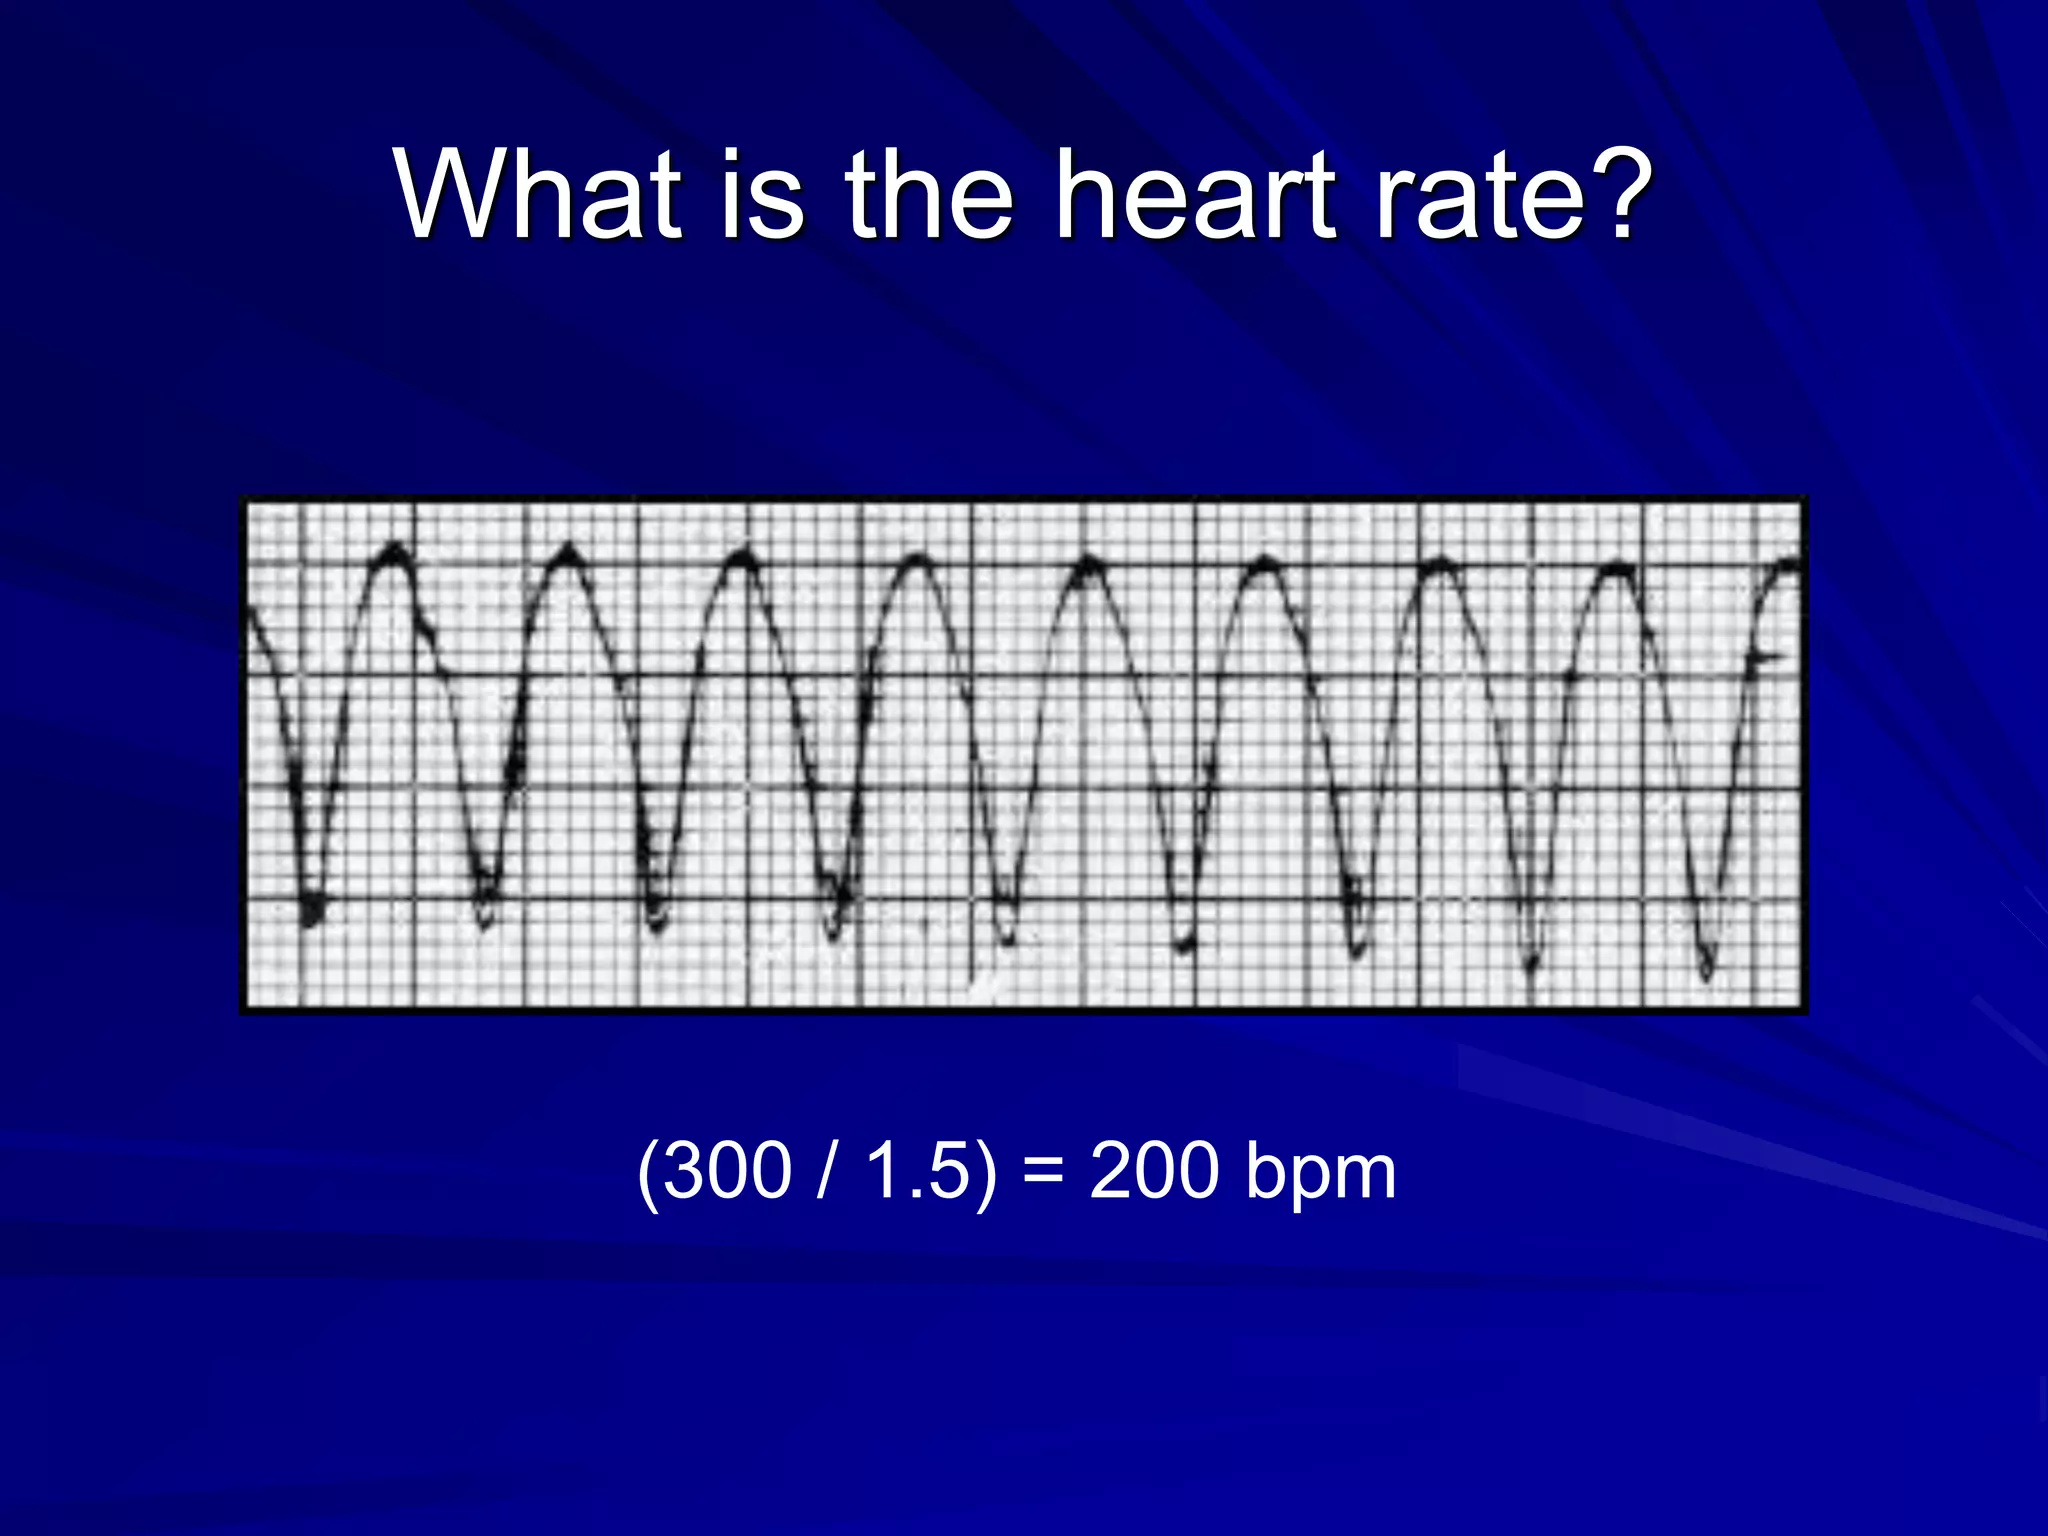
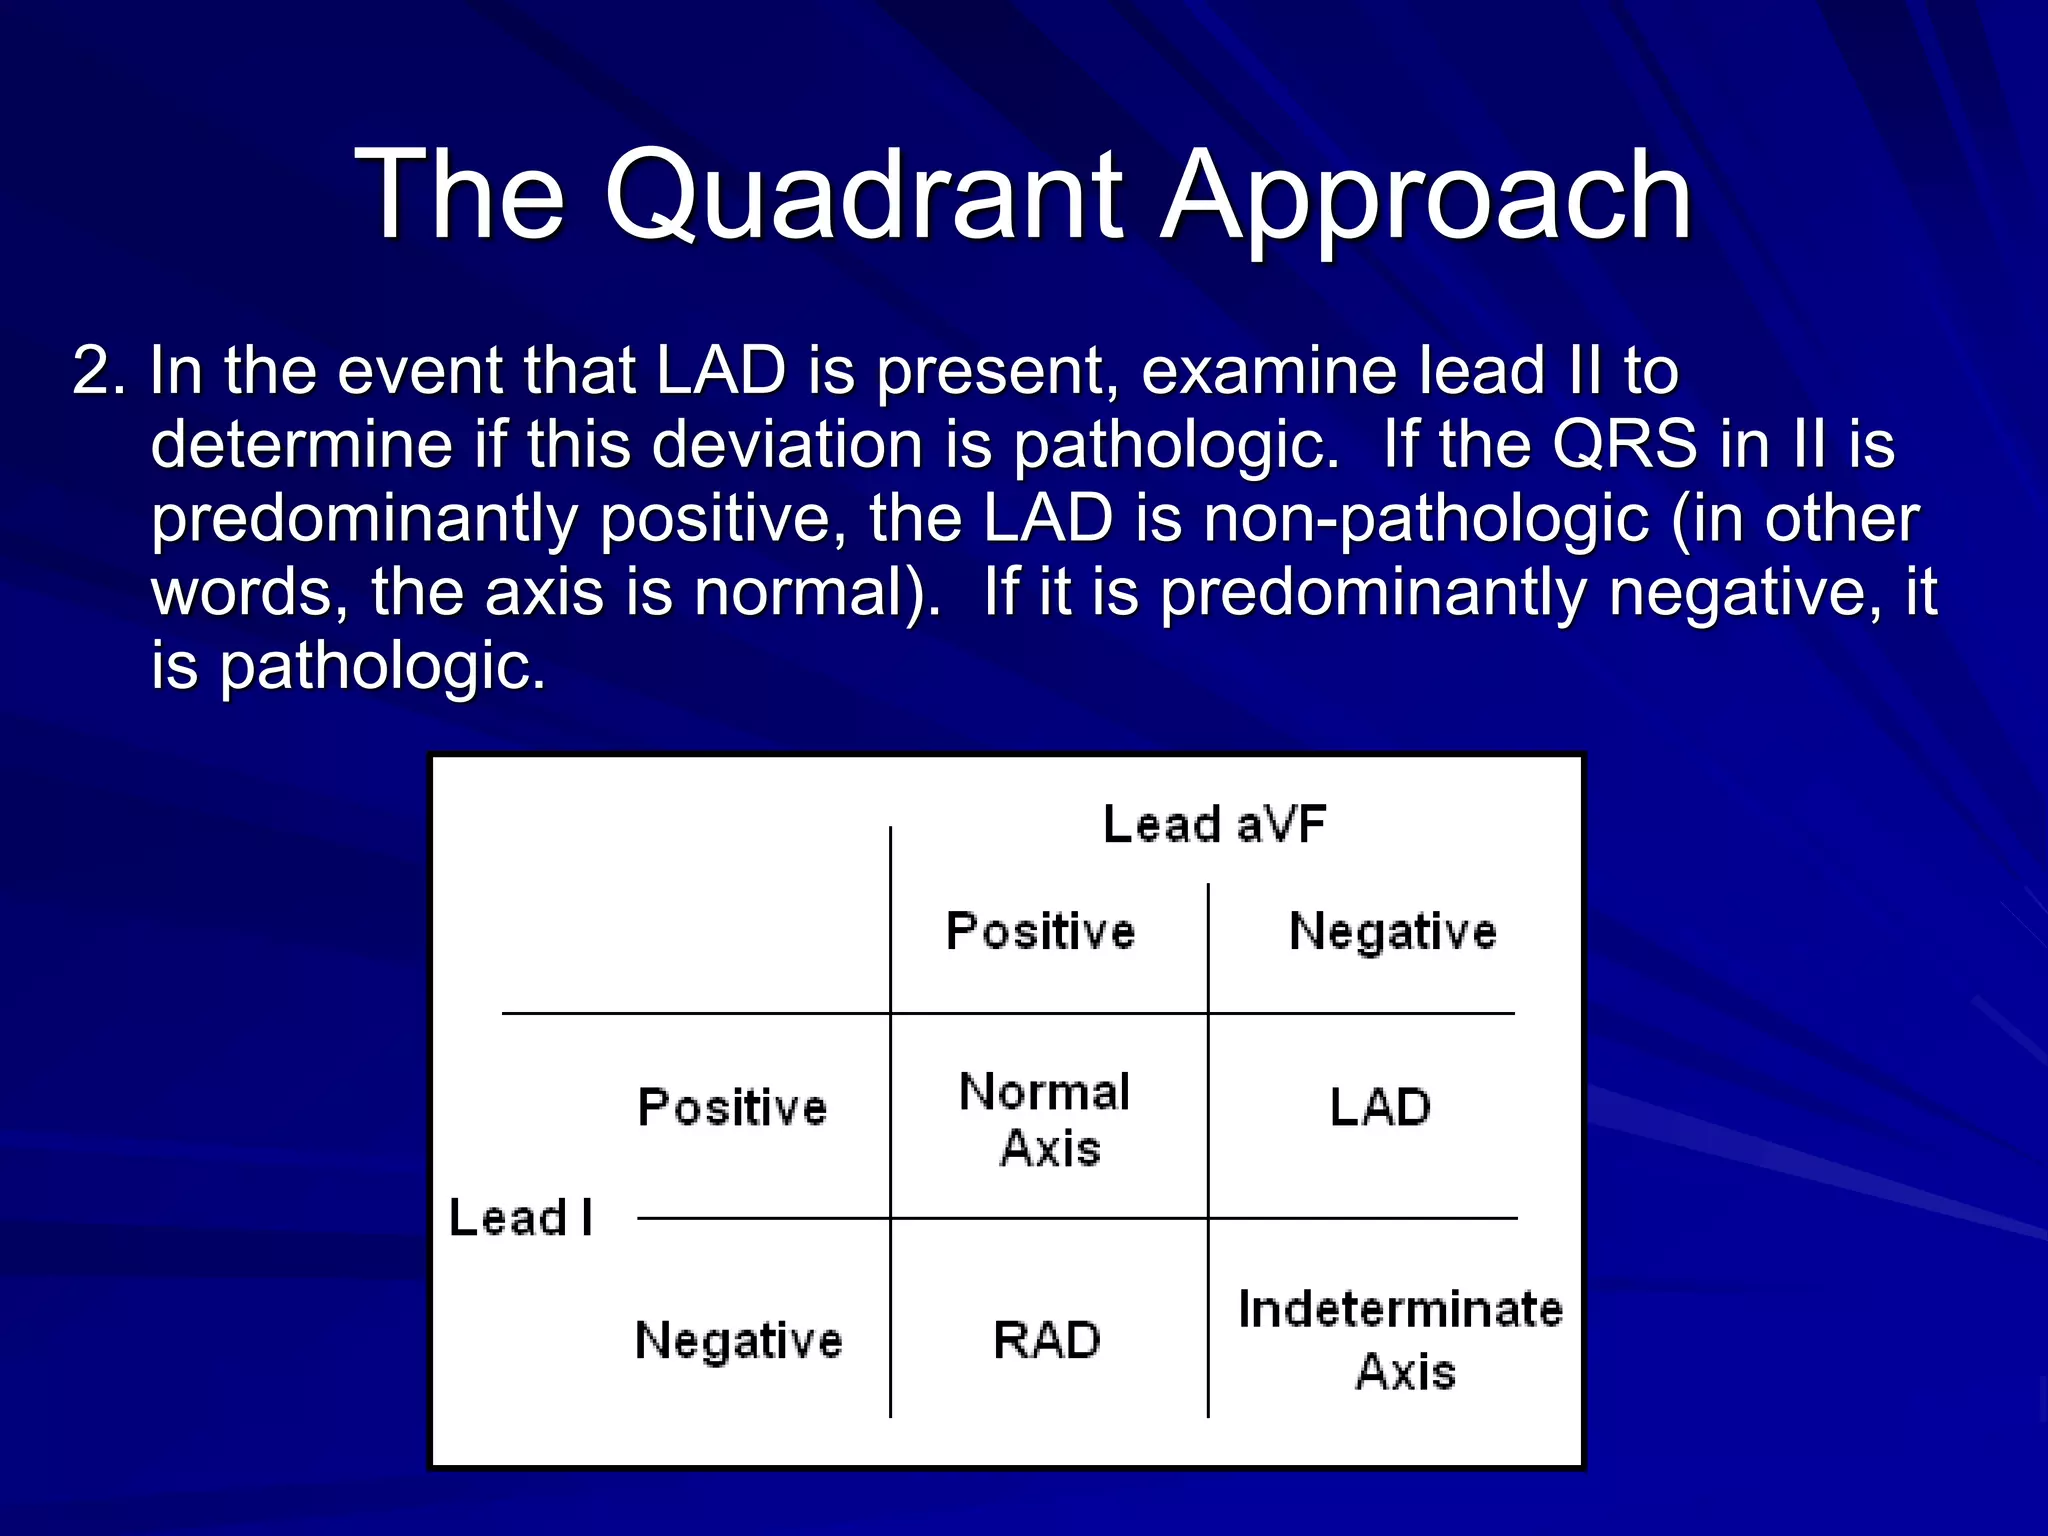
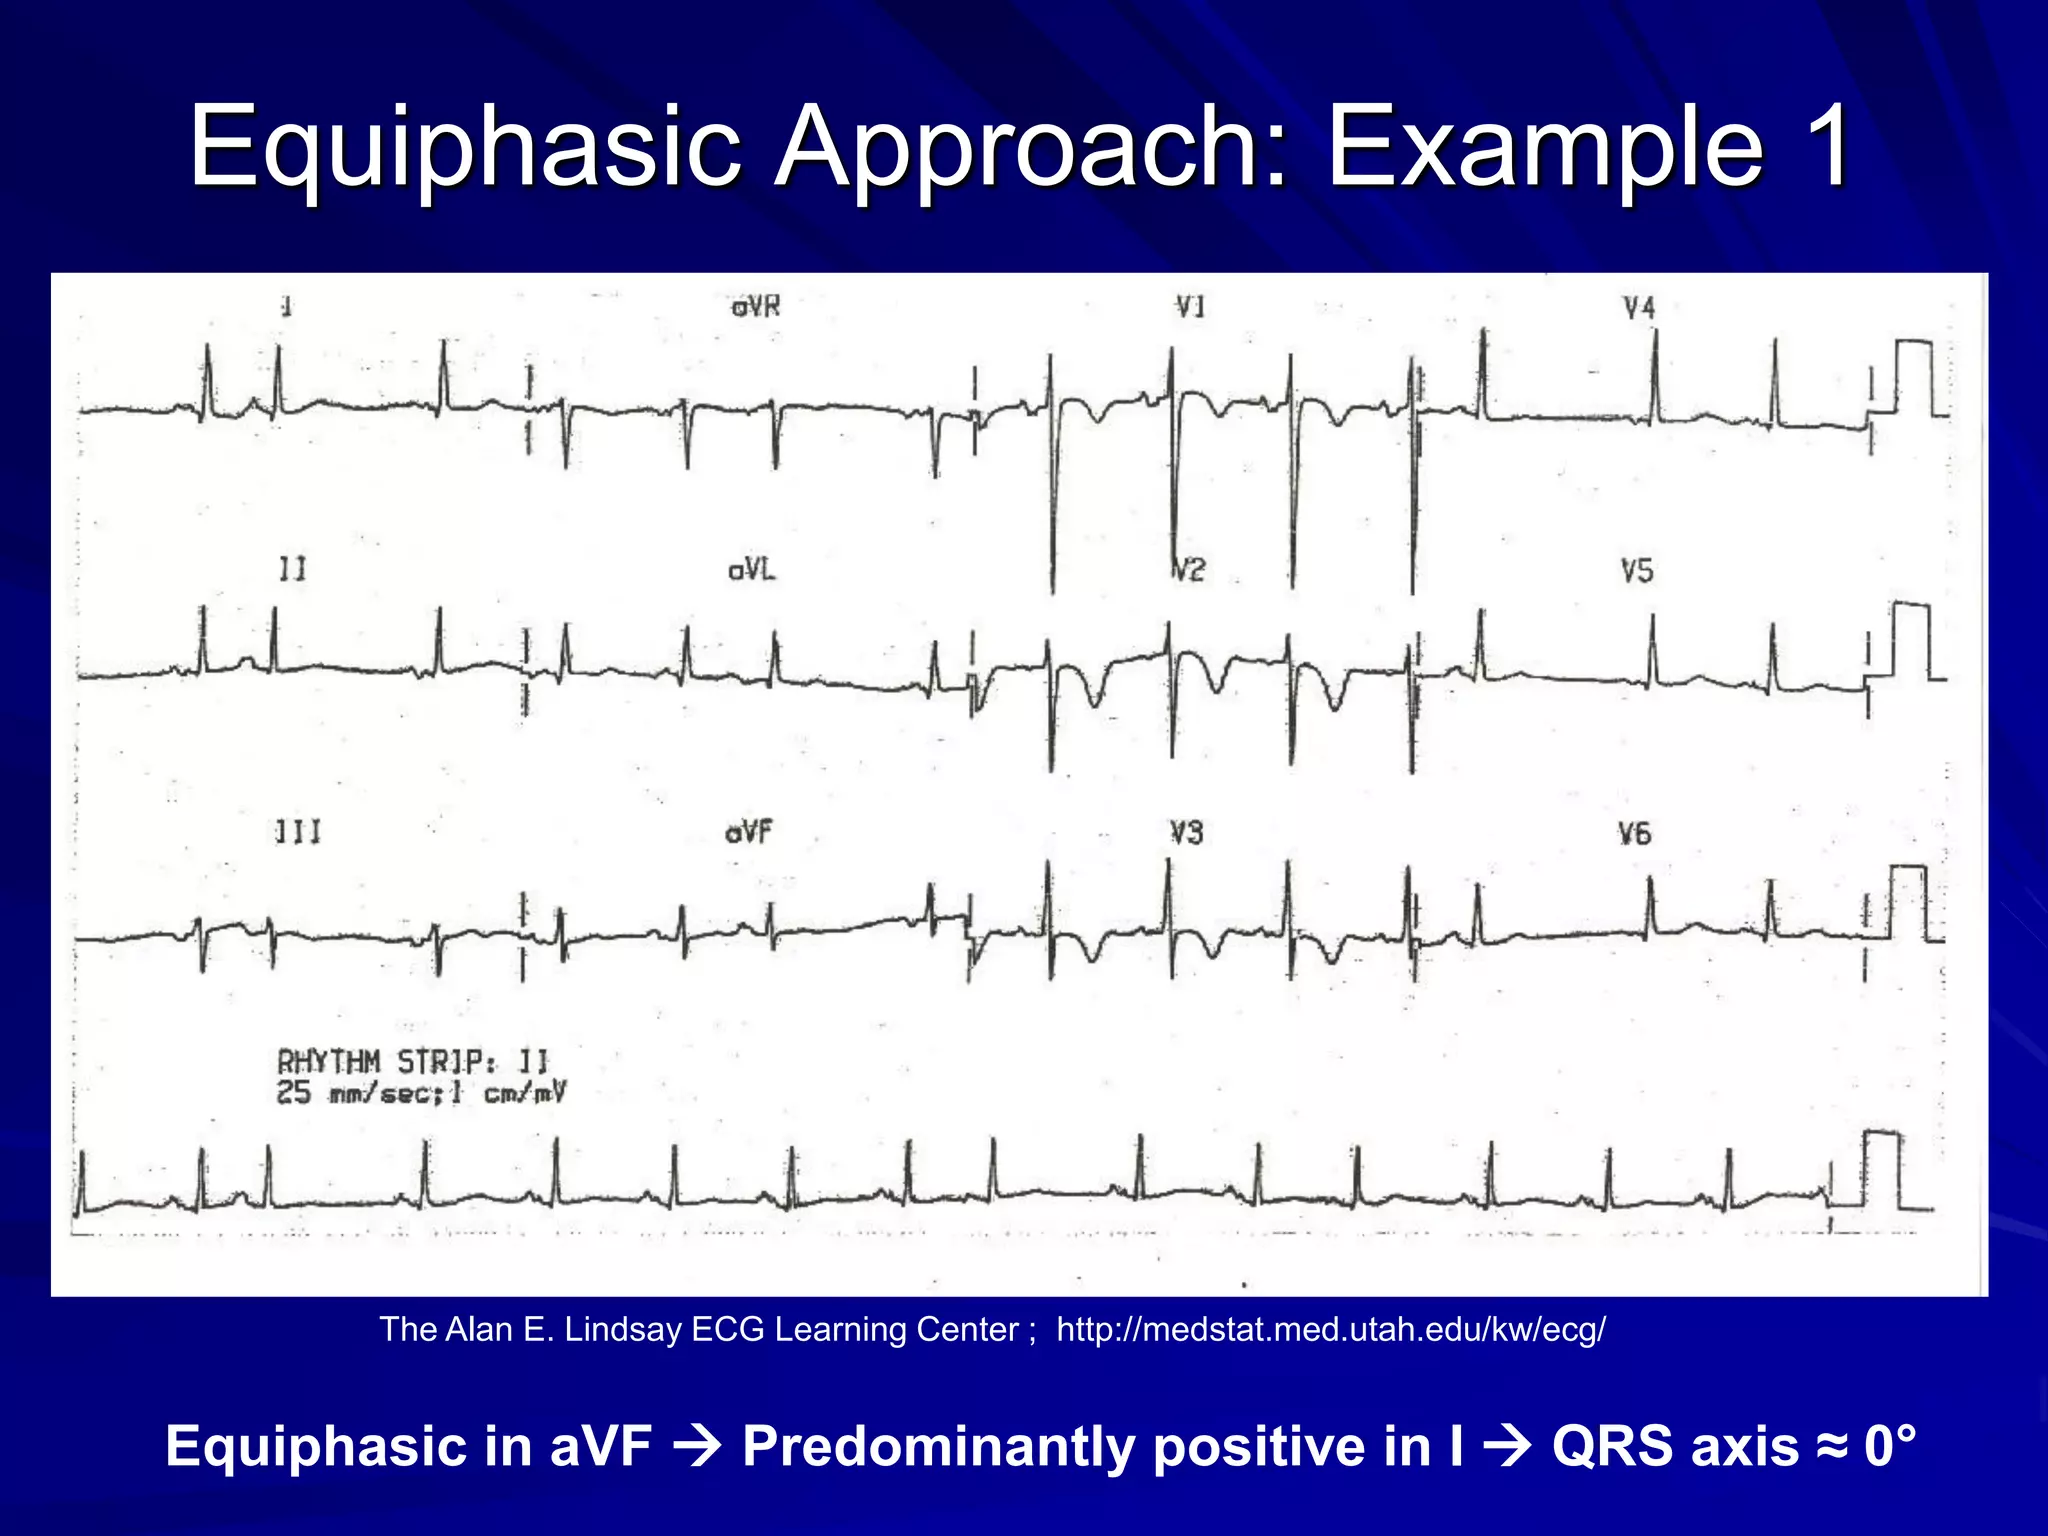
EKG Basics
Outline
1. Review of the conduction system
2. EKG waveforms and intervals
3. EKG leads
4. Determining heart rate
5. Determining QRS axis
The Normal Conduction System
What is an EKG?
The electrocardiogram (EKG) is a
representation of the electrical events of the
cardiac cycle.
Each event has a distinctive waveform, the
study of which can lead to greater insight
into a patient’s cardiac pathophysiology.
What types of pathology can we
identify and study from EKGs?
Arrhythmias
Myocardial ischemia and infarction
Pericarditis
Chamber hypertrophy
Electrolyte disturbances (i.e.
hyperkalemia, hypokalemia)
Drug toxicity (i.e. digoxin and drugs which
prolong the QT interval)
Waveforms and Intervals
EKG Leads
Leads are electrodes which measure the
difference in electrical potential between
either:
1. Two different points on the body (bipolar leads)
2. One point on the body and a virtual reference point
with zero electrical potential, located in the center of
the heart (unipolar leads)
EKG Leads
The standard EKG has 12 leads: 3 Standard Limb Leads
3 Augmented Limb Leads
6 Precordial Leads
The axis of a particular lead represents the viewpoint from
which it looks at the heart.
Standard Limb Leads
Standard Limb Leads
Augmented Limb Leads
All Limb Leads
Precordial Leads
Adapted from: www.numed.co.uk/electrodepl.html
Precordial Leads
Summary of Leads
Limb Leads Precordial Leads
Bipolar I, II, III
(standard limb leads)
-
Unipolar aVR, aVL, aVF
(augmented limb leads)
V1-V6
Arrangement of Leads on the EKG
Anatomic Groups
(Septum)
Anatomic Groups
(Anterior Wall)
Anatomic Groups
(Lateral Wall)
Anatomic Groups
(Inferior Wall)
Anatomic Groups
(Summary)
Determining the Heart Rate
Rule of 300
10 Second Rule
Rule of 300
Take the number of “big boxes” between
neighboring QRS complexes, and divide this
into 300. The result will be approximately
equal to the rate
Although fast, this method only works for
regular rhythms.
What is the heart rate?
(300 / 6) = 50 bpm
www.uptodate.com
What is the heart rate?
(300 / ~ 4) = ~ 75 bpm
www.uptodate.com
What is the heart rate?
(300 / 1.5) = 200 bpm
The Rule of 300
It may be easiest to memorize the following table:
# of big
boxes
Rate
1 300
2 150
3 100
4 75
5 60
6 50
10 Second Rule
As most EKGs record 10 seconds of rhythm per
page, one can simply count the number of beats
present on the EKG and multiply by 6 to get the
number of beats per 60 seconds.
This method works well for irregular rhythms.
What is the heart rate?
33 x 6 = 198 bpm
The Alan E. Lindsay ECG Learning Center ; http://medstat.med.utah.edu/kw/ecg/
The QRS Axis
The QRS axis represents the net overall
direction of the heart’s electrical activity.
Abnormalities of axis can hint at:
Ventricular enlargement
Conduction blocks (i.e. hemiblocks)
The QRS Axis
By near-consensus, the
normal QRS axis is defined
as ranging from -30° to +90°.
-30° to -90° is referred to as a
left axis deviation (LAD)
+90° to +180° is referred to as
a right axis deviation (RAD)
Determining the Axis
The Quadrant Approach
The Equiphasic Approach
Determining the Axis
Predominantly
Positive
Predominantly
Negative
Equiphasic
The Quadrant Approach
1. Examine the QRS complex in leads I and aVF to determine
if they are predominantly positive or predominantly
negative. The combination should place the axis into one
of the 4 quadrants below.
The Quadrant Approach
2. In the event that LAD is present, examine lead II to
determine if this deviation is pathologic. If the QRS in II is
predominantly positive, the LAD is non-pathologic (in other
words, the axis is normal). If it is predominantly negative, it
is pathologic.
Quadrant Approach: Example 1
Negative in I, positive in aVF → RAD
The Alan E. Lindsay
ECG Learning Center
http://medstat.med.utah.
edu/kw/ecg/
Quadrant Approach: Example 2
Positive in I, negative in aVF → Predominantly positive in II →
Normal Axis (non-pathologic LAD)
The Alan E. Lindsay
ECG Learning Center
http://medstat.med.utah.
edu/kw/ecg/
The Equiphasic Approach
1. Determine which lead contains the most equiphasic QRS
complex. The fact that the QRS complex in this lead is
equally positive and negative indicates that the net
electrical vector (i.e. overall QRS axis) is perpendicular
to the axis of this particular lead.
2. Examine the QRS complex in whichever lead lies 90°
away from the lead identified in step 1. If the QRS
complex in this second lead is predominantly positive,
than the axis of this lead is approximately the same as
the net QRS axis. If the QRS complex is predominantly
negative, than the net QRS axis lies 180° from the axis
of this lead.
Equiphasic Approach: Example 1
Equiphasic in aVF → Predominantly positive in I → QRS axis ≈ 0°
The Alan E. Lindsay ECG Learning Center ; http://medstat.med.utah.edu/kw/ecg/
Equiphasic Approach: Example 2
Equiphasic in II → Predominantly negative in aVL → QRS axis ≈ +150°
The Alan E. Lindsay ECG Learning Center ; http://medstat.med.utah.edu/kw/ecg/

EKG Basics - Long.pdf

  • 1.
  • 2.
    Outline 1. Review ofthe conduction system 2. EKG waveforms and intervals 3. EKG leads 4. Determining heart rate 5. Determining QRS axis
  • 3.
  • 4.
    What is anEKG? The electrocardiogram (EKG) is a representation of the electrical events of the cardiac cycle. Each event has a distinctive waveform, the study of which can lead to greater insight into a patient’s cardiac pathophysiology.
  • 5.
    What types ofpathology can we identify and study from EKGs? Arrhythmias Myocardial ischemia and infarction Pericarditis Chamber hypertrophy Electrolyte disturbances (i.e. hyperkalemia, hypokalemia) Drug toxicity (i.e. digoxin and drugs which prolong the QT interval)
  • 6.
  • 7.
    EKG Leads Leads areelectrodes which measure the difference in electrical potential between either: 1. Two different points on the body (bipolar leads) 2. One point on the body and a virtual reference point with zero electrical potential, located in the center of the heart (unipolar leads)
  • 8.
    EKG Leads The standardEKG has 12 leads: 3 Standard Limb Leads 3 Augmented Limb Leads 6 Precordial Leads The axis of a particular lead represents the viewpoint from which it looks at the heart.
  • 9.
  • 10.
  • 11.
  • 12.
  • 13.
    Precordial Leads Adapted from:www.numed.co.uk/electrodepl.html
  • 14.
  • 15.
    Summary of Leads LimbLeads Precordial Leads Bipolar I, II, III (standard limb leads) - Unipolar aVR, aVL, aVF (augmented limb leads) V1-V6
  • 16.
  • 17.
  • 18.
  • 19.
  • 20.
  • 21.
  • 22.
    Determining the HeartRate Rule of 300 10 Second Rule
  • 23.
    Rule of 300 Takethe number of “big boxes” between neighboring QRS complexes, and divide this into 300. The result will be approximately equal to the rate Although fast, this method only works for regular rhythms.
  • 24.
    What is theheart rate? (300 / 6) = 50 bpm www.uptodate.com
  • 25.
    What is theheart rate? (300 / ~ 4) = ~ 75 bpm www.uptodate.com
  • 26.
    What is theheart rate? (300 / 1.5) = 200 bpm
  • 27.
    The Rule of300 It may be easiest to memorize the following table: # of big boxes Rate 1 300 2 150 3 100 4 75 5 60 6 50
  • 28.
    10 Second Rule Asmost EKGs record 10 seconds of rhythm per page, one can simply count the number of beats present on the EKG and multiply by 6 to get the number of beats per 60 seconds. This method works well for irregular rhythms.
  • 29.
    What is theheart rate? 33 x 6 = 198 bpm The Alan E. Lindsay ECG Learning Center ; http://medstat.med.utah.edu/kw/ecg/
  • 30.
    The QRS Axis TheQRS axis represents the net overall direction of the heart’s electrical activity. Abnormalities of axis can hint at: Ventricular enlargement Conduction blocks (i.e. hemiblocks)
  • 31.
    The QRS Axis Bynear-consensus, the normal QRS axis is defined as ranging from -30° to +90°. -30° to -90° is referred to as a left axis deviation (LAD) +90° to +180° is referred to as a right axis deviation (RAD)
  • 32.
    Determining the Axis TheQuadrant Approach The Equiphasic Approach
  • 33.
  • 34.
    The Quadrant Approach 1.Examine the QRS complex in leads I and aVF to determine if they are predominantly positive or predominantly negative. The combination should place the axis into one of the 4 quadrants below.
  • 35.
    The Quadrant Approach 2.In the event that LAD is present, examine lead II to determine if this deviation is pathologic. If the QRS in II is predominantly positive, the LAD is non-pathologic (in other words, the axis is normal). If it is predominantly negative, it is pathologic.
  • 36.
    Quadrant Approach: Example1 Negative in I, positive in aVF → RAD The Alan E. Lindsay ECG Learning Center http://medstat.med.utah. edu/kw/ecg/
  • 37.
    Quadrant Approach: Example2 Positive in I, negative in aVF → Predominantly positive in II → Normal Axis (non-pathologic LAD) The Alan E. Lindsay ECG Learning Center http://medstat.med.utah. edu/kw/ecg/
  • 38.
    The Equiphasic Approach 1.Determine which lead contains the most equiphasic QRS complex. The fact that the QRS complex in this lead is equally positive and negative indicates that the net electrical vector (i.e. overall QRS axis) is perpendicular to the axis of this particular lead. 2. Examine the QRS complex in whichever lead lies 90° away from the lead identified in step 1. If the QRS complex in this second lead is predominantly positive, than the axis of this lead is approximately the same as the net QRS axis. If the QRS complex is predominantly negative, than the net QRS axis lies 180° from the axis of this lead.
  • 39.
    Equiphasic Approach: Example1 Equiphasic in aVF → Predominantly positive in I → QRS axis ≈ 0° The Alan E. Lindsay ECG Learning Center ; http://medstat.med.utah.edu/kw/ecg/
  • 40.
    Equiphasic Approach: Example2 Equiphasic in II → Predominantly negative in aVL → QRS axis ≈ +150° The Alan E. Lindsay ECG Learning Center ; http://medstat.med.utah.edu/kw/ecg/