Download as PDF, PPTX

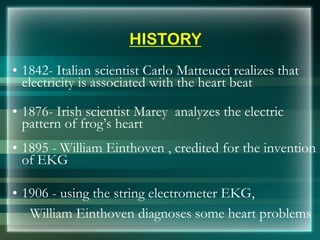
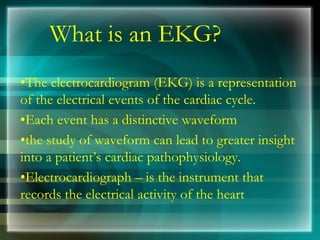
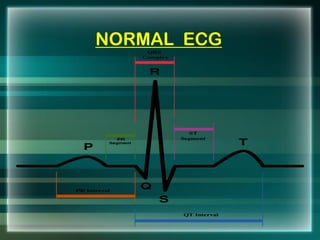
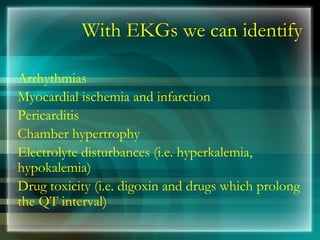
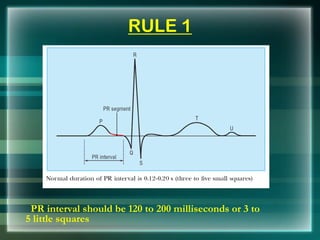
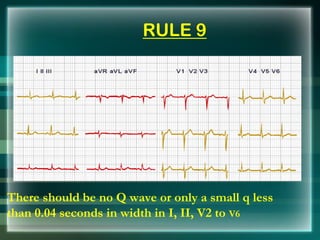
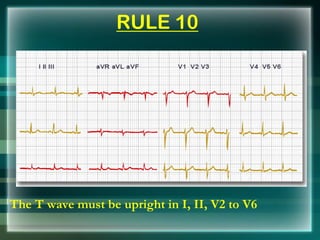
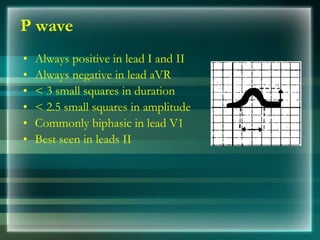
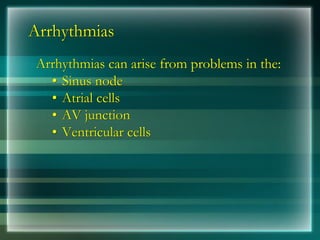
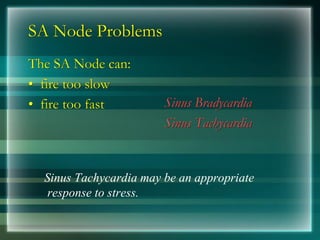


This document provides an overview of electrocardiography (ECG/EKG) including its history, components, and how to interpret common rhythms. Some key points: - ECG records electrical activity of the heart and was invented in the late 19th century. It helps diagnose arrhythmias, ischemia, infarction and other cardiac conditions. - The ECG tracing has components (P wave, PR interval, QRS complex, ST segment, T wave) that reflect different stages of the cardiac cycle. - Common arrhythmias arise from problems in the sinus node, atria, AV node or ventricles. These include sinus bradycardia, sinus tachycardia, premature


![CASE_PRESENTATION_ON_subdural_hematoma(SDH)[1 FINAL PPT]-1.pptx](https://cdn.slidesharecdn.com/ss_thumbnails/casepresentationonsubduralhematomasdh1finalppt-1-260129172522-d405d375-thumbnail.jpg?width=640&height=640&fit=bounds)


