Downloaded 169 times
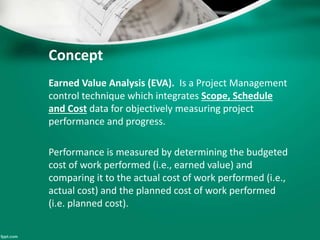
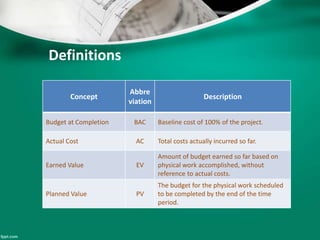
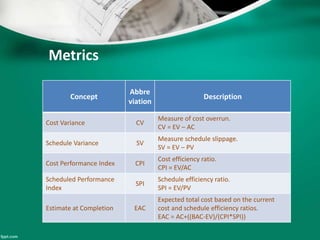
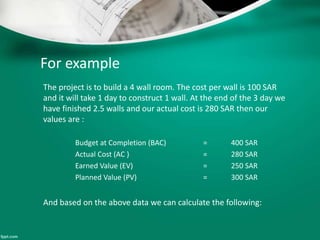
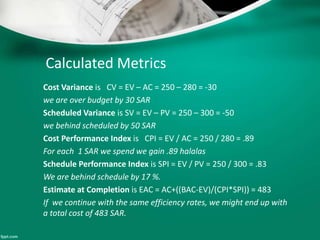

This document introduces earned value analysis (EVA), a project management technique that integrates scope, schedule, and cost to measure performance. It defines key EVA terms like budgeted cost of work performed, actual cost, earned value, and planned value. Metrics like cost variance, schedule variance, cost performance index, and estimate at completion are also explained. An example project is used to demonstrate how to calculate these metrics. The document proposes implementing EVA for ATCO projects by developing a module in their EIS system to track EVA parameters and metrics on a monthly basis. A plan is outlined to get feedback, train users, and start the new EVA process.