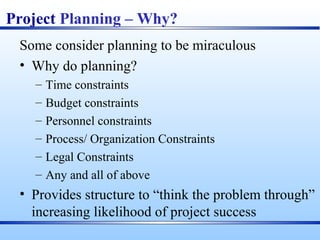
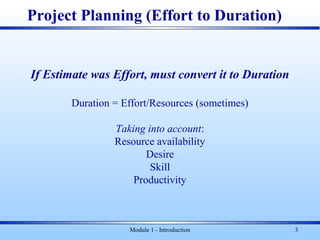
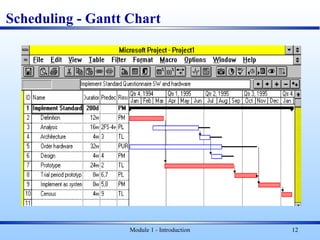
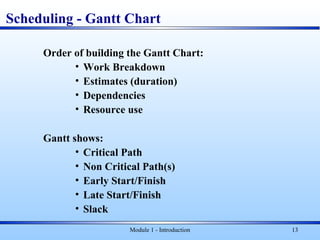
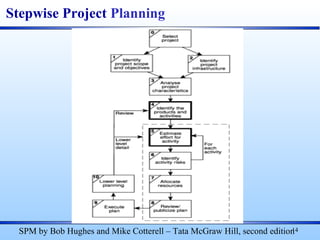
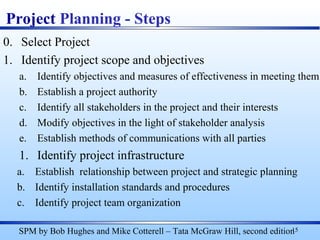
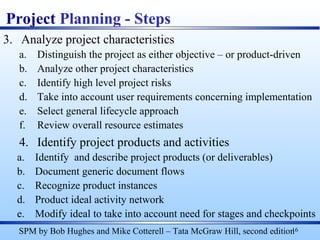
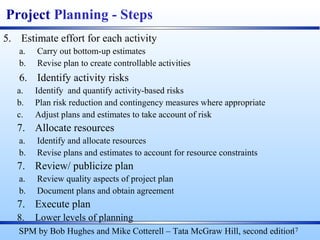
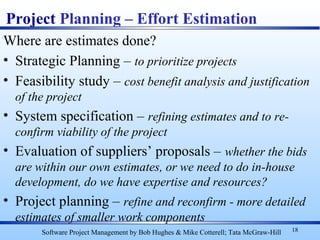
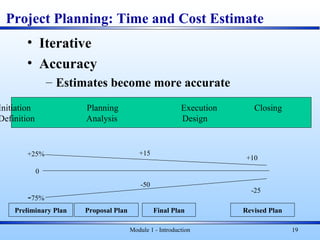
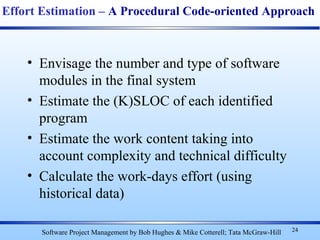
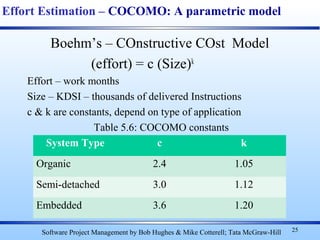
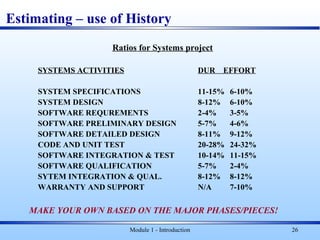
Module 1 - Introduction 1
Project Planning
Project Planning – Why?
Some consider planning to be miraculous
• Why do planning?
– Time constraints
– Budget constraints
– Personnel constraints
– Process/ Organization Constraints
– Legal Constraints
– Any and all of above
• Provides structure to “think the problem through”
increasing likelihood of project success
Module 1 - Introduction 3
If Estimate was Effort, must convert it to Duration
Duration = Effort/Resources (sometimes)
Taking into account:
Resource availability
Desire
Skill
Productivity
Project Planning (Effort to Duration)
Module 1 - Introduction 4
Stakeholders
Project Sponsor
Project Leader
Project
Manager
Finance
Procure-
ment
Systems
Engineering
Support
Sales Maintenance
IM/
IT
UsersContractors
Project Planning: set expectations of Stakeholders
5
..Project Planning.
• The structure of the project plan:
– Introduction (objectives, constraints)
– Project organization (team structure, personnel involved, roles)
– Risk analysis (types of risk, probabilities, solutions to prevent
or reduce the risk)
– Hardware and software resources needed (prices, delivery
schedule)
– Work breakdown (activities, milestones, deliverables)
– Project schedule (dependencies between activities/tasks, work
assignments, time allocated per task)
– Monitoring and reporting mechanisms (reports, dates)
6
Project Planning…
• A project plan should be drawn at the start of the project. This
plan drives the project and needs to be continuously adjusted
• Role of the project manager is to anticipate possible problems
and be prepared with solutions for these problems
• Other plans that need be developed:
– Quality plan
– Validation and verification plan
– Configuration management plan
– Change Management Plan (Scope Management Plan)
– Risk Management Plan
– Maintenance plan
– Staff development plan
7
…Project Planning
• Milestone = end-point of a specific, distinct software process
activity or task (for each milestone a report should be presented
to the management)
• Deliverable = project result delivered to the client
• In order to establish milestones, the phases of the software process
need be divided in basic activities/tasks. Example for requirements
engineering
Evaluation
report
Prototype
development
Requirements
definition
Requirements
analysis
Feasibility
report
Feasibility
study
Architectural
design
Design
study
Requirements
specification
Requirements
specification
ACTIVITIES
MILESTONES
8
Project Scheduling……
• Software managers:
– Divide the project in activities/tasks
– Estimate time and resources needed to finish the project
– Allocate resources to tasks
– Try to employ efficiently all the project personnel
– Minimize dependencies between tasks and teams
– Prepare contingency plans
– Rely on experience and intuition
Module 1 - Introduction 9
Write a Plan Containing
1. Steps required to accomplish the project objectives
2. Tasks needed to be done at each step (using Work Breakdown
Structures)
3. Estimate of how much effort each task requires
4. The resources required for each task
5. (Given 3. and 4.) Calculation of how long each task/step will take
6. (Given 4. and 5.) Calculation of task, step and project costs
7. The inter-dependencies of tasks
8. The schedule for each task and the whole project (Milstones,
Deliverables, payments)
Project Scheduling……
Module 1 - Introduction 10
Scheduling: Requires Duration and Precedents
Two Graphical tools for Scheduling:
1. Network Diagrams
a) PERT(Program Evaluation and Review Technique) Chart
b) CPM (Critical Path Method) Chart
2. Gnatt Chart
Plan (from WBS)
Task Precedent Duration
A - 7d
B A 3d
C - 10d
D C 5d
E - 4d
F E 6d
G F 3d
Module 1 - Introduction 11
Ordering the Activities: PERT Chart/ CPM Network
Arrow Diagramming Method (ADM)
Scheduling
1
2
3
4 5
6
A
C
E
B
D
F
G
7d
3d
4d
6d
3d
10d 5d
Module 1 - Introduction 12
Scheduling - Gantt Chart
Module 1 - Introduction 13
Scheduling - Gantt Chart
Order of building the Gantt Chart:
• Work Breakdown
• Estimates (duration)
• Dependencies
• Resource use
Gantt shows:
• Critical Path
• Non Critical Path(s)
• Early Start/Finish
• Late Start/Finish
• Slack
14
Stepwise Project Planning
SPM by Bob Hughes and Mike Cotterell – Tata McGraw Hill, second edition
0. Select Project
1. Identify project scope and objectives
a. Identify objectives and measures of effectiveness in meeting them
b. Establish a project authority
c. Identify all stakeholders in the project and their interests
d. Modify objectives in the light of stakeholder analysis
e. Establish methods of communications with all parties
1. Identify project infrastructure
a. Establish relationship between project and strategic planning
b. Identify installation standards and procedures
c. Identify project team organization
15
Project Planning - Steps
SPM by Bob Hughes and Mike Cotterell – Tata McGraw Hill, second edition
3. Analyze project characteristics
a. Distinguish the project as either objective – or product-driven
b. Analyze other project characteristics
c. Identify high level project risks
d. Take into account user requirements concerning implementation
e. Select general lifecycle approach
f. Review overall resource estimates
4. Identify project products and activities
a. Identify and describe project products (or deliverables)
b. Document generic document flows
c. Recognize product instances
d. Product ideal activity network
e. Modify ideal to take into account need for stages and checkpoints
16
Project Planning - Steps
SPM by Bob Hughes and Mike Cotterell – Tata McGraw Hill, second edition
5. Estimate effort for each activity
a. Carry out bottom-up estimates
b. Revise plan to create controllable activities
6. Identify activity risks
a. Identify and quantify activity-based risks
b. Plan risk reduction and contingency measures where appropriate
c. Adjust plans and estimates to take account of risk
7. Allocate resources
a. Identify and allocate resources
b. Revise plans and estimates to account for resource constraints
7. Review/ publicize plan
a. Review quality aspects of project plan
b. Document plans and obtain agreement
7. Execute plan
8. Lower levels of planning
17
Project Planning - Steps
SPM by Bob Hughes and Mike Cotterell – Tata McGraw Hill, second edition
Where are estimates done?
• Strategic Planning – to prioritize projects
• Feasibility study – cost benefit analysis and justification
of the project
• System specification – refining estimates and to re-
confirm viability of the project
• Evaluation of suppliers’ proposals – whether the bids
are within our own estimates, or we need to do in-house
development, do we have expertise and resources?
• Project planning – refine and reconfirm - more detailed
estimates of smaller work components
18
Project Planning – Effort Estimation
Software Project Management by Bob Hughes & Mike Cotterell; Tata McGraw-Hill
Module 1 - Introduction 19
Project Planning: Time and Cost Estimate
• Iterative
• Accuracy
– Estimates become more accurate
Preliminary Plan Final Plan
0
+25%
-75%
+15
-50
+10
-25
Initiation Planning Execution Closing
Definition Analysis Design
Proposal Plan Revised Plan
• Basis for software estimating
– Historical data (methodology, productivity etc)
– Measure of work (LOC, SLOC, KLOC, FP etc)
– Complexity (High, Medium, Low)
• Software effort estimation techniques
– Algorithmic/ parametric models – effort drivers (FPs, LOC etc)
– Expert judgment (advice of knowledgeable staff)
– Analogy (past data of similar projects)
– Parkinson (availability of resources, fill the space)
– Price to win
– Top- down
– Bottom-up
20
Project Planning – Effort Estimation
Software Project Management by Bob Hughes & Mike Cotterell; Tata McGraw-Hill
• A top – down method
• Functional size of the program (component) independent of the
program or language – called Function Point or FP
• Computer-based information systems comprise of five major
components or ‘external user types’:
– External input types – input transactions which update internal computer files
– External output types – transactions where data is output to the user
– Logical internal file types – standing files used in the system – made up of
one or more record types
– External interface file types – allow for output and input that may pass to and
from other computer applications (Files from banks to Income Tax dept)
– External inquiry types – transactions initiated by the user which provide
information but do not update the internal file
21
Project Planning – Effort Estimation
Software Project Management by Bob Hughes & Mike Cotterell; Tata McGraw-Hill
Albrecht function point analysis
• Process to calculate FP
– Count number of each component (external user types)
– Identify complexity of each component/ type
– Multiply the number with complexity for that component
– Add all the above (Unadjusted FP)
• Albrecht complexity multipliers
22
Effort Estimation - Albrecht function point analysis
Software Project Management by Bob Hughes & Mike Cotterell; Tata McGraw-Hill
External User Type Multiplier
Low Average High
External input type 3 4 6
External output type 4 5 7
Logical internal file type 7 10 15
External interface file type 5 7 10
External inquiry type 3 4 6
Albrecht (now IFPUG – International Function Point User
Group) is widely used.
Mark II originally sponsored by CCTA (Central Computer
and Telecommunications Agency of UK); Used mainly in
United Kingdom.
Based on past experience of developers weightage of efforts
for different type of functions is ascertained and then the
total effort in FP is calculated as
Wi * (number of input data elements types) +
We * (number of entity types referenced) +
Wo * (number of output data elements types)
23
Effort Estimation – Function Point Mark II
Software Project Management by Bob Hughes & Mike Cotterell; Tata McGraw-Hill
• Envisage the number and type of software
modules in the final system
• Estimate the (K)SLOC of each identified
program
• Estimate the work content taking into
account complexity and technical difficulty
• Calculate the work-days effort (using
historical data)
24
Effort Estimation – A Procedural Code-oriented Approach
Software Project Management by Bob Hughes & Mike Cotterell; Tata McGraw-Hill
Boehm’s – COnstructive COst Model
(effort) = c (Size)k
Effort – work months
Size – KDSI – thousands of delivered Instructions
c & k are constants, depend on type of application
Table 5.6: COCOMO constants
25
Effort Estimation – COCOMO: A parametric model
Software Project Management by Bob Hughes & Mike Cotterell; Tata McGraw-Hill
System Type c k
Organic 2.4 1.05
Semi-detached 3.0 1.12
Embedded 3.6 1.20
Module 1 - Introduction 26
Estimating – use of History
Ratios for Systems project
SYSTEMS ACTIVITIES DUR EFFORT
SYSTEM SPECIFICATIONS 11-15% 6-10%
SYSTEM DESIGN 8-12% 6-10%
SOFTWARE REQUREMENTS 2-4% 3-5%
SOFTWARE PRELIMINARY DESIGN 5-7% 4-6%
SOFTWARE DETAILED DESIGN 8-11% 9-12%
CODE AND UNIT TEST 20-28% 24-32%
SOFTWARE INTEGRATION & TEST 10-14% 11-15%
SOFTWARE QUALIFICATION 5-7% 2-4%
SYTEM INTEGRATION & QUAL. 8-12% 8-12%
WARRANTY AND SUPPORT N/A 7-10%
MAKE YOUR OWN BASED ON THE MAJOR PHASES/PIECES!
Assignment 2:
Q1. Ex 5.5 on calculation of FP (text book
fourth edition)
Q2. Ex 5.10 on COCOMO model for effort
calculation (text book fourth edition)
27
Project Planning
Questions?
Module 1 - Introduction 28
Assignment 2: EX 5.5
Ex 5.5 – The task for which Brigette has been made responsible in
Exercise 5.2 (Subsystem to analyze the staffing costs for each course
from the Payroll system) needs a program which will extract yearly
salaries from the, payroll file (External files) and hours taught on
each course by each member of staff and the details of course from
two files maintained by the timetabling system (External files). The
program will produce a report showing for each course the hours
taught by each member of staff and the cost of those hours.
Calculate the Albrecht function points for this subsystem assuming that
the report is of high complexity, but that all the other elements are
of average complexity.
Module 1 - Introduction 29
Extra Slides
Module 1 - Introduction 30
Module 1 - Introduction 31
Project Time Planning
Estimating Effort: 3 Methods
1. Professional Judgment
– “Expert” picks a number (out of the air!)
– Requires an expert
– Requires experience
– Good memory
– May ignore people
– VERY RELIABLE FOR THEMSELVES
Module 1 - Introduction 32
Estimating Efforts (cont’d)
2. History
– Look at tables of past actuals on major tasks
– Interpolate
– Requires professional judgment
– Requires good history (which changes!)
3. Formula
3.1 Variables
– Determine major variable factors (task, person)
– Using measurement determine formula of factors
– Interview and plug into formula
Project Time Planning
Module 1 - Introduction 33
Estimating Efforts (cont’d)
3.2 Function Points
– Determine smallest pieces (function points) of project.
– Using measurement establish time for each one.
– For new project, break into function points; add up
times, then multiply for worker productivity.
(Possibly: Junior x 2, Average x 1, Senior x 0.5)
• FORMULA IS BEST (IN THEORY).
• IN REALITY,____________ BEST.
Project Time Planning
34
• The TThe Three Time Estimatehree Time Estimate approachapproach
provides completion time estimate forprovides completion time estimate for
each activity.each activity.
• We use the notation:We use the notation:
a = an optimistic time to perform the activity.a = an optimistic time to perform the activity.
m = the most likely time to perform the activity.m = the most likely time to perform the activity.
b = a pessimistic time to perform the activity.b = a pessimistic time to perform the activity.
The Probability Approach – Three Time Estimates
35
µ
σ
= the mean completion time =
a + 4m+ b
6
= the standard deviation =
b -a
6
Approximations for the mean andApproximations for the mean and
the standard deviation of activitythe standard deviation of activity
completion time are based on thecompletion time are based on the
BetaBeta distribution.distribution.
The Distribution, Mean, and StandardThe Distribution, Mean, and Standard
Deviation of an ActivityDeviation of an Activity
The Probability Approach – Three Time Estimates
Assignment 2:
Q1. Ex 5.5 on calculation of FP (text book
fourth edition)
Q2. Ex 5.10 on COCOMO model for effort
calculation (text book fourth edition)
36
Project Planning
Extra Slides
Module 1 - Introduction 37
• Organic Mode – Small teams working in a familiar
in-house environment, system developed is small
and the interface requirements are flexible.
• Embedded Mode – Small teams working
independently on particular feature of a larger
system to be integrated later with other teams’
work.
38
Effort Estimation – COCOMO: A parametric model
Software Project Management by Bob Hughes & Mike Cotterell; Tata McGraw-Hill

project planning-estimation

  • 1.
    Module 1 -Introduction 1 Project Planning
  • 2.
    Project Planning –Why? Some consider planning to be miraculous • Why do planning? – Time constraints – Budget constraints – Personnel constraints – Process/ Organization Constraints – Legal Constraints – Any and all of above • Provides structure to “think the problem through” increasing likelihood of project success
  • 3.
    Module 1 -Introduction 3 If Estimate was Effort, must convert it to Duration Duration = Effort/Resources (sometimes) Taking into account: Resource availability Desire Skill Productivity Project Planning (Effort to Duration)
  • 4.
    Module 1 -Introduction 4 Stakeholders Project Sponsor Project Leader Project Manager Finance Procure- ment Systems Engineering Support Sales Maintenance IM/ IT UsersContractors Project Planning: set expectations of Stakeholders
  • 5.
    5 ..Project Planning. • Thestructure of the project plan: – Introduction (objectives, constraints) – Project organization (team structure, personnel involved, roles) – Risk analysis (types of risk, probabilities, solutions to prevent or reduce the risk) – Hardware and software resources needed (prices, delivery schedule) – Work breakdown (activities, milestones, deliverables) – Project schedule (dependencies between activities/tasks, work assignments, time allocated per task) – Monitoring and reporting mechanisms (reports, dates)
  • 6.
    6 Project Planning… • Aproject plan should be drawn at the start of the project. This plan drives the project and needs to be continuously adjusted • Role of the project manager is to anticipate possible problems and be prepared with solutions for these problems • Other plans that need be developed: – Quality plan – Validation and verification plan – Configuration management plan – Change Management Plan (Scope Management Plan) – Risk Management Plan – Maintenance plan – Staff development plan
  • 7.
    7 …Project Planning • Milestone= end-point of a specific, distinct software process activity or task (for each milestone a report should be presented to the management) • Deliverable = project result delivered to the client • In order to establish milestones, the phases of the software process need be divided in basic activities/tasks. Example for requirements engineering Evaluation report Prototype development Requirements definition Requirements analysis Feasibility report Feasibility study Architectural design Design study Requirements specification Requirements specification ACTIVITIES MILESTONES
  • 8.
    8 Project Scheduling…… • Softwaremanagers: – Divide the project in activities/tasks – Estimate time and resources needed to finish the project – Allocate resources to tasks – Try to employ efficiently all the project personnel – Minimize dependencies between tasks and teams – Prepare contingency plans – Rely on experience and intuition
  • 9.
    Module 1 -Introduction 9 Write a Plan Containing 1. Steps required to accomplish the project objectives 2. Tasks needed to be done at each step (using Work Breakdown Structures) 3. Estimate of how much effort each task requires 4. The resources required for each task 5. (Given 3. and 4.) Calculation of how long each task/step will take 6. (Given 4. and 5.) Calculation of task, step and project costs 7. The inter-dependencies of tasks 8. The schedule for each task and the whole project (Milstones, Deliverables, payments) Project Scheduling……
  • 10.
    Module 1 -Introduction 10 Scheduling: Requires Duration and Precedents Two Graphical tools for Scheduling: 1. Network Diagrams a) PERT(Program Evaluation and Review Technique) Chart b) CPM (Critical Path Method) Chart 2. Gnatt Chart Plan (from WBS) Task Precedent Duration A - 7d B A 3d C - 10d D C 5d E - 4d F E 6d G F 3d
  • 11.
    Module 1 -Introduction 11 Ordering the Activities: PERT Chart/ CPM Network Arrow Diagramming Method (ADM) Scheduling 1 2 3 4 5 6 A C E B D F G 7d 3d 4d 6d 3d 10d 5d
  • 12.
    Module 1 -Introduction 12 Scheduling - Gantt Chart
  • 13.
    Module 1 -Introduction 13 Scheduling - Gantt Chart Order of building the Gantt Chart: • Work Breakdown • Estimates (duration) • Dependencies • Resource use Gantt shows: • Critical Path • Non Critical Path(s) • Early Start/Finish • Late Start/Finish • Slack
  • 14.
    14 Stepwise Project Planning SPMby Bob Hughes and Mike Cotterell – Tata McGraw Hill, second edition
  • 15.
    0. Select Project 1.Identify project scope and objectives a. Identify objectives and measures of effectiveness in meeting them b. Establish a project authority c. Identify all stakeholders in the project and their interests d. Modify objectives in the light of stakeholder analysis e. Establish methods of communications with all parties 1. Identify project infrastructure a. Establish relationship between project and strategic planning b. Identify installation standards and procedures c. Identify project team organization 15 Project Planning - Steps SPM by Bob Hughes and Mike Cotterell – Tata McGraw Hill, second edition
  • 16.
    3. Analyze projectcharacteristics a. Distinguish the project as either objective – or product-driven b. Analyze other project characteristics c. Identify high level project risks d. Take into account user requirements concerning implementation e. Select general lifecycle approach f. Review overall resource estimates 4. Identify project products and activities a. Identify and describe project products (or deliverables) b. Document generic document flows c. Recognize product instances d. Product ideal activity network e. Modify ideal to take into account need for stages and checkpoints 16 Project Planning - Steps SPM by Bob Hughes and Mike Cotterell – Tata McGraw Hill, second edition
  • 17.
    5. Estimate effortfor each activity a. Carry out bottom-up estimates b. Revise plan to create controllable activities 6. Identify activity risks a. Identify and quantify activity-based risks b. Plan risk reduction and contingency measures where appropriate c. Adjust plans and estimates to take account of risk 7. Allocate resources a. Identify and allocate resources b. Revise plans and estimates to account for resource constraints 7. Review/ publicize plan a. Review quality aspects of project plan b. Document plans and obtain agreement 7. Execute plan 8. Lower levels of planning 17 Project Planning - Steps SPM by Bob Hughes and Mike Cotterell – Tata McGraw Hill, second edition
  • 18.
    Where are estimatesdone? • Strategic Planning – to prioritize projects • Feasibility study – cost benefit analysis and justification of the project • System specification – refining estimates and to re- confirm viability of the project • Evaluation of suppliers’ proposals – whether the bids are within our own estimates, or we need to do in-house development, do we have expertise and resources? • Project planning – refine and reconfirm - more detailed estimates of smaller work components 18 Project Planning – Effort Estimation Software Project Management by Bob Hughes & Mike Cotterell; Tata McGraw-Hill
  • 19.
    Module 1 -Introduction 19 Project Planning: Time and Cost Estimate • Iterative • Accuracy – Estimates become more accurate Preliminary Plan Final Plan 0 +25% -75% +15 -50 +10 -25 Initiation Planning Execution Closing Definition Analysis Design Proposal Plan Revised Plan
  • 20.
    • Basis forsoftware estimating – Historical data (methodology, productivity etc) – Measure of work (LOC, SLOC, KLOC, FP etc) – Complexity (High, Medium, Low) • Software effort estimation techniques – Algorithmic/ parametric models – effort drivers (FPs, LOC etc) – Expert judgment (advice of knowledgeable staff) – Analogy (past data of similar projects) – Parkinson (availability of resources, fill the space) – Price to win – Top- down – Bottom-up 20 Project Planning – Effort Estimation Software Project Management by Bob Hughes & Mike Cotterell; Tata McGraw-Hill
  • 21.
    • A top– down method • Functional size of the program (component) independent of the program or language – called Function Point or FP • Computer-based information systems comprise of five major components or ‘external user types’: – External input types – input transactions which update internal computer files – External output types – transactions where data is output to the user – Logical internal file types – standing files used in the system – made up of one or more record types – External interface file types – allow for output and input that may pass to and from other computer applications (Files from banks to Income Tax dept) – External inquiry types – transactions initiated by the user which provide information but do not update the internal file 21 Project Planning – Effort Estimation Software Project Management by Bob Hughes & Mike Cotterell; Tata McGraw-Hill Albrecht function point analysis
  • 22.
    • Process tocalculate FP – Count number of each component (external user types) – Identify complexity of each component/ type – Multiply the number with complexity for that component – Add all the above (Unadjusted FP) • Albrecht complexity multipliers 22 Effort Estimation - Albrecht function point analysis Software Project Management by Bob Hughes & Mike Cotterell; Tata McGraw-Hill External User Type Multiplier Low Average High External input type 3 4 6 External output type 4 5 7 Logical internal file type 7 10 15 External interface file type 5 7 10 External inquiry type 3 4 6
  • 23.
    Albrecht (now IFPUG– International Function Point User Group) is widely used. Mark II originally sponsored by CCTA (Central Computer and Telecommunications Agency of UK); Used mainly in United Kingdom. Based on past experience of developers weightage of efforts for different type of functions is ascertained and then the total effort in FP is calculated as Wi * (number of input data elements types) + We * (number of entity types referenced) + Wo * (number of output data elements types) 23 Effort Estimation – Function Point Mark II Software Project Management by Bob Hughes & Mike Cotterell; Tata McGraw-Hill
  • 24.
    • Envisage thenumber and type of software modules in the final system • Estimate the (K)SLOC of each identified program • Estimate the work content taking into account complexity and technical difficulty • Calculate the work-days effort (using historical data) 24 Effort Estimation – A Procedural Code-oriented Approach Software Project Management by Bob Hughes & Mike Cotterell; Tata McGraw-Hill
  • 25.
    Boehm’s – COnstructiveCOst Model (effort) = c (Size)k Effort – work months Size – KDSI – thousands of delivered Instructions c & k are constants, depend on type of application Table 5.6: COCOMO constants 25 Effort Estimation – COCOMO: A parametric model Software Project Management by Bob Hughes & Mike Cotterell; Tata McGraw-Hill System Type c k Organic 2.4 1.05 Semi-detached 3.0 1.12 Embedded 3.6 1.20
  • 26.
    Module 1 -Introduction 26 Estimating – use of History Ratios for Systems project SYSTEMS ACTIVITIES DUR EFFORT SYSTEM SPECIFICATIONS 11-15% 6-10% SYSTEM DESIGN 8-12% 6-10% SOFTWARE REQUREMENTS 2-4% 3-5% SOFTWARE PRELIMINARY DESIGN 5-7% 4-6% SOFTWARE DETAILED DESIGN 8-11% 9-12% CODE AND UNIT TEST 20-28% 24-32% SOFTWARE INTEGRATION & TEST 10-14% 11-15% SOFTWARE QUALIFICATION 5-7% 2-4% SYTEM INTEGRATION & QUAL. 8-12% 8-12% WARRANTY AND SUPPORT N/A 7-10% MAKE YOUR OWN BASED ON THE MAJOR PHASES/PIECES!
  • 27.
    Assignment 2: Q1. Ex5.5 on calculation of FP (text book fourth edition) Q2. Ex 5.10 on COCOMO model for effort calculation (text book fourth edition) 27 Project Planning
  • 28.
    Questions? Module 1 -Introduction 28
  • 29.
    Assignment 2: EX5.5 Ex 5.5 – The task for which Brigette has been made responsible in Exercise 5.2 (Subsystem to analyze the staffing costs for each course from the Payroll system) needs a program which will extract yearly salaries from the, payroll file (External files) and hours taught on each course by each member of staff and the details of course from two files maintained by the timetabling system (External files). The program will produce a report showing for each course the hours taught by each member of staff and the cost of those hours. Calculate the Albrecht function points for this subsystem assuming that the report is of high complexity, but that all the other elements are of average complexity. Module 1 - Introduction 29
  • 30.
    Extra Slides Module 1- Introduction 30
  • 31.
    Module 1 -Introduction 31 Project Time Planning Estimating Effort: 3 Methods 1. Professional Judgment – “Expert” picks a number (out of the air!) – Requires an expert – Requires experience – Good memory – May ignore people – VERY RELIABLE FOR THEMSELVES
  • 32.
    Module 1 -Introduction 32 Estimating Efforts (cont’d) 2. History – Look at tables of past actuals on major tasks – Interpolate – Requires professional judgment – Requires good history (which changes!) 3. Formula 3.1 Variables – Determine major variable factors (task, person) – Using measurement determine formula of factors – Interview and plug into formula Project Time Planning
  • 33.
    Module 1 -Introduction 33 Estimating Efforts (cont’d) 3.2 Function Points – Determine smallest pieces (function points) of project. – Using measurement establish time for each one. – For new project, break into function points; add up times, then multiply for worker productivity. (Possibly: Junior x 2, Average x 1, Senior x 0.5) • FORMULA IS BEST (IN THEORY). • IN REALITY,____________ BEST. Project Time Planning
  • 34.
    34 • The TTheThree Time Estimatehree Time Estimate approachapproach provides completion time estimate forprovides completion time estimate for each activity.each activity. • We use the notation:We use the notation: a = an optimistic time to perform the activity.a = an optimistic time to perform the activity. m = the most likely time to perform the activity.m = the most likely time to perform the activity. b = a pessimistic time to perform the activity.b = a pessimistic time to perform the activity. The Probability Approach – Three Time Estimates
  • 35.
    35 µ σ = the meancompletion time = a + 4m+ b 6 = the standard deviation = b -a 6 Approximations for the mean andApproximations for the mean and the standard deviation of activitythe standard deviation of activity completion time are based on thecompletion time are based on the BetaBeta distribution.distribution. The Distribution, Mean, and StandardThe Distribution, Mean, and Standard Deviation of an ActivityDeviation of an Activity The Probability Approach – Three Time Estimates
  • 36.
    Assignment 2: Q1. Ex5.5 on calculation of FP (text book fourth edition) Q2. Ex 5.10 on COCOMO model for effort calculation (text book fourth edition) 36 Project Planning
  • 37.
    Extra Slides Module 1- Introduction 37
  • 38.
    • Organic Mode– Small teams working in a familiar in-house environment, system developed is small and the interface requirements are flexible. • Embedded Mode – Small teams working independently on particular feature of a larger system to be integrated later with other teams’ work. 38 Effort Estimation – COCOMO: A parametric model Software Project Management by Bob Hughes & Mike Cotterell; Tata McGraw-Hill

Editor's Notes

  • #2 The third knowledge area Timing: PM lecture: 13:00-14:00 MSProject Lesson 1: 14:00-16:00
  • #4 Estimating for a project may have given you “direct time” (the number of person days). Need Duration to schedule. Dur = …e.g., 10 person days (pd) of effort may take only 5 calendar days with 2 people doing it. Can’t always divide: if it takes 10 days for one programmer to write a program, 2 may take…11 days! This is due to the communication, management, dividing the work, etc. And how long it takes for a person takes into account all the other factors.
  • #5 Larger project Project Leader: highest level person on contractor (project) side Project Sponsor: highest level person on client side
  • #8 Milestones are used for monitoring and reporting the progress; these should be planned at regular intervals to help in monitoring progress of the project. Usually a milestone should be linked to a deliverable; which should be planned every week or two weeks- though it will depend on the type and duration of the project.
  • #10 Planning is hierarchical: big things (steps), break down to smaller things (tasks) to even smaller if necessary (activities), etc.
  • #11 PERT = Program Evaluation and Review Technique (invented by US Navy, 1950’s, for Polaris missile project, which had 100,000 activities.) Table: A has no precedent, takes 7d duration. B has A as precedent, i.e., can not start before A is finished, etc.
  • #12 Each arrow represents a task. Starting and ending points are called “nodes” and are numbered. The nodes may be milestones (start or end of something major). A sequence of events (A-B. C-D, E-F-G) is called a path. PERT shows you what activities, or paths are occurring simultaneously. In this case A-B can be same time as C-D, and as E-F-G. Original PERT had only above information. In 1957 DuPont suggested putting durations with the PERT. With Dur, can calculate the critical path. The CP is the path that has the longest total duration. CP tells us minimum length of project, as well as the Critical Tasks. If a Critical Tasks takes longer than planned, it will delay the project. Critical path here is C-D (15 days) therefore C &D are critical events Activities not on the critical path have “float” or “slack” (a period of time that these activities can slip and still not affect the delivery date) Shortest path is A-B (10 days). This path has 15-10=5 days of slack. Path E-F-G (13 days) has 2 days of slack. Careful: CP does not stay put. What if E takes 7 days? This path is now critical. Also, if E takes 6 days, you have 2 CP’s, (too many CP’s is difficult to control).
  • #13 Important dates: Early start (ES) Early finish (EF) Late start (LS) Late finish (LF) Scheduled start (SS) Scheduled finish (SF) Demo: item 5, Order hardware, has only Successor item 9, Implement as system. 5 has 3 months of slack, so it can be ordered as late as (end of) March before impacting CP. Therefore its ES is Jan, LS is Mar, EF is Aug LF is Nov. The PM may schedule it to start Feb to arrive Oct, which would then be the SS and SF.
  • #14 Time bar graph that everyone is familiar with. Joke: what does Gantt stand for? Invent something: Going Along with no Tracking or Training (pretty bad). ANS: guy’s name. See example next slide.
  • #20 Emphasize that planning is iterative. Time has passed since the preliminary plan was written. More knowledge exists. The graph demonstrated how estimating inaccuracy range goes down. Underestimating range (negative numbers) always seems to be greater. Why do we rarely overestimate? Too optimistic.
  • #27 You should first take a good look at the time estimates before publishing them. Tools that help: Ratios : works on the fact the the same people in the same organization tend to develop similar projects. Projects themselves change but the rations of major phases or pieces is pretty constant. Do not use ratios like this: estimate one item, then extrapolate all the rest. Use instead: estimate all the items, compare to past ratios; examine if far out.
  • #32 Estimating is an iterative process. The first estimate is made when you write the preliminary project plan It is 50% to 100% inaccurate at that point. As you re-plan, you should be only 25-50% off. By the time the final plan is written, it should only be 10% off. 3 methods of estimating: 1. Professional Judgment 2. History 3. Formula Professional Judgment: Advantages: a) fast; b) can be extremely accurate if person is an expert Disadvantages: a) expert must be expert in that particular subject; b) difficult to find experts; c) estimate given is for how long it would take for that expert to do it (not someone else) Does not work to estimate for someone else!
  • #33 2. History - Need to keep track of history. - Write down how long each task took, and who did it. - Therefore, you need to break up the project into into tasks that are generally repeated and easily compared. 3. Formula - There are basically two factors that affect the duration of a task 1) the complexity of the task 2) the productivity of the person performing it
  • #34 IN REALITY - PROFESSIONAL JUDGEMENT IS BEST 90% of the time, this is what is used