Downloaded 109 times


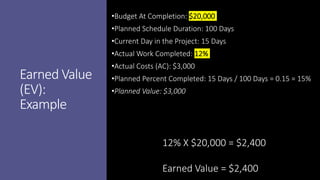
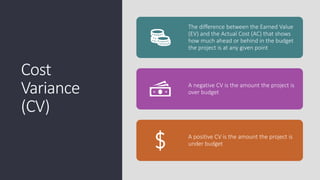
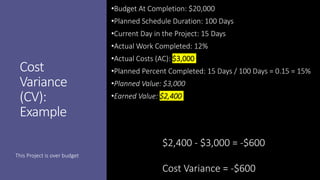
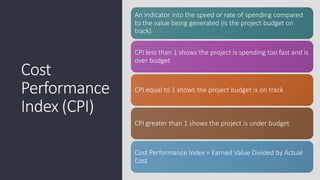
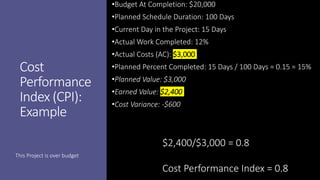

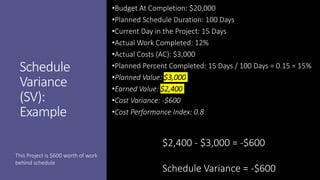
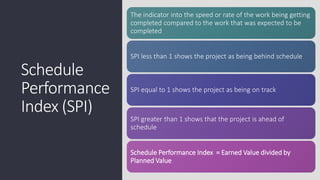
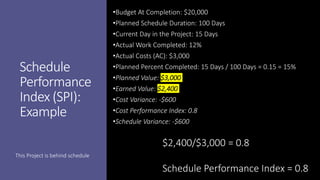
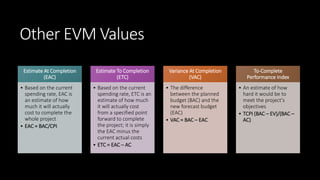


Earned Value Management (EVM) is a project management technique that uses several key formulas to assess a project's performance regarding budget and schedule. Key concepts include Budget at Completion (BAC), Actual Cost (AC), Planned Value (PV), Earned Value (EV), Cost Variance (CV), Cost Performance Index (CPI), Schedule Variance (SV), and Schedule Performance Index (SPI), which provide insights into how well the project is performing relative to its objectives. Various calculations help in determining the project’s financial and scheduling health, offering estimates for completion and indicating whether the project is ahead or behind its goals.