Downloaded 124 times


![NAME DEFINITION EQUATION
VALUE
2nd week
EAC | ESTIMATE AT
COMPLETION
If the CPI is expected to be the same for the remainder of the
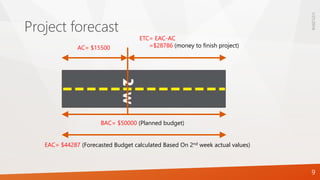
project, EAC can be calculated using EAC = BAC/CPI $44286.979
If future work will be accomplished at the planned rate, use: EAC = AC + BAC – EV $48000
If the initial plan is no longer valid, use: EAC = AC + Bottom-up ETC
If both the CPI and SPI influence the remaining work, use EAC = AC + [(BAC – EV)/(CPI x SPI)] $48398.899
ETC | ESTIMATE TO
COMPLETION
Assuming work is proceeding on plan, the cost of completing the
remaining authorized work can be calculated using:
ETC = EAC – AC $28786
Reestimate the remaining work from the bottom up ETC = Reestimate
VAC | VARIANCE AT
COMPLETION
The estimated difference in cost at the completion of the project.
Positive = Under planned cost
Neutral = On planned cost
Negative = Over planned cost
VAC = BAC – EAC $5713.021
1/21/2016
10
FORECASTEDVALUES](https://image.slidesharecdn.com/earnedvalueanalysis-160121130731/85/Earned-value-analysis-10-320.jpg)


The document provides an overview of Earned Value Management (EVM), a methodology that integrates scope, schedule, and resource measurements to evaluate project performance. It outlines key concepts such as Budgeted at Completion (BAC), Planned Value (PV), Earned Value (EV), and provides calculations for schedule and cost variances. Additionally, it includes an example of a project to illustrate the application of EVM metrics and forecasting techniques.


