Download as ZIP, PPTX
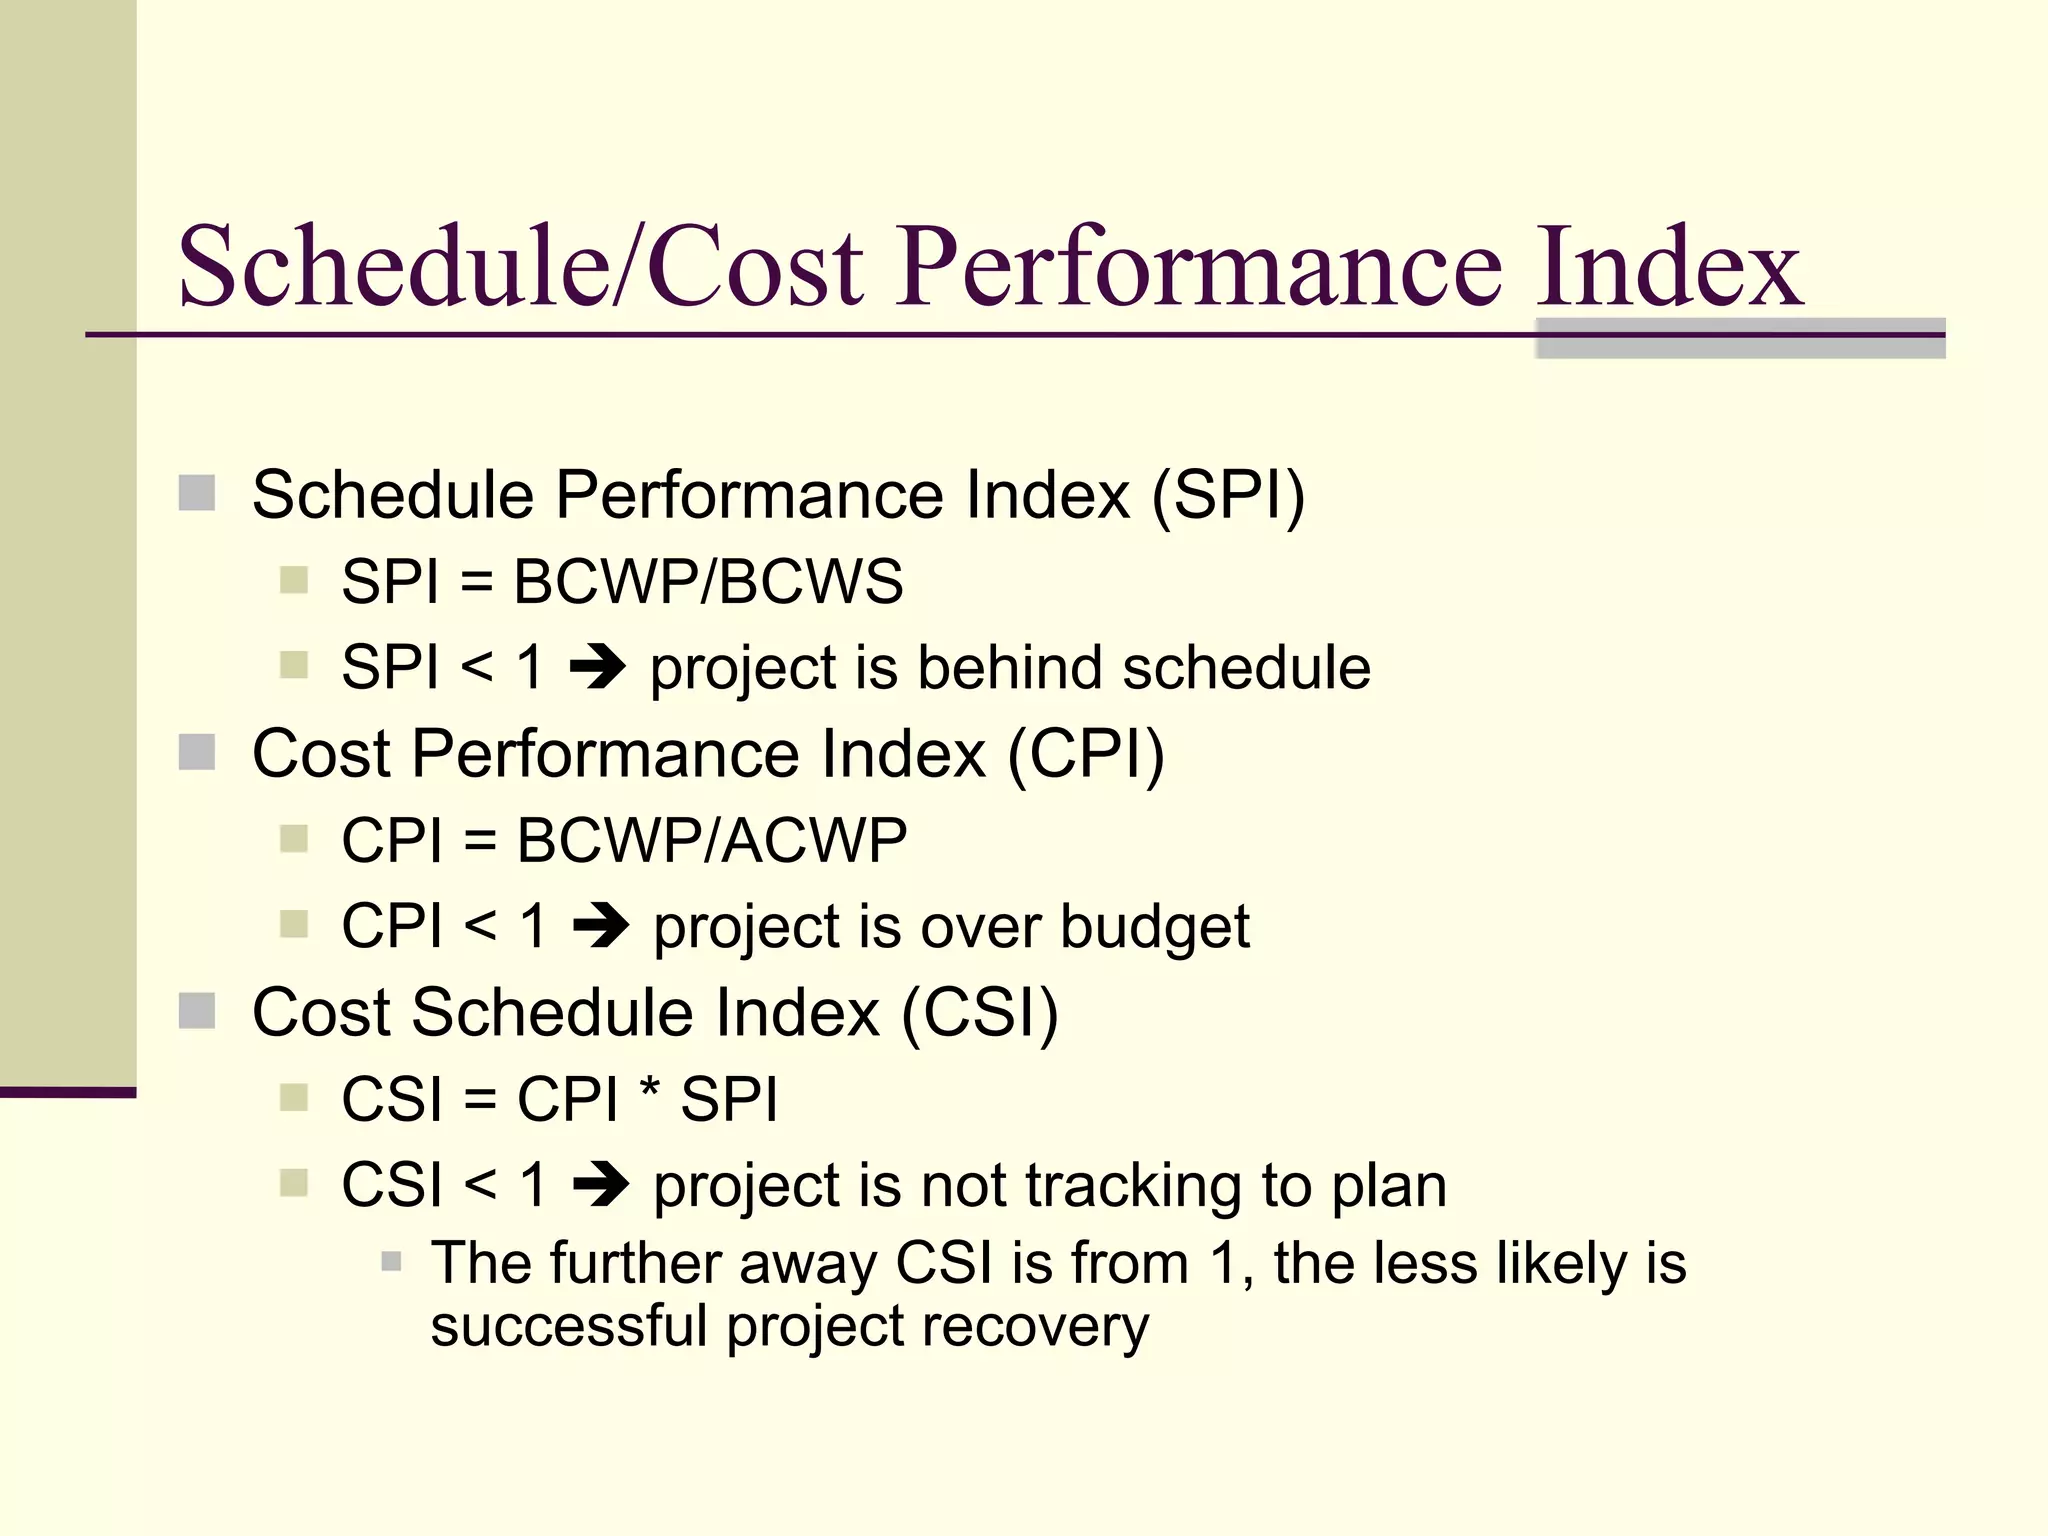
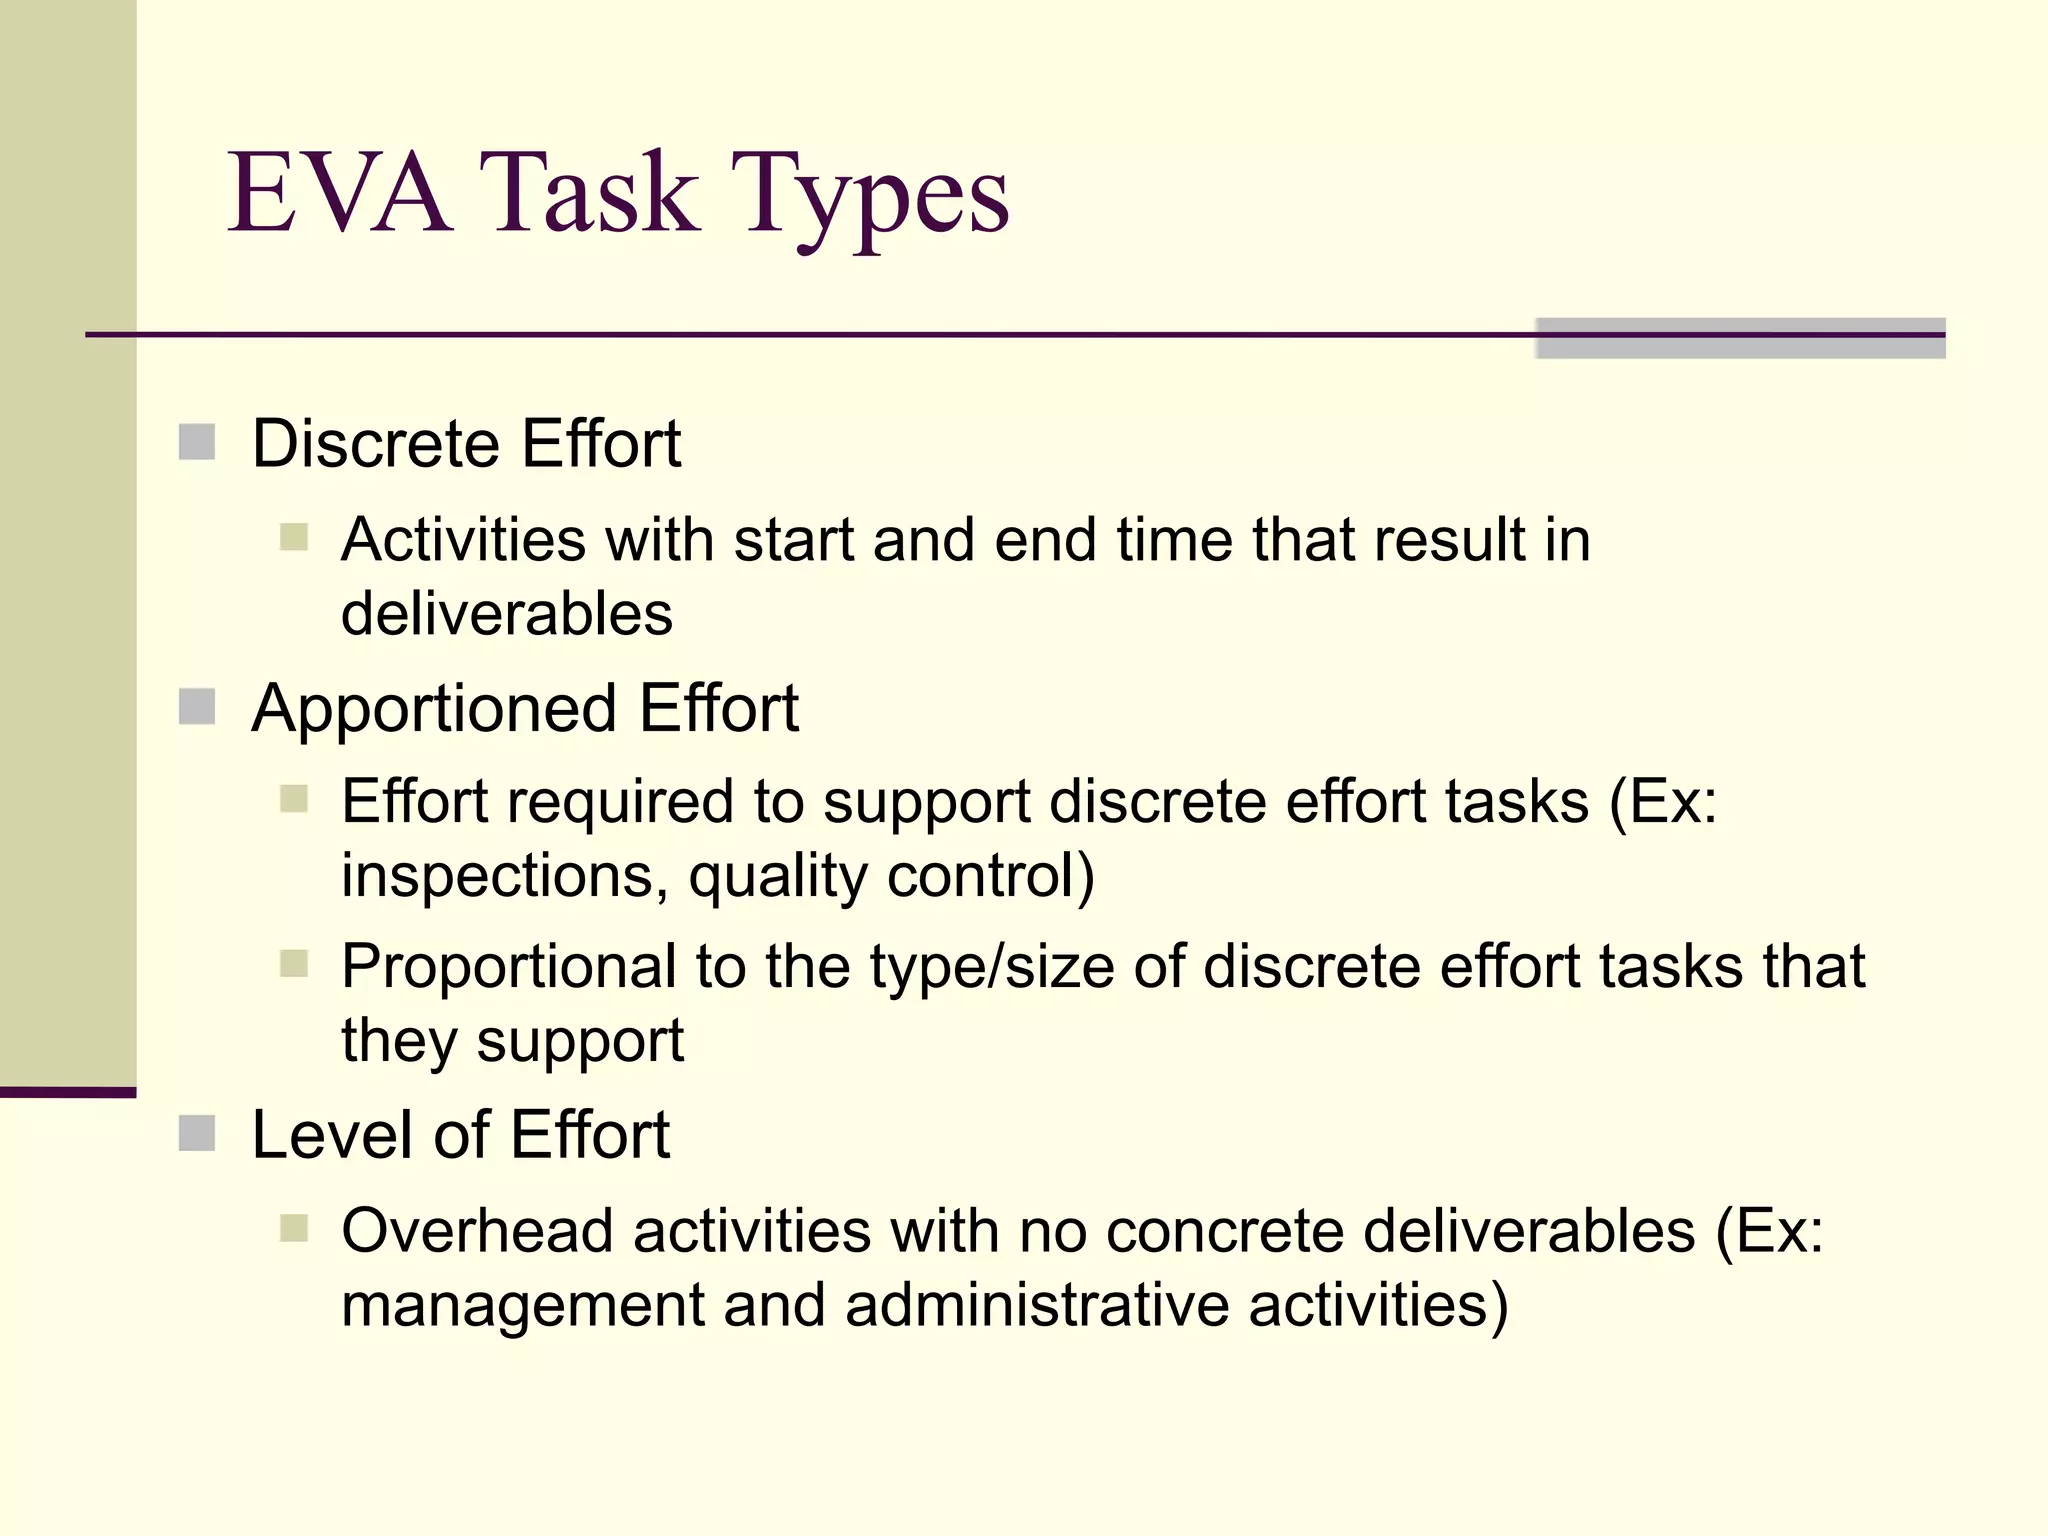
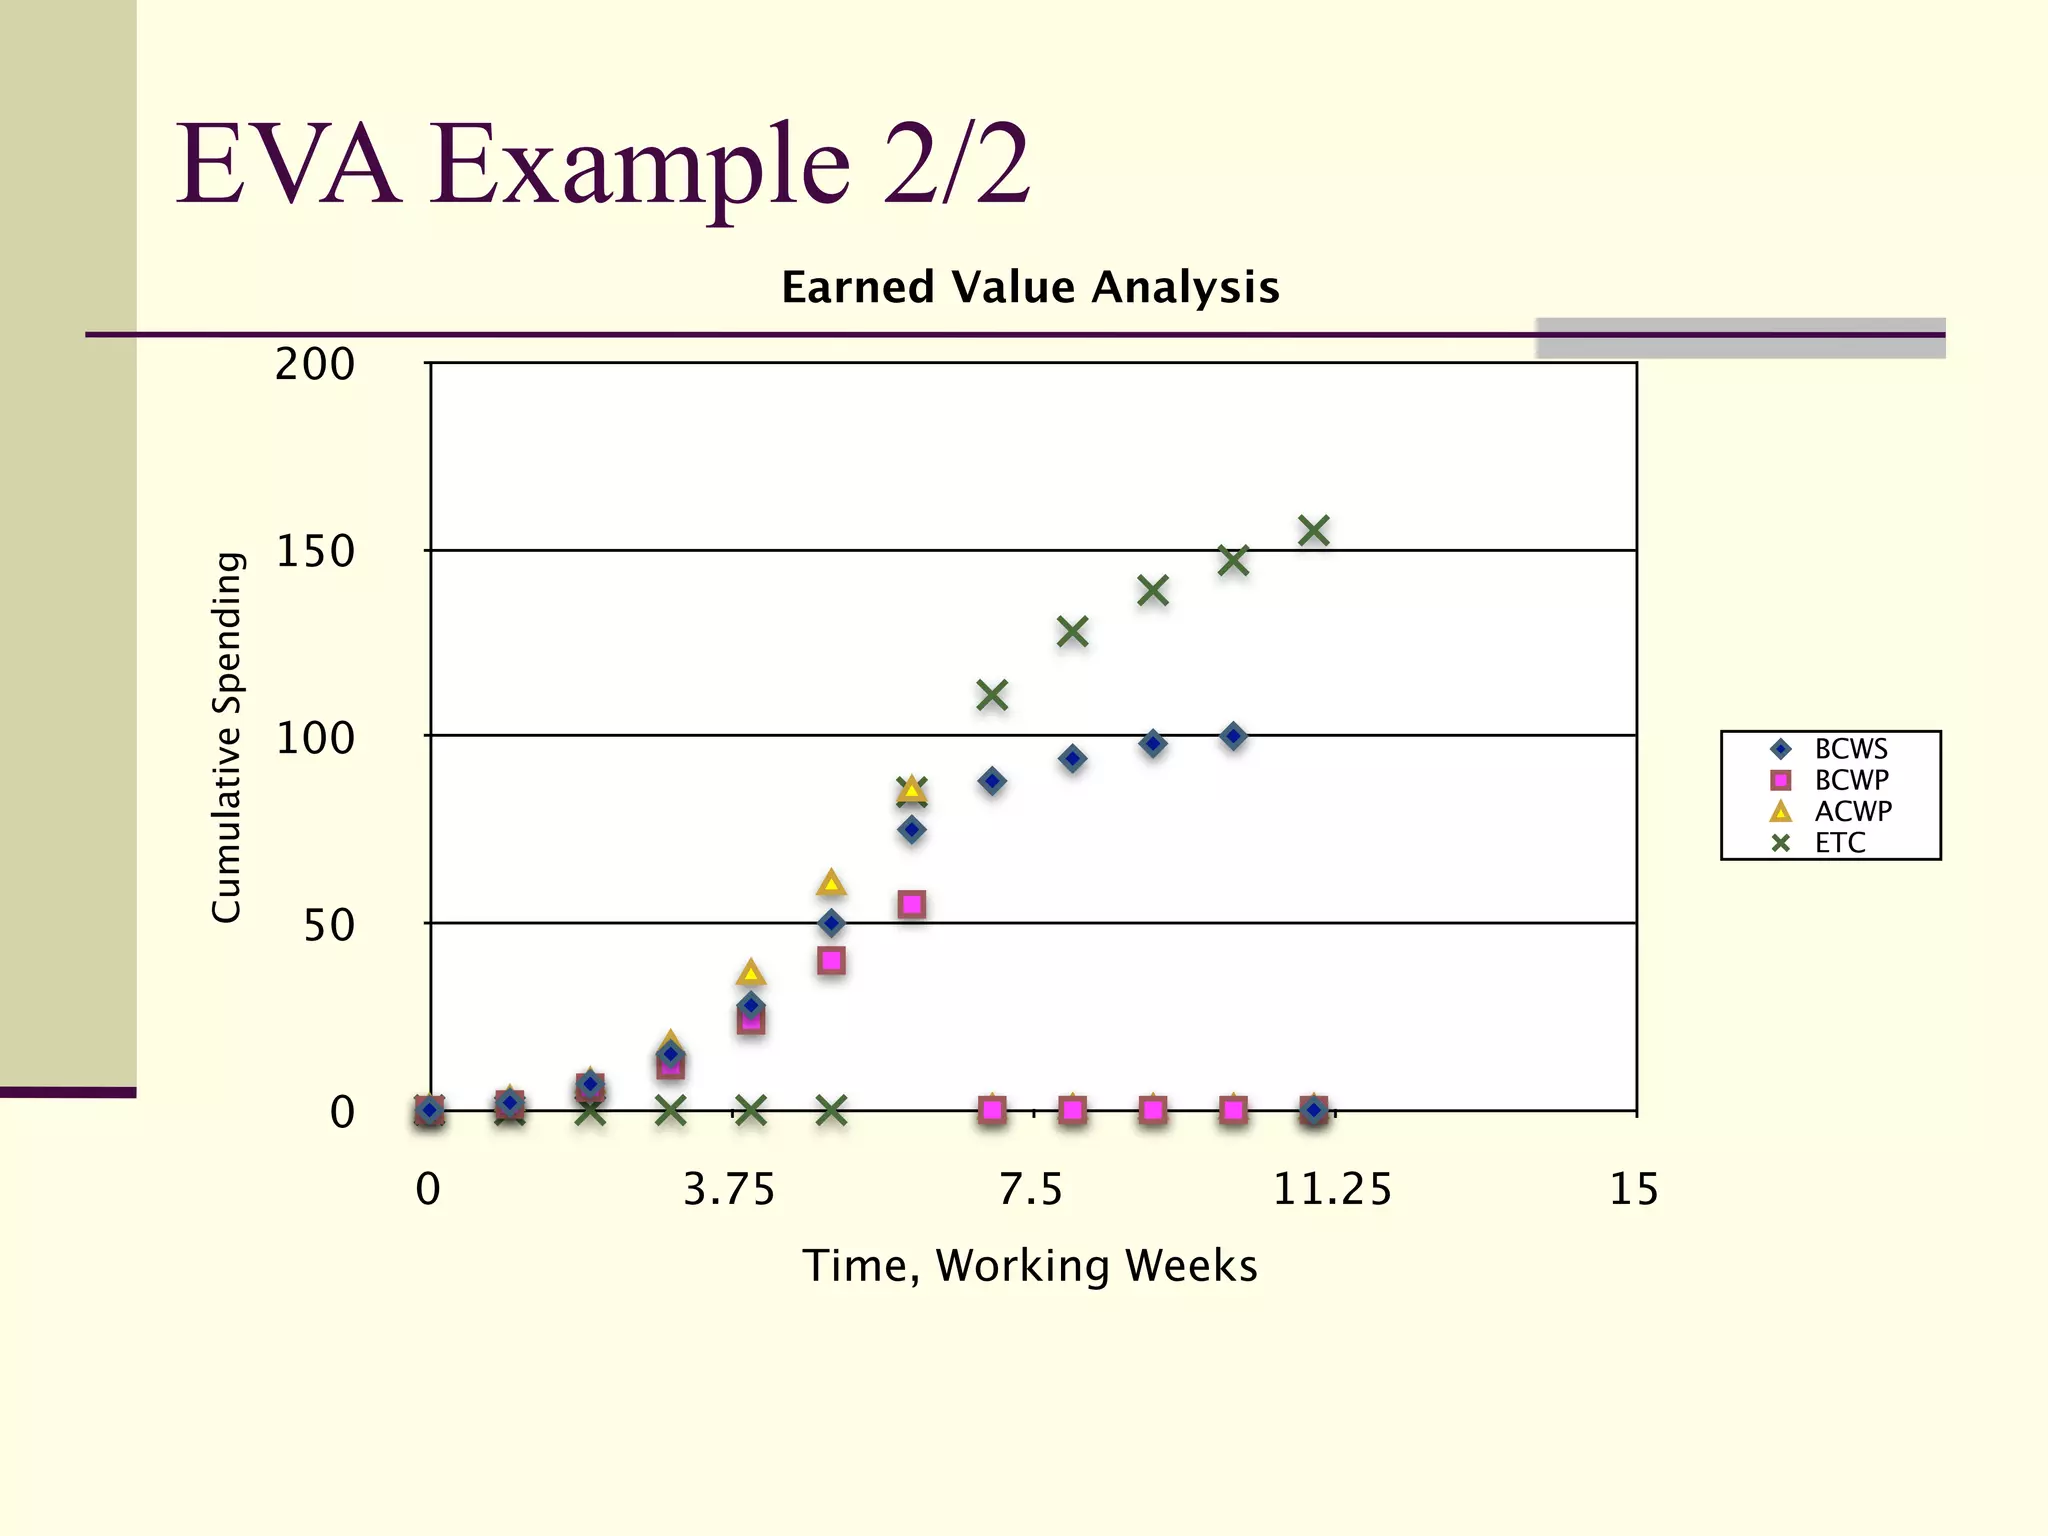
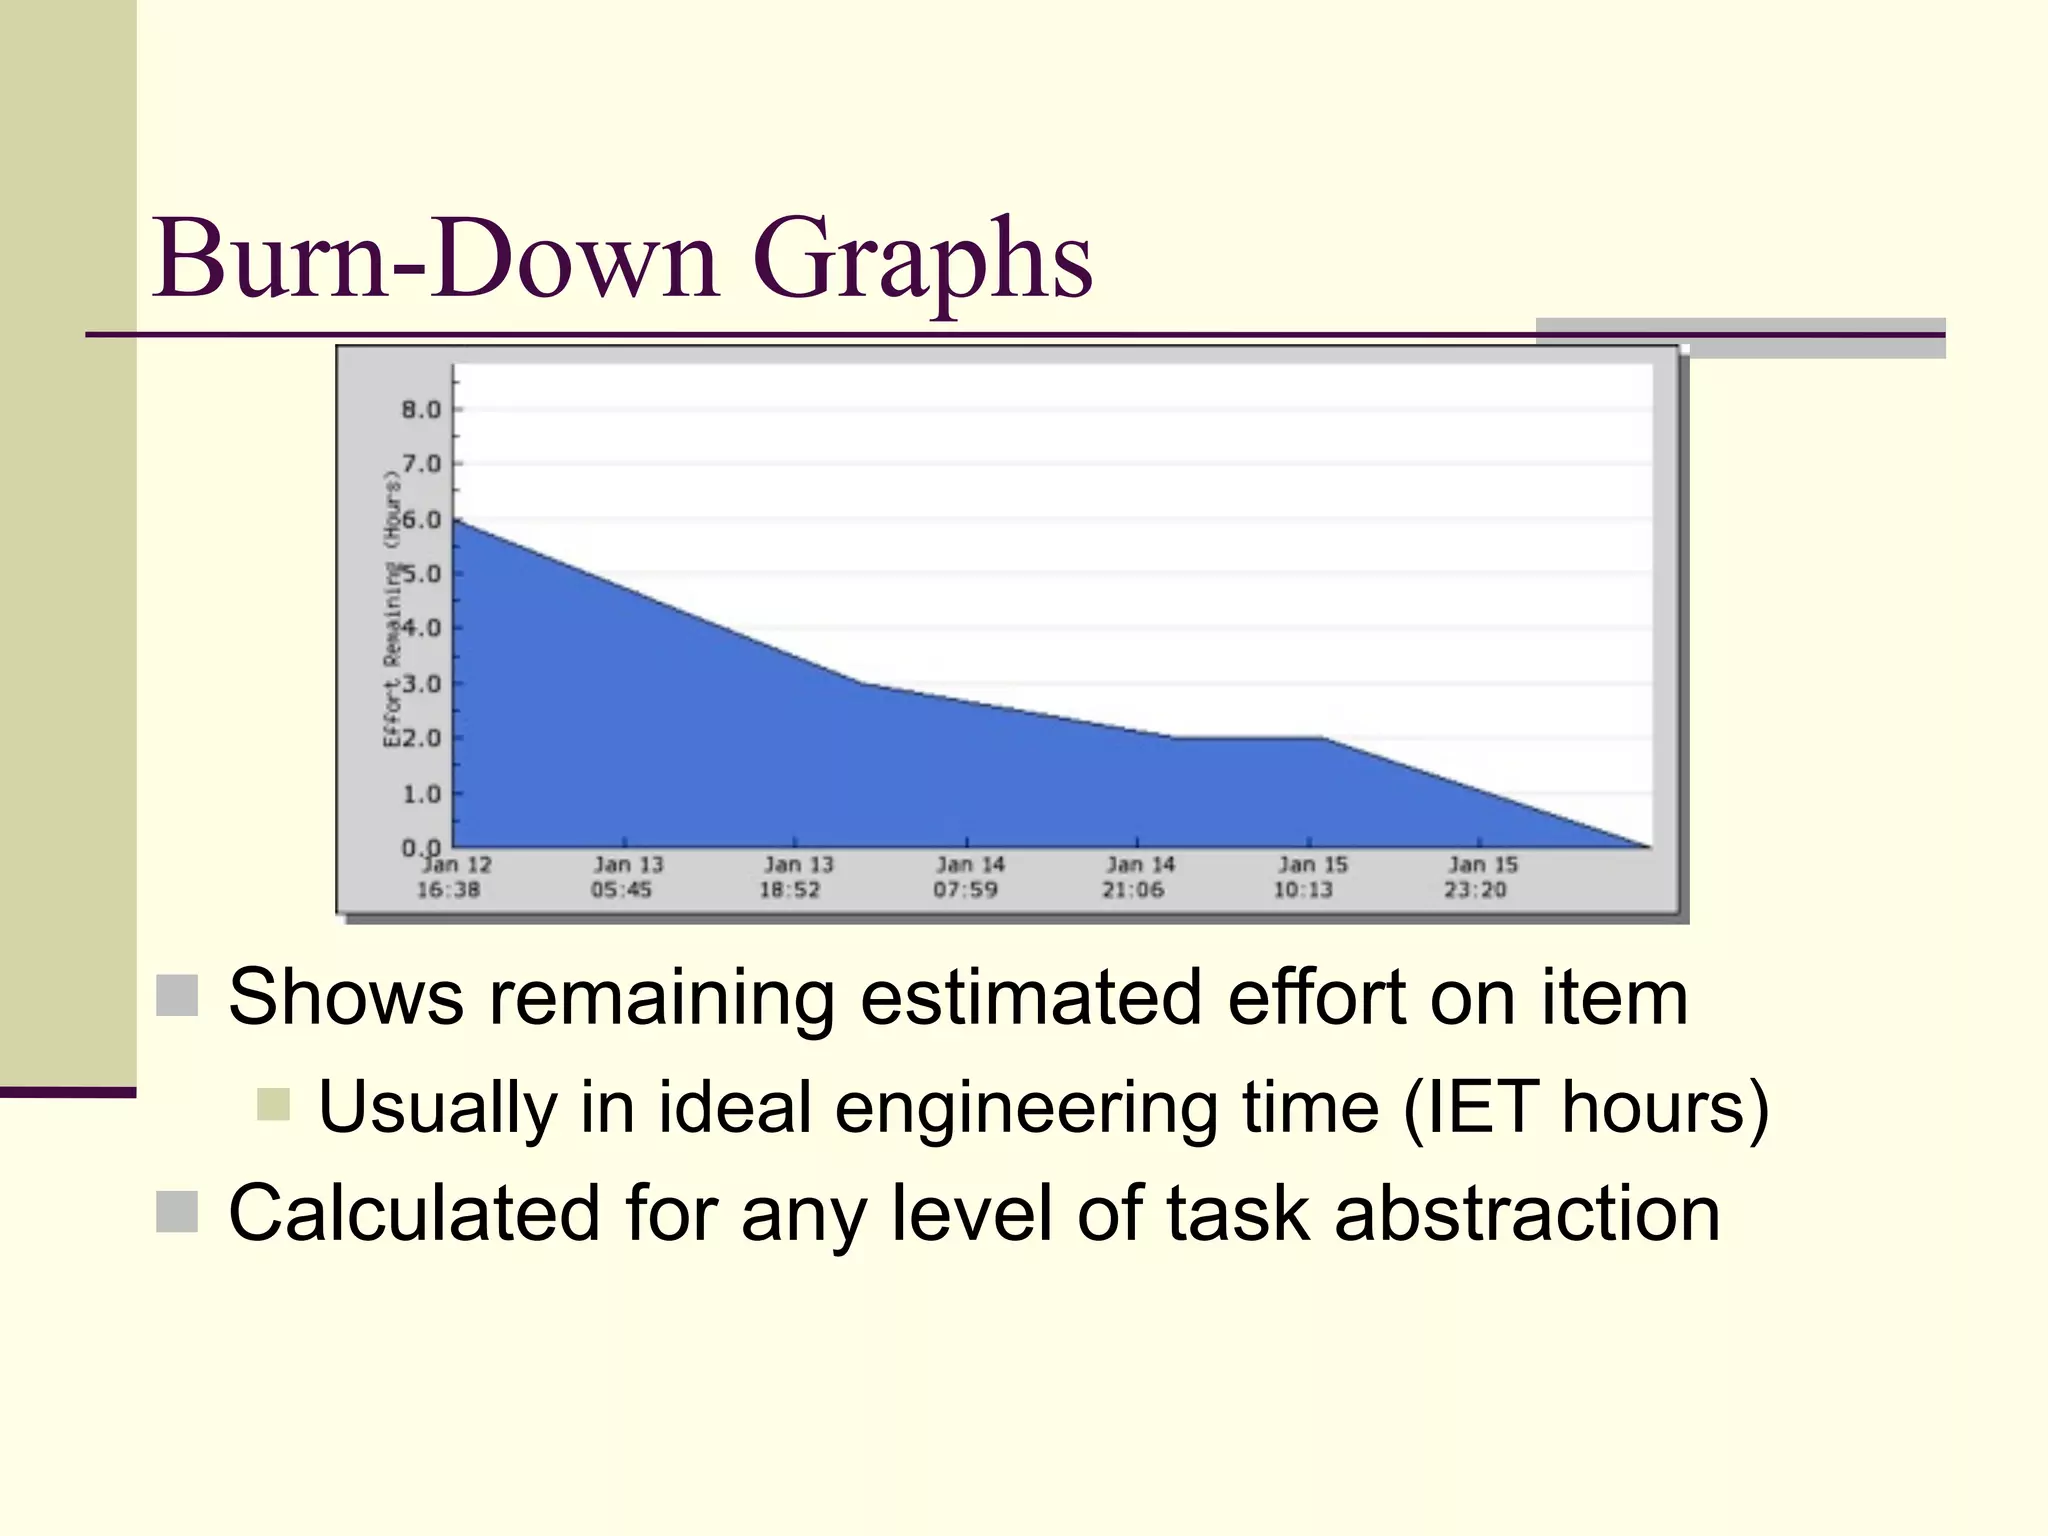
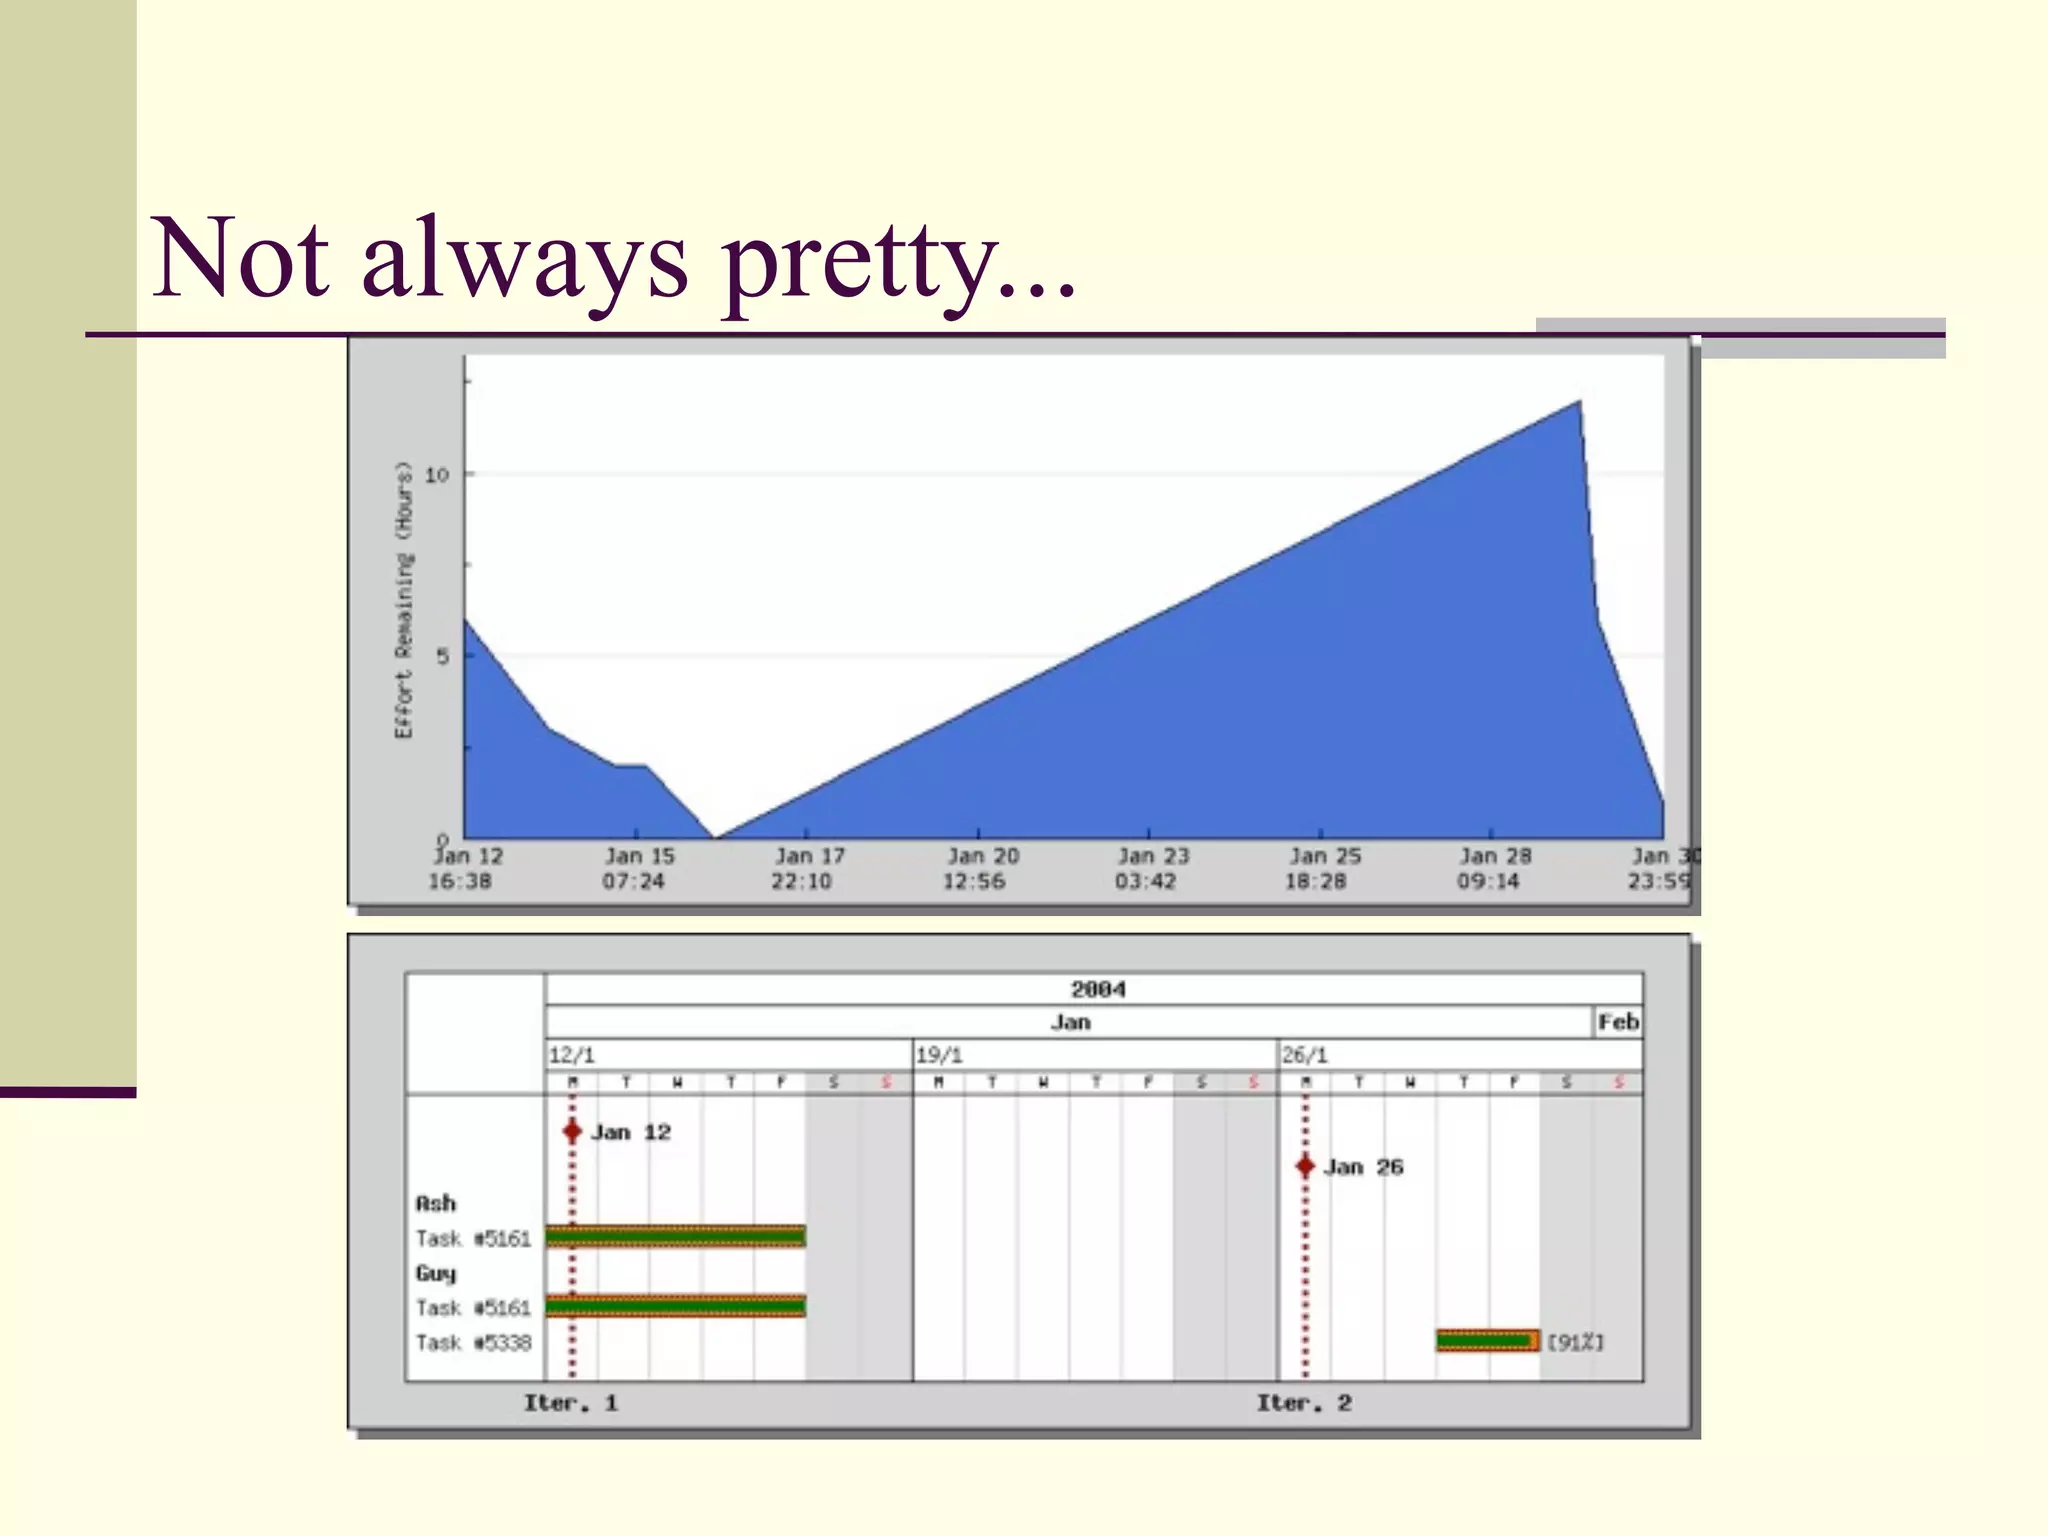
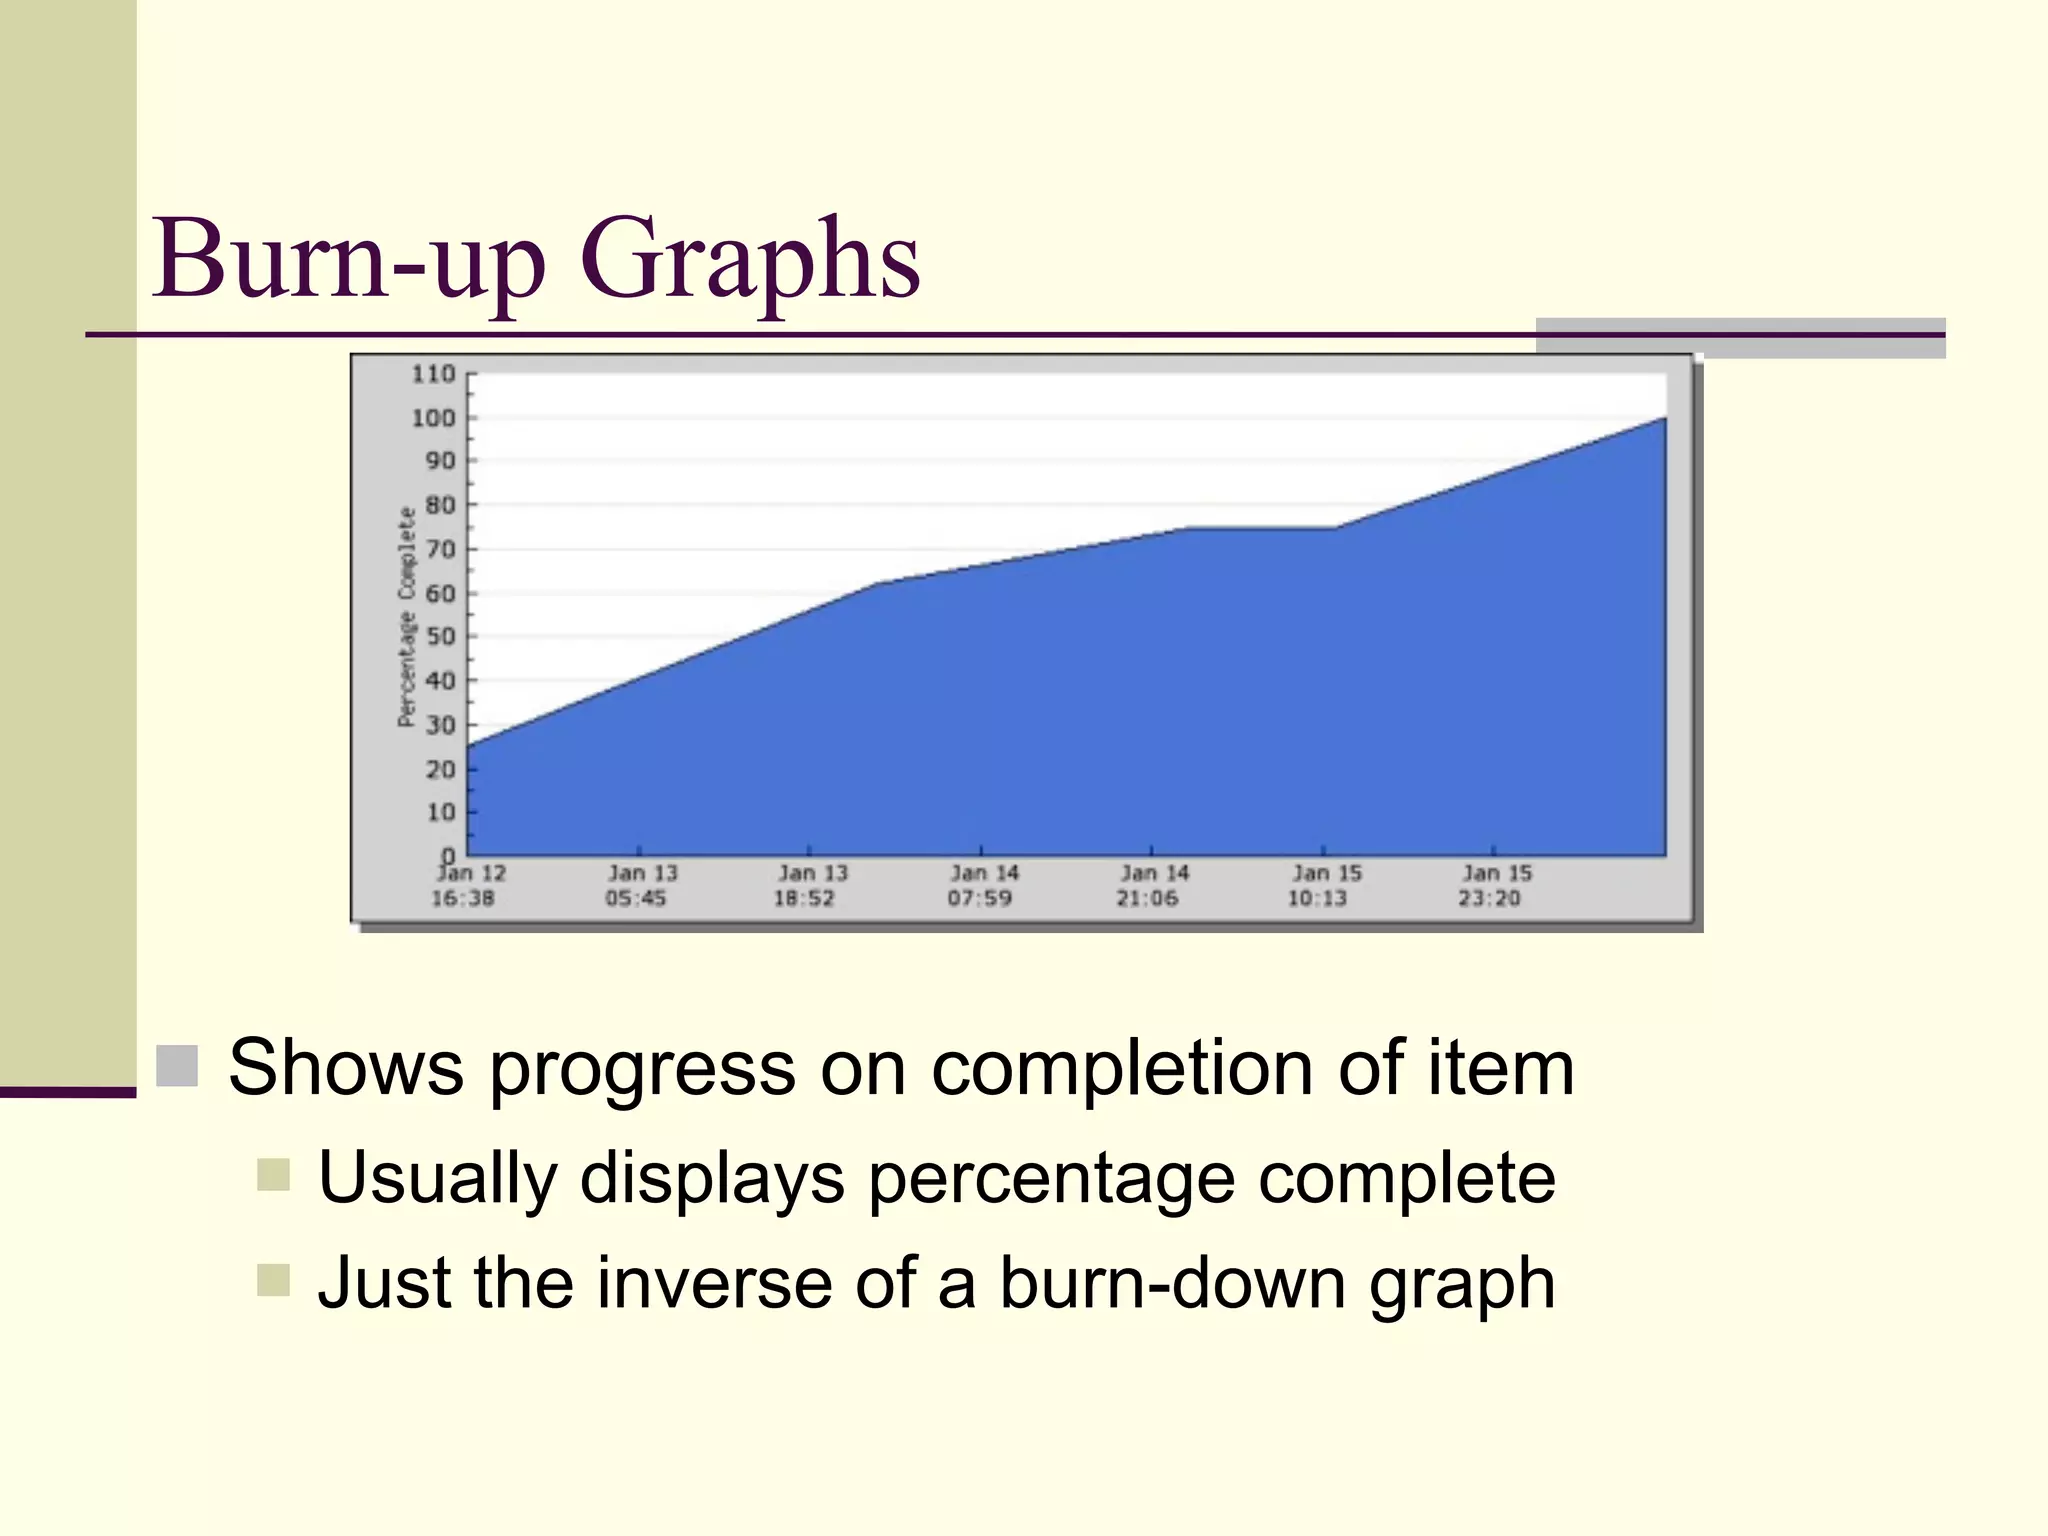
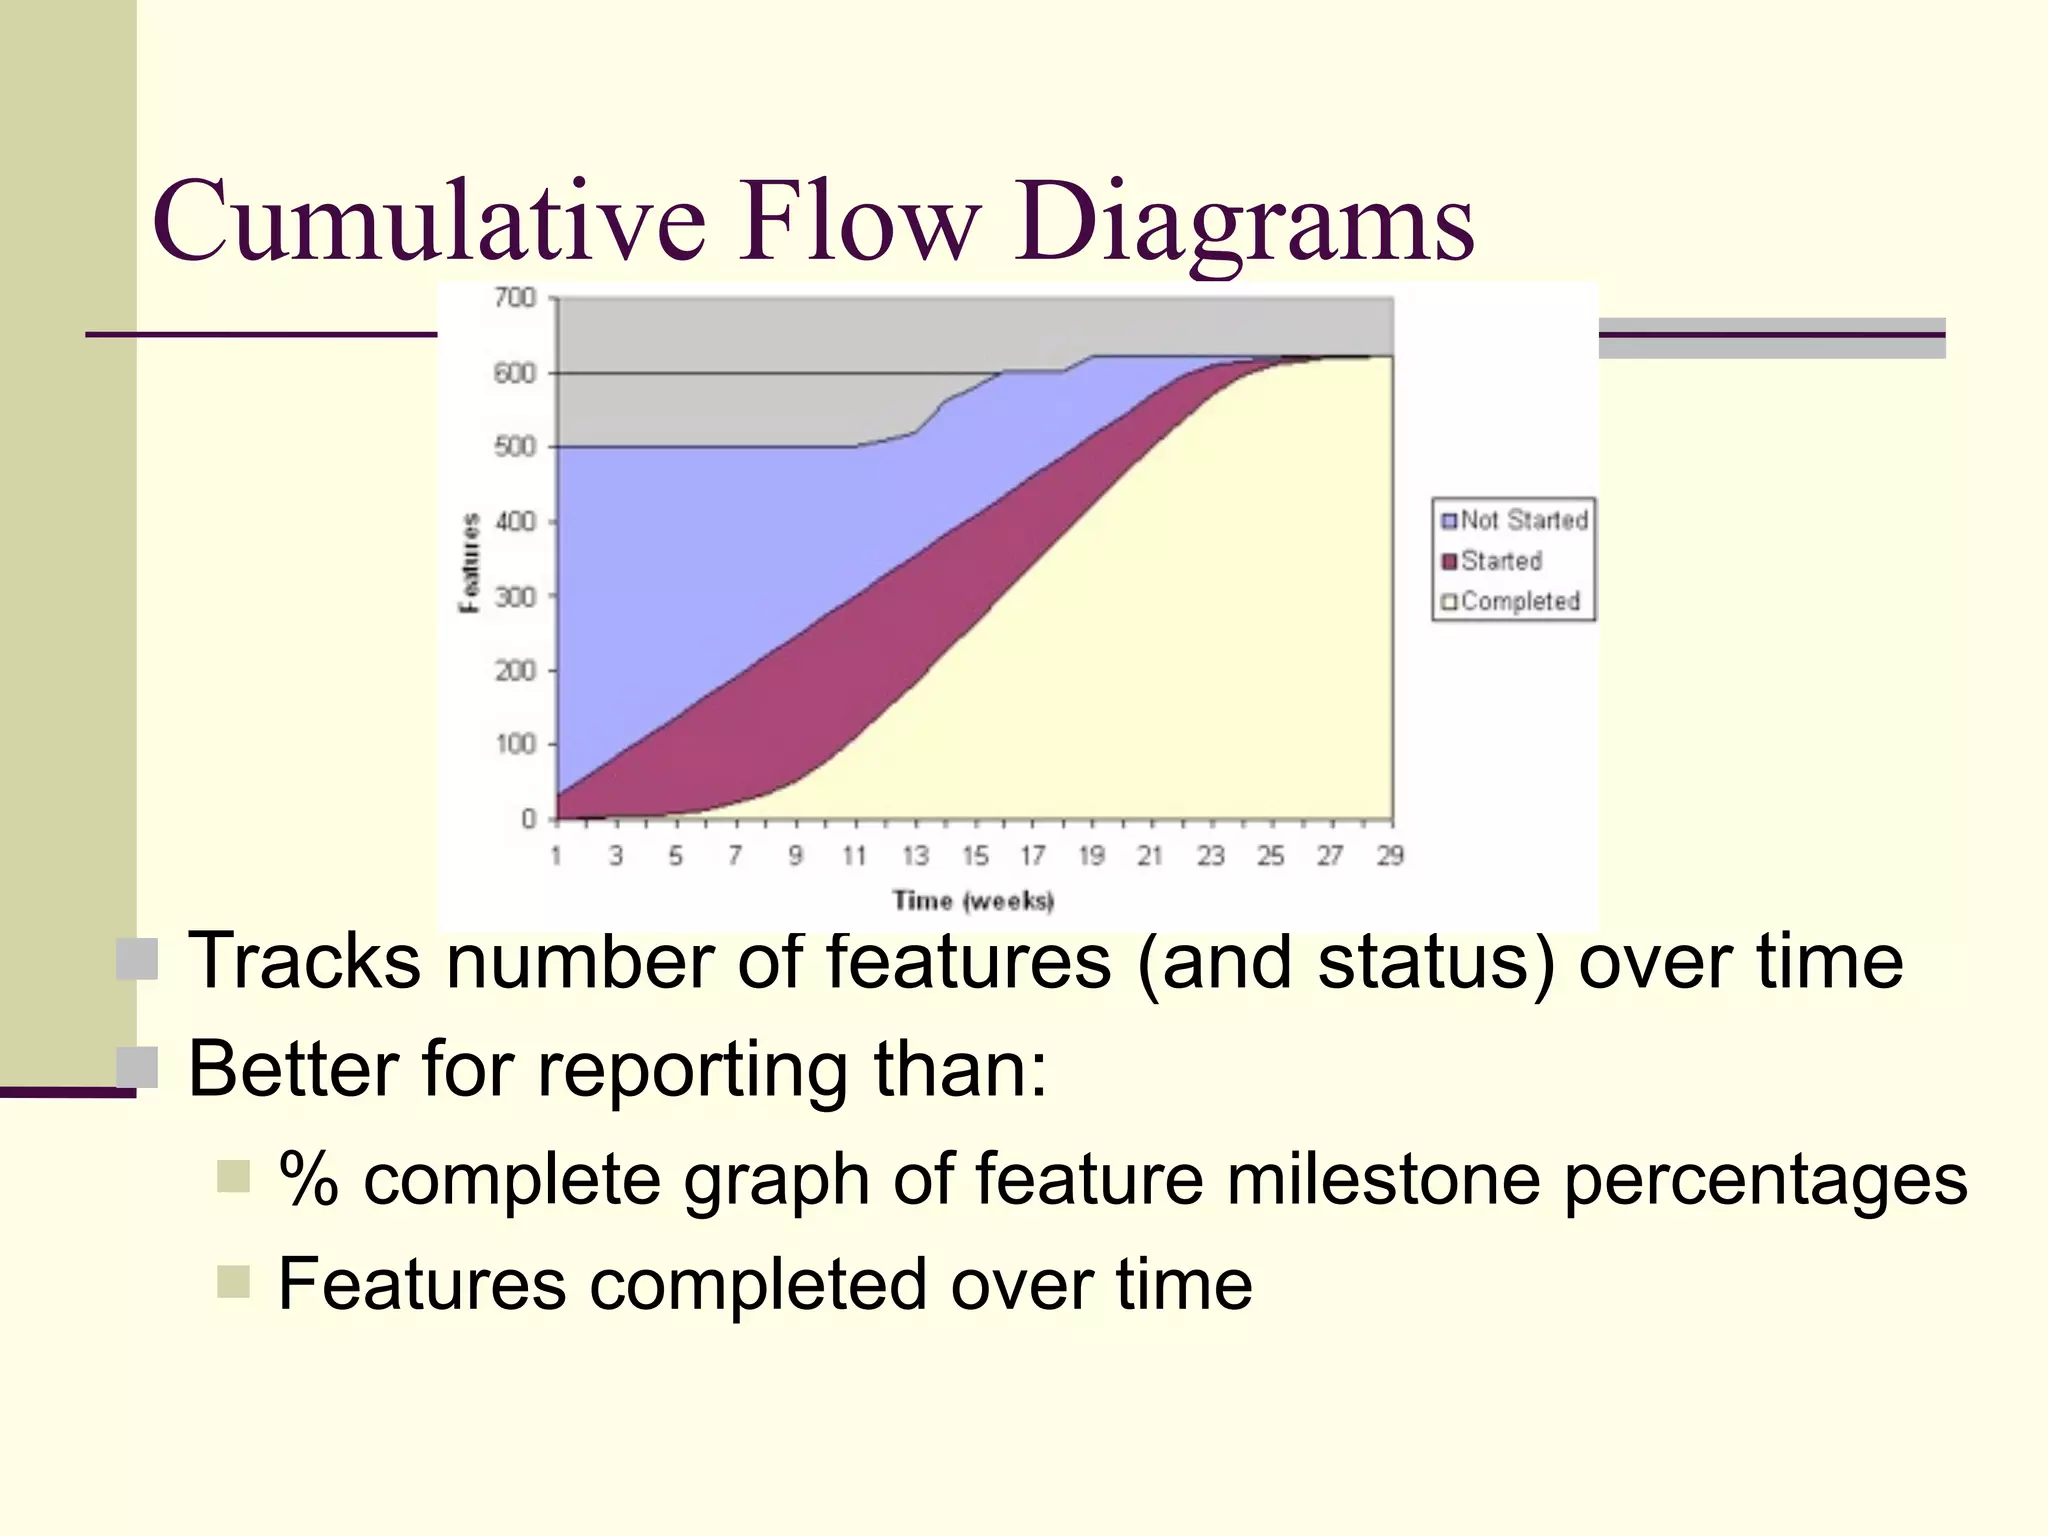
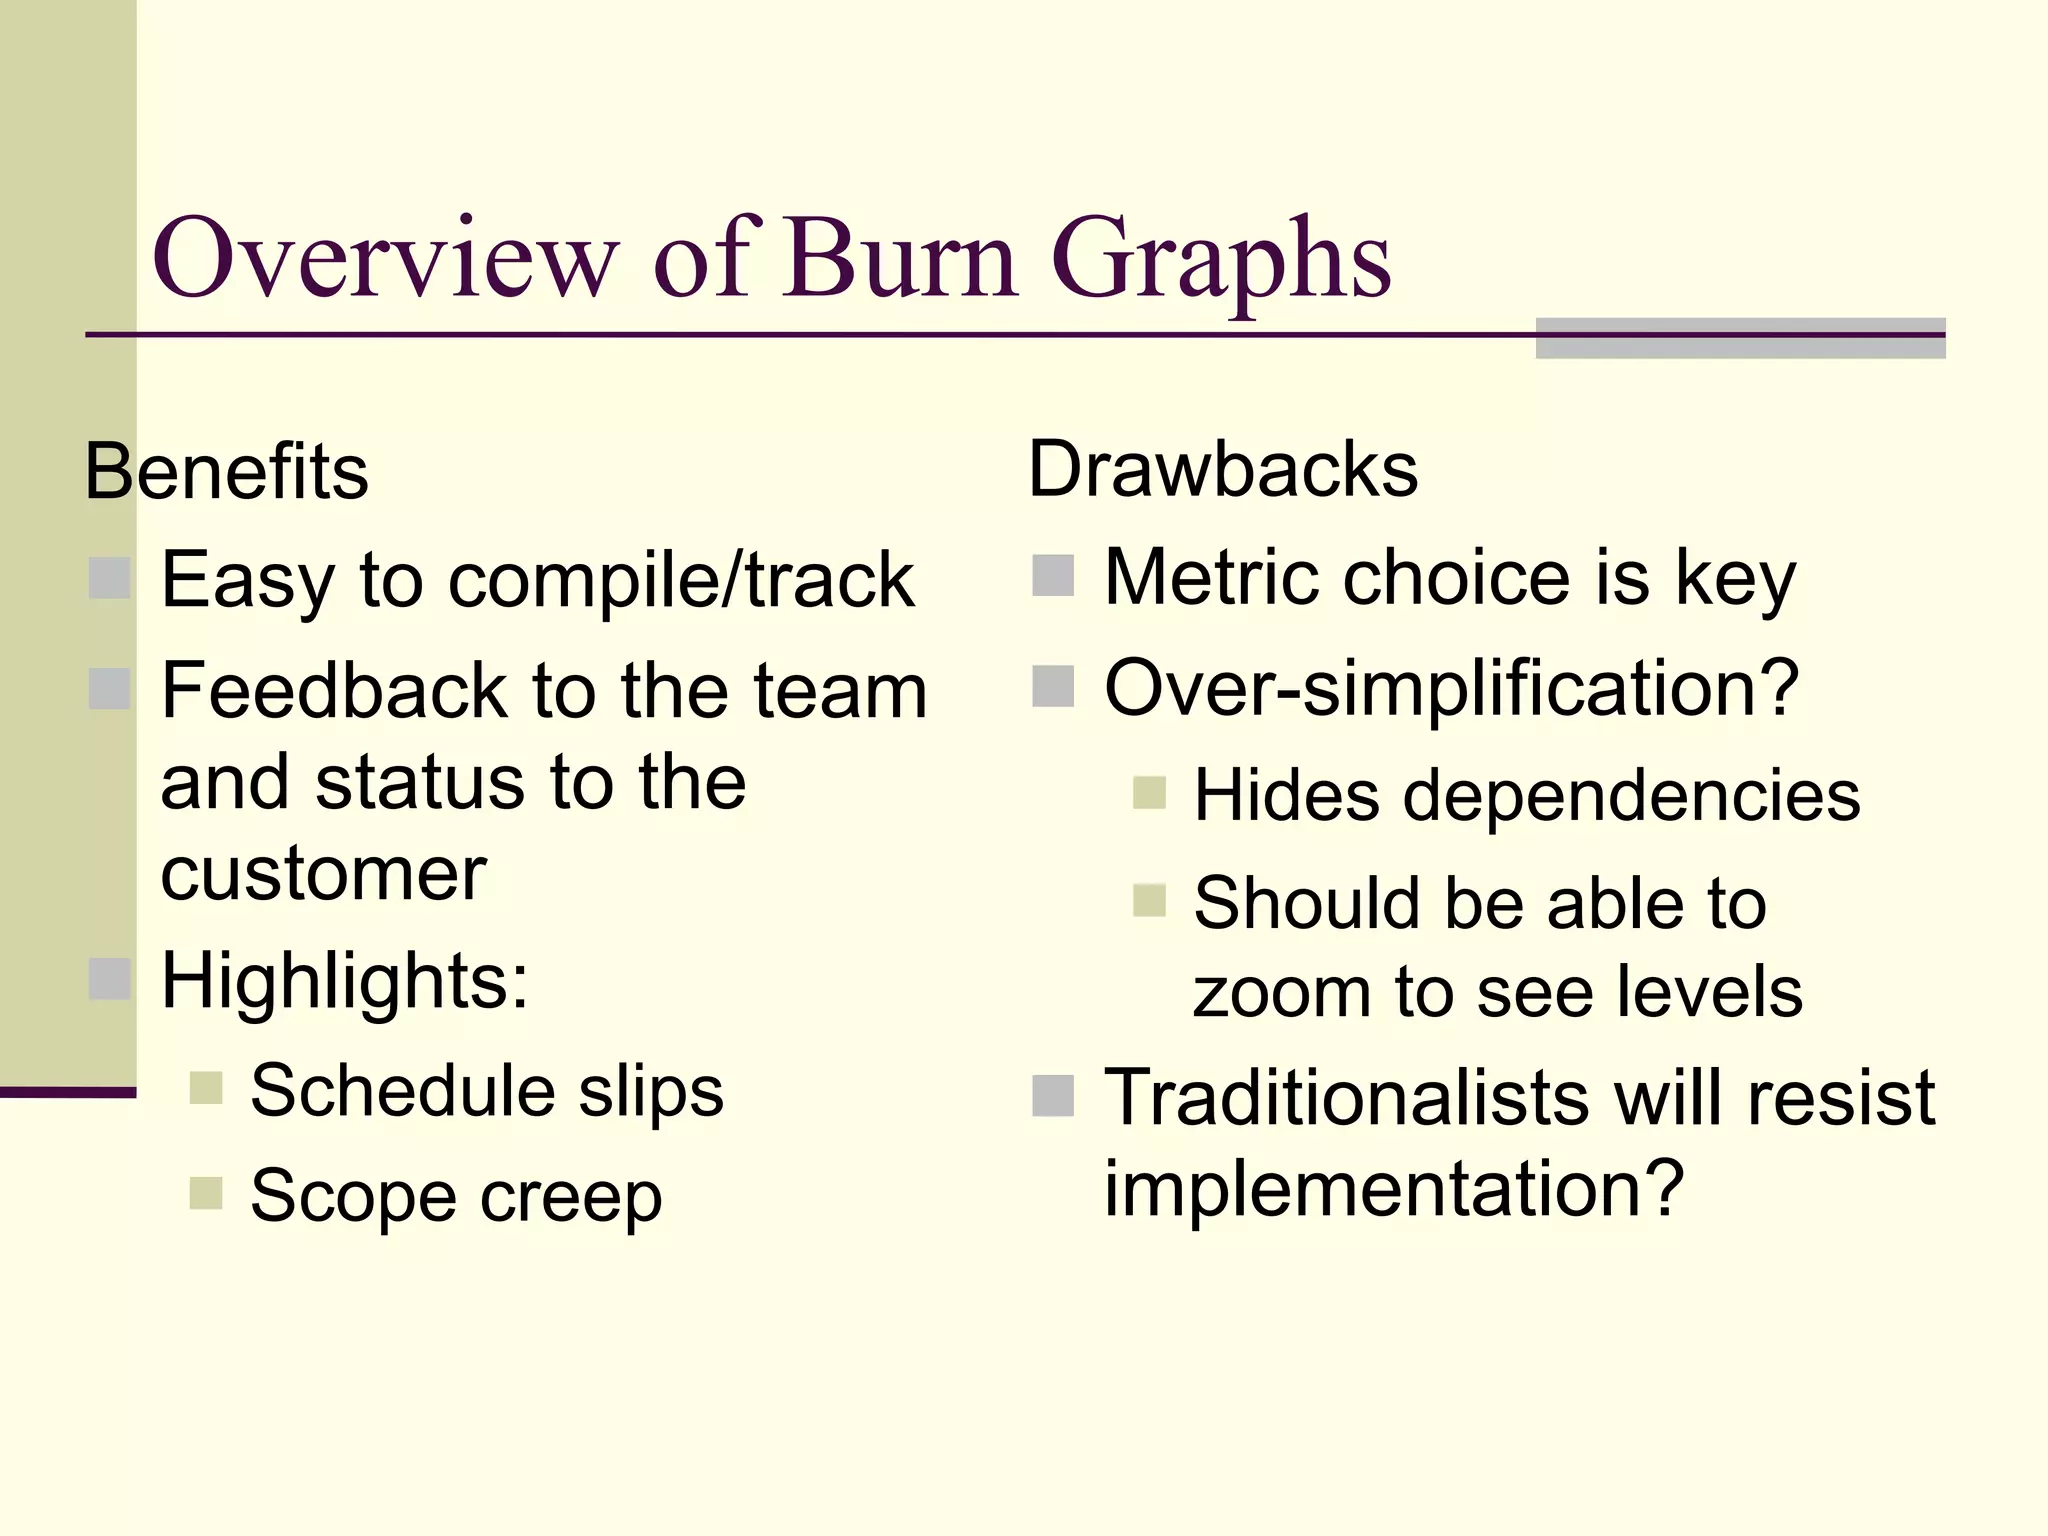

This document discusses project monitoring and control using earned value analysis (EVA) and burn graphs. It provides an overview of EVA, including its origins, explanations of key EVA concepts and metrics, examples of how to apply EVA, and potential shortcomings. It also covers burn graphs as a visual project monitoring tool, how they can be used in agile projects, and examples of burn graph types. Tools for implementing EVA and burn graphs are listed. The document concludes with potential discussion points about applying EVA and adopting burn graphs.


