Downloaded 2,192 times
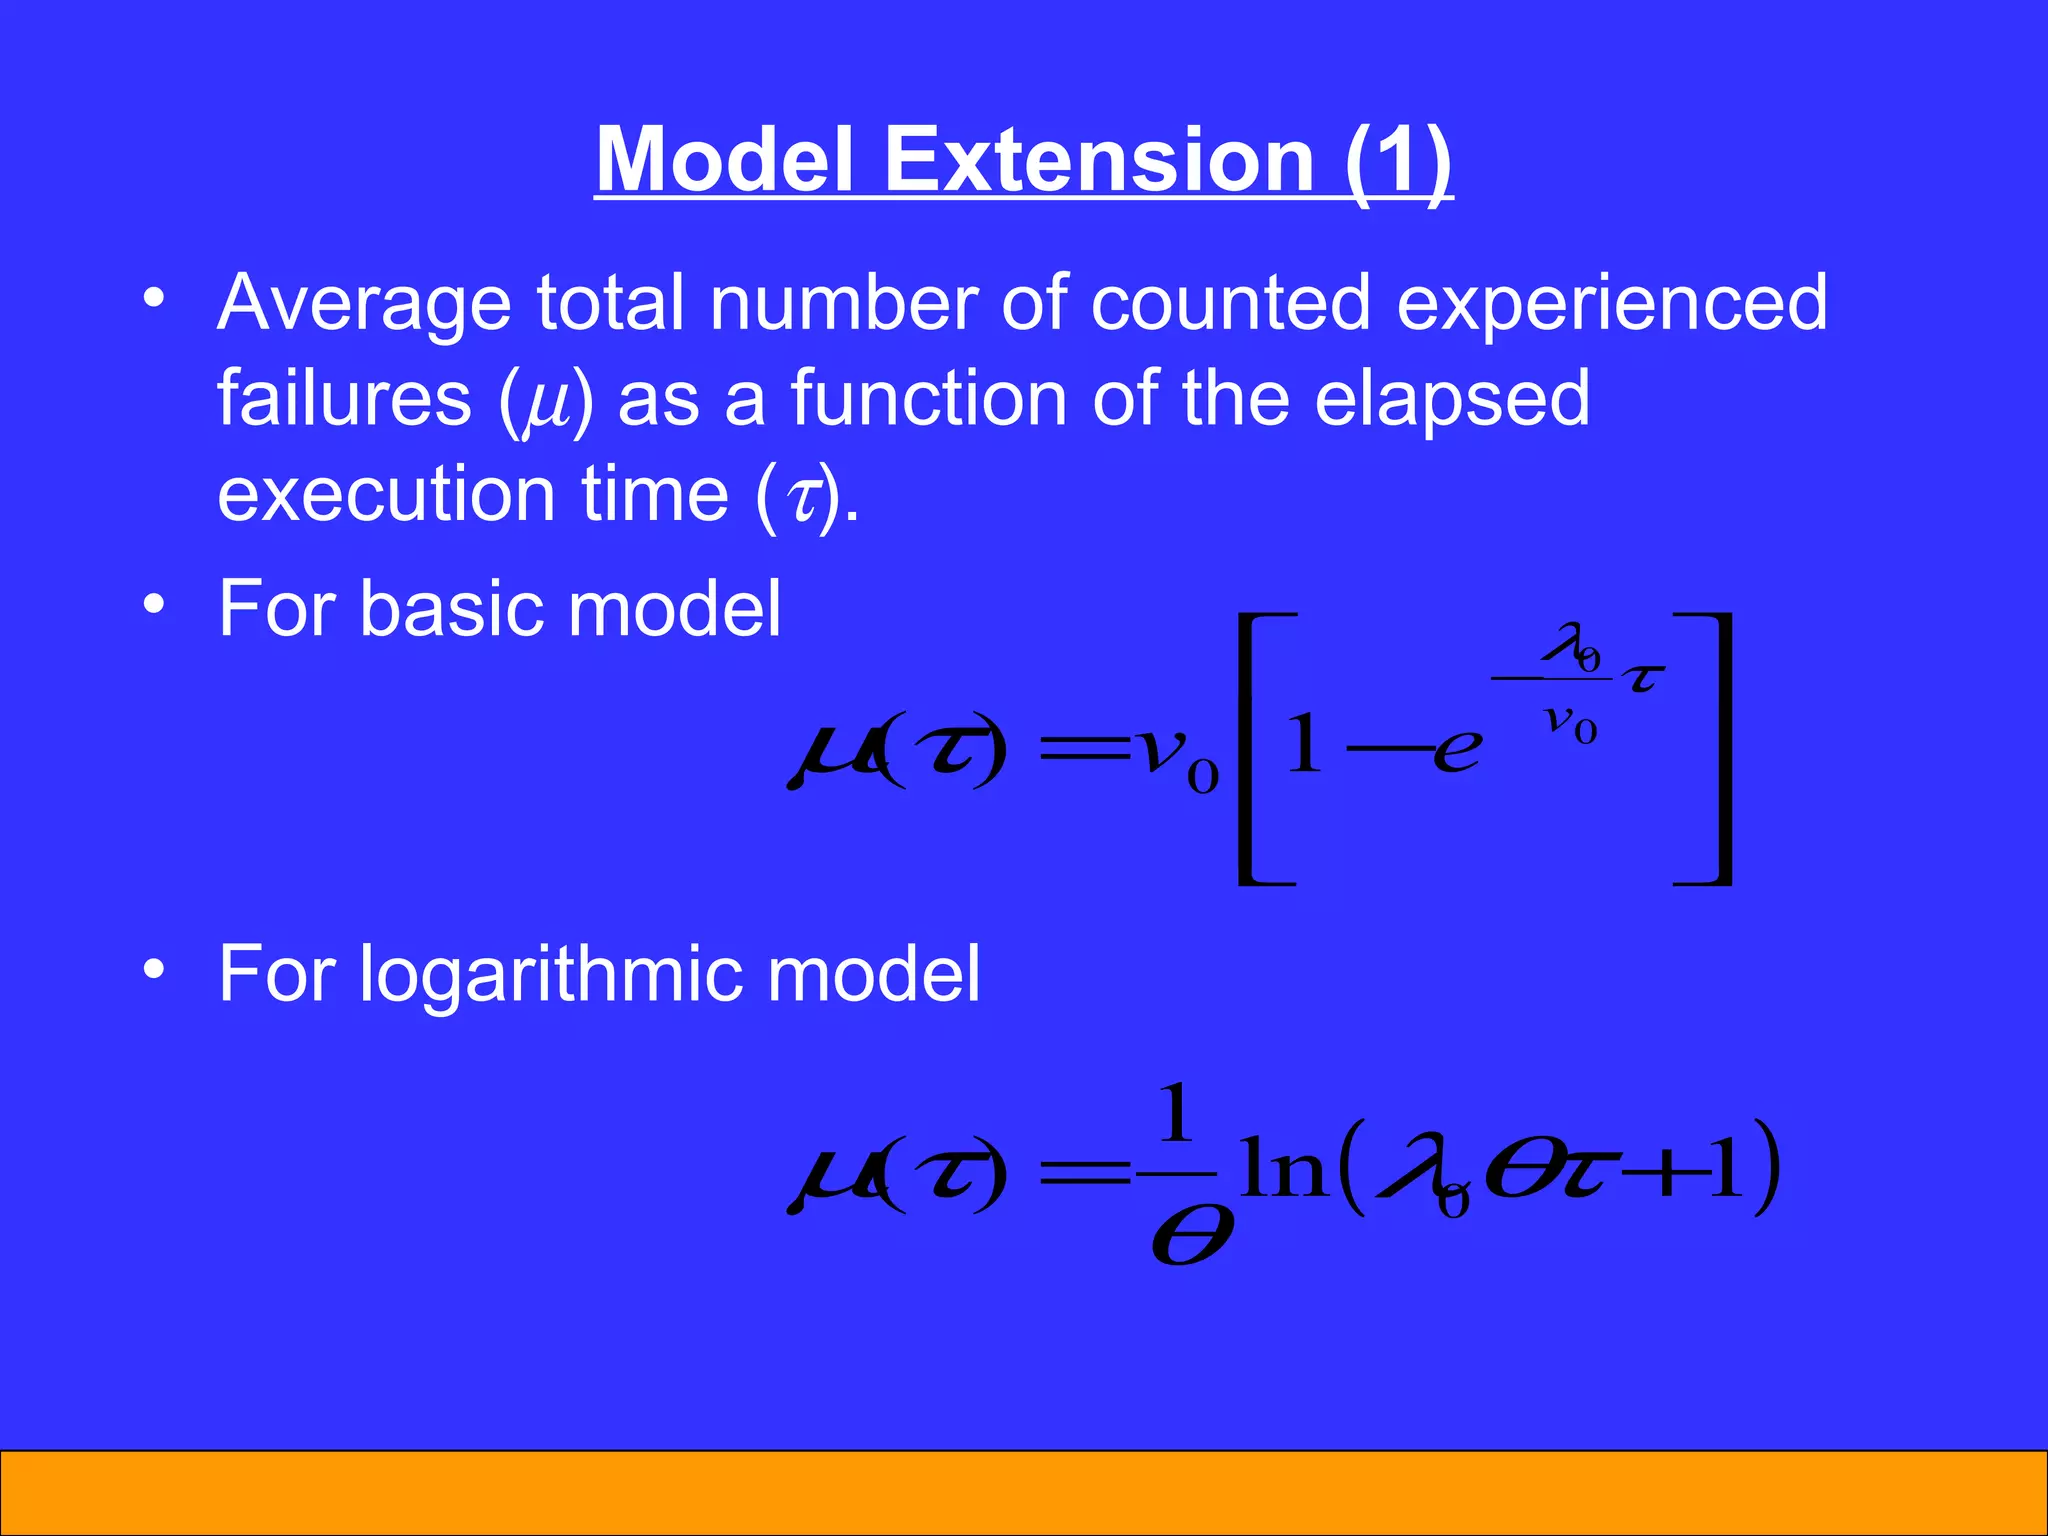
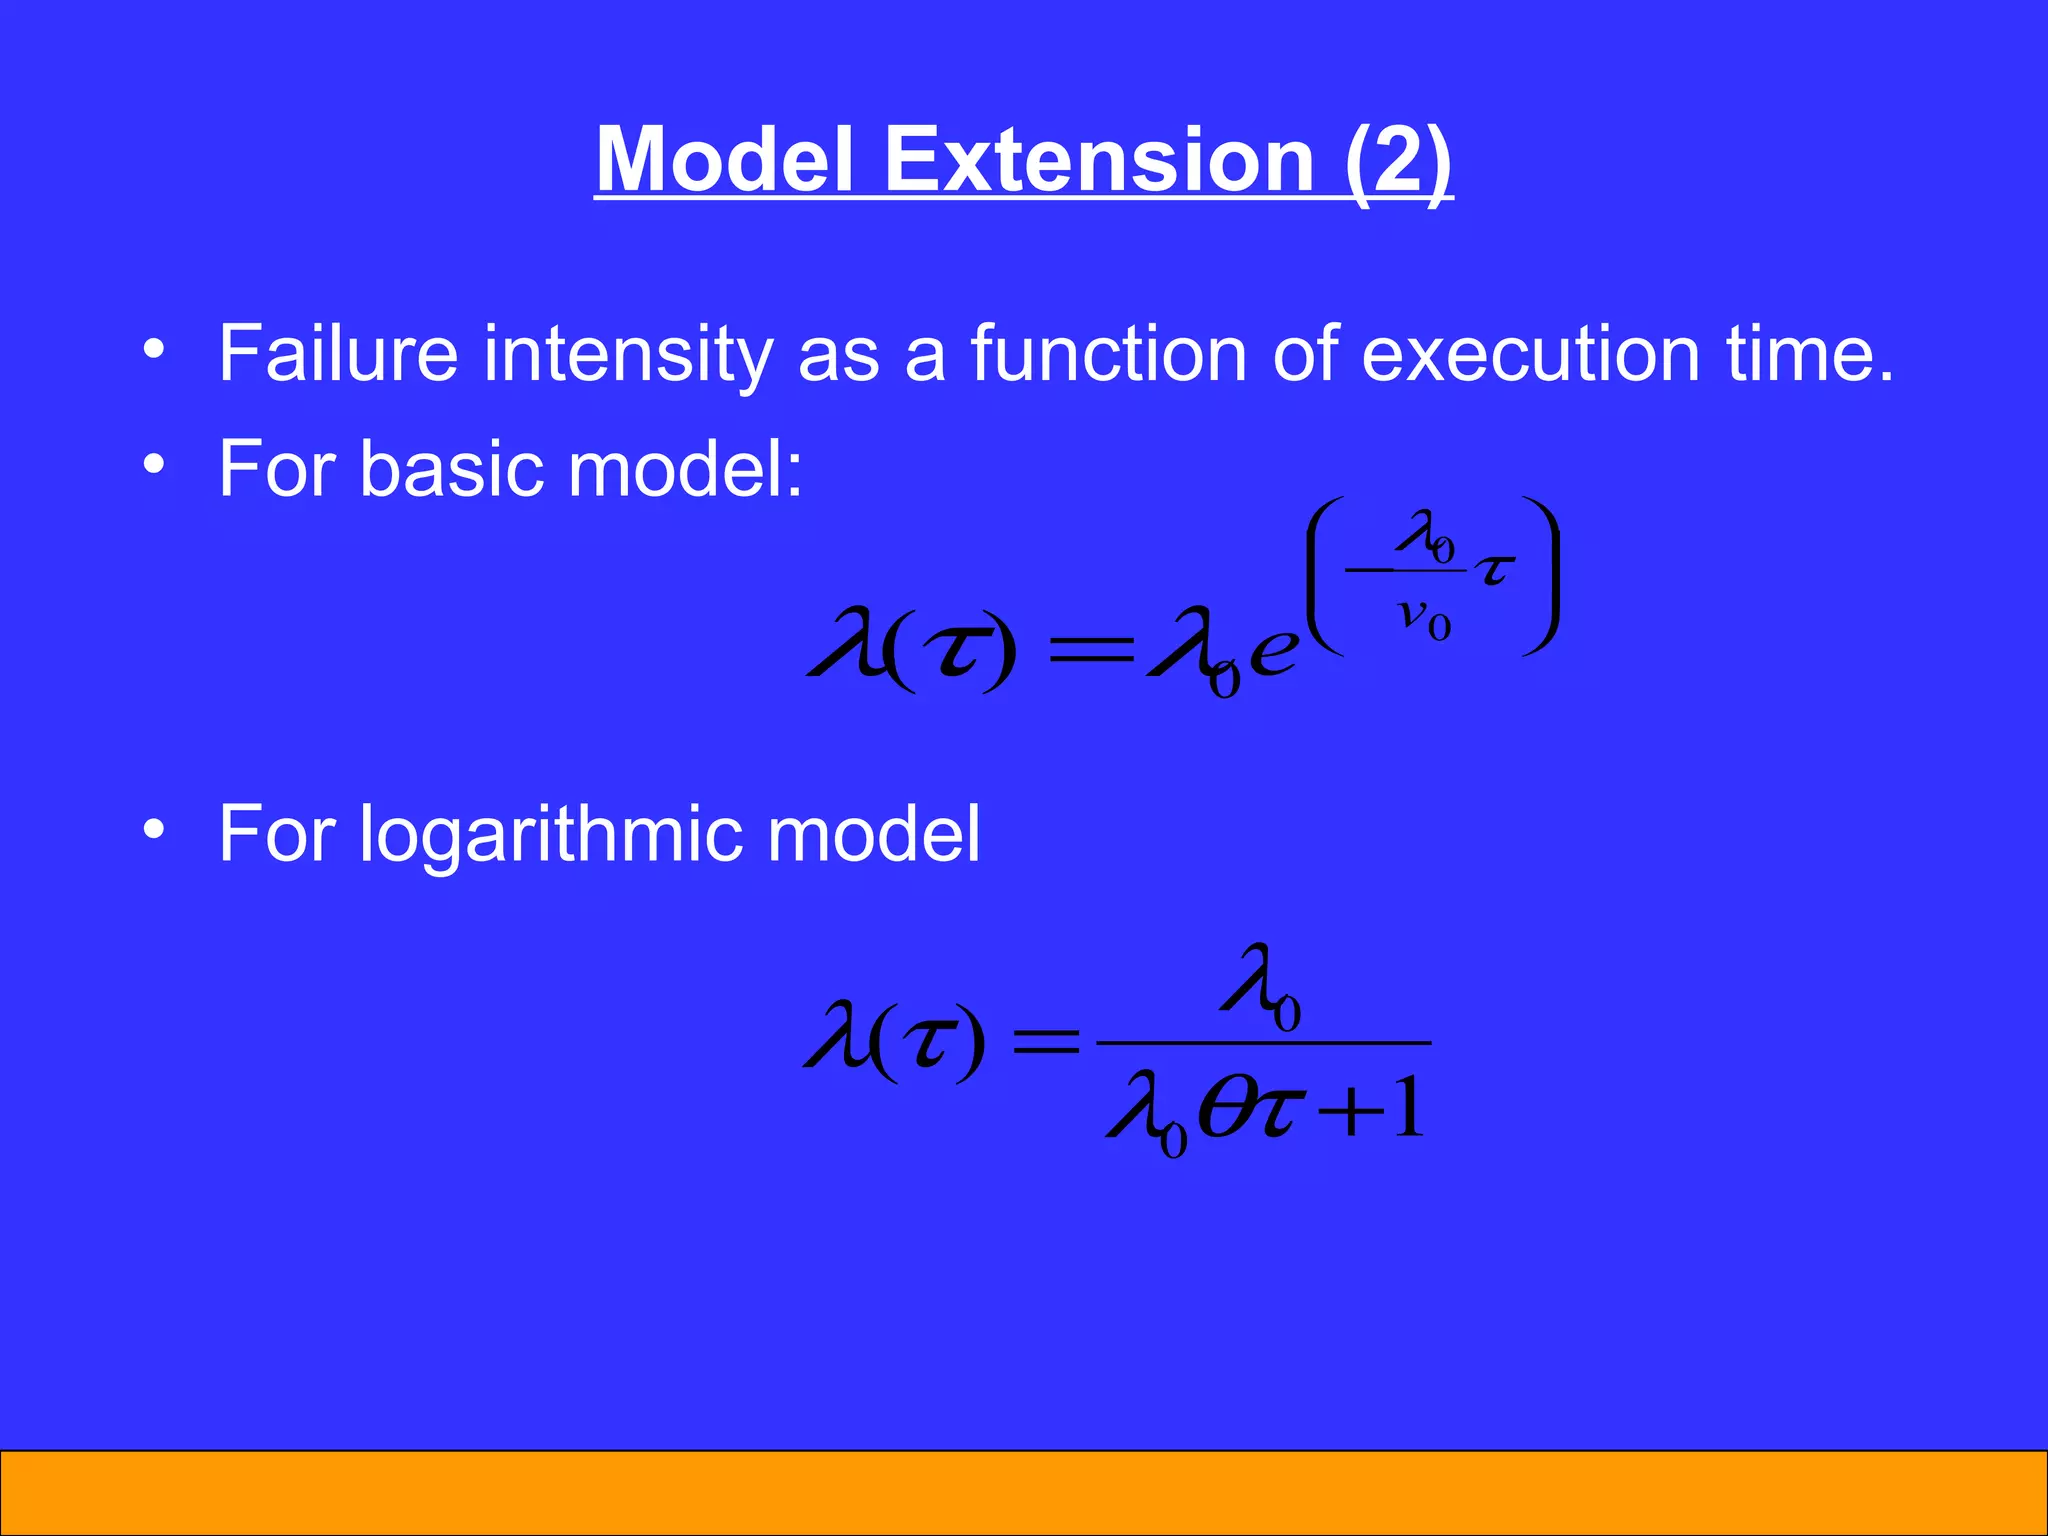
![Example 3 (Basic Model) 0 = 10 [failures/CPU hour]. v 0 = 100 (number of failures over infinite execution time). = 10 CPU hours: = 100 CPU hours:](https://image.slidesharecdn.com/softwarereliabilitypkp2003-120303013614-phpapp01/75/Software-reliability-34-2048.jpg)
![Example 4 (Logarithmic Model) 0 = 10 [failures/CPU hour]. = 0.02 / failure. = 10 CPU hours: = 100 CPU hours: (63 in basic model) (100 in basic model)](https://image.slidesharecdn.com/softwarereliabilitypkp2003-120303013614-phpapp01/75/Software-reliability-35-2048.jpg)
![Example 5 (Basic Model) 0 = 10 [failures/CPU hour]. v 0 = 100 (number of failures over infinite execution time). = 10 CPU hours: = 100 CPU hours:](https://image.slidesharecdn.com/softwarereliabilitypkp2003-120303013614-phpapp01/75/Software-reliability-37-2048.jpg)
![Example 6 (Logarithmic Model) 0 = 10 [failures/CPU hour]. = 0.02 / failure. = 10 CPU hours: = 100 CPU hours: (3.68 in basic model) (0.000454 in basic model)](https://image.slidesharecdn.com/softwarereliabilitypkp2003-120303013614-phpapp01/75/Software-reliability-38-2048.jpg)
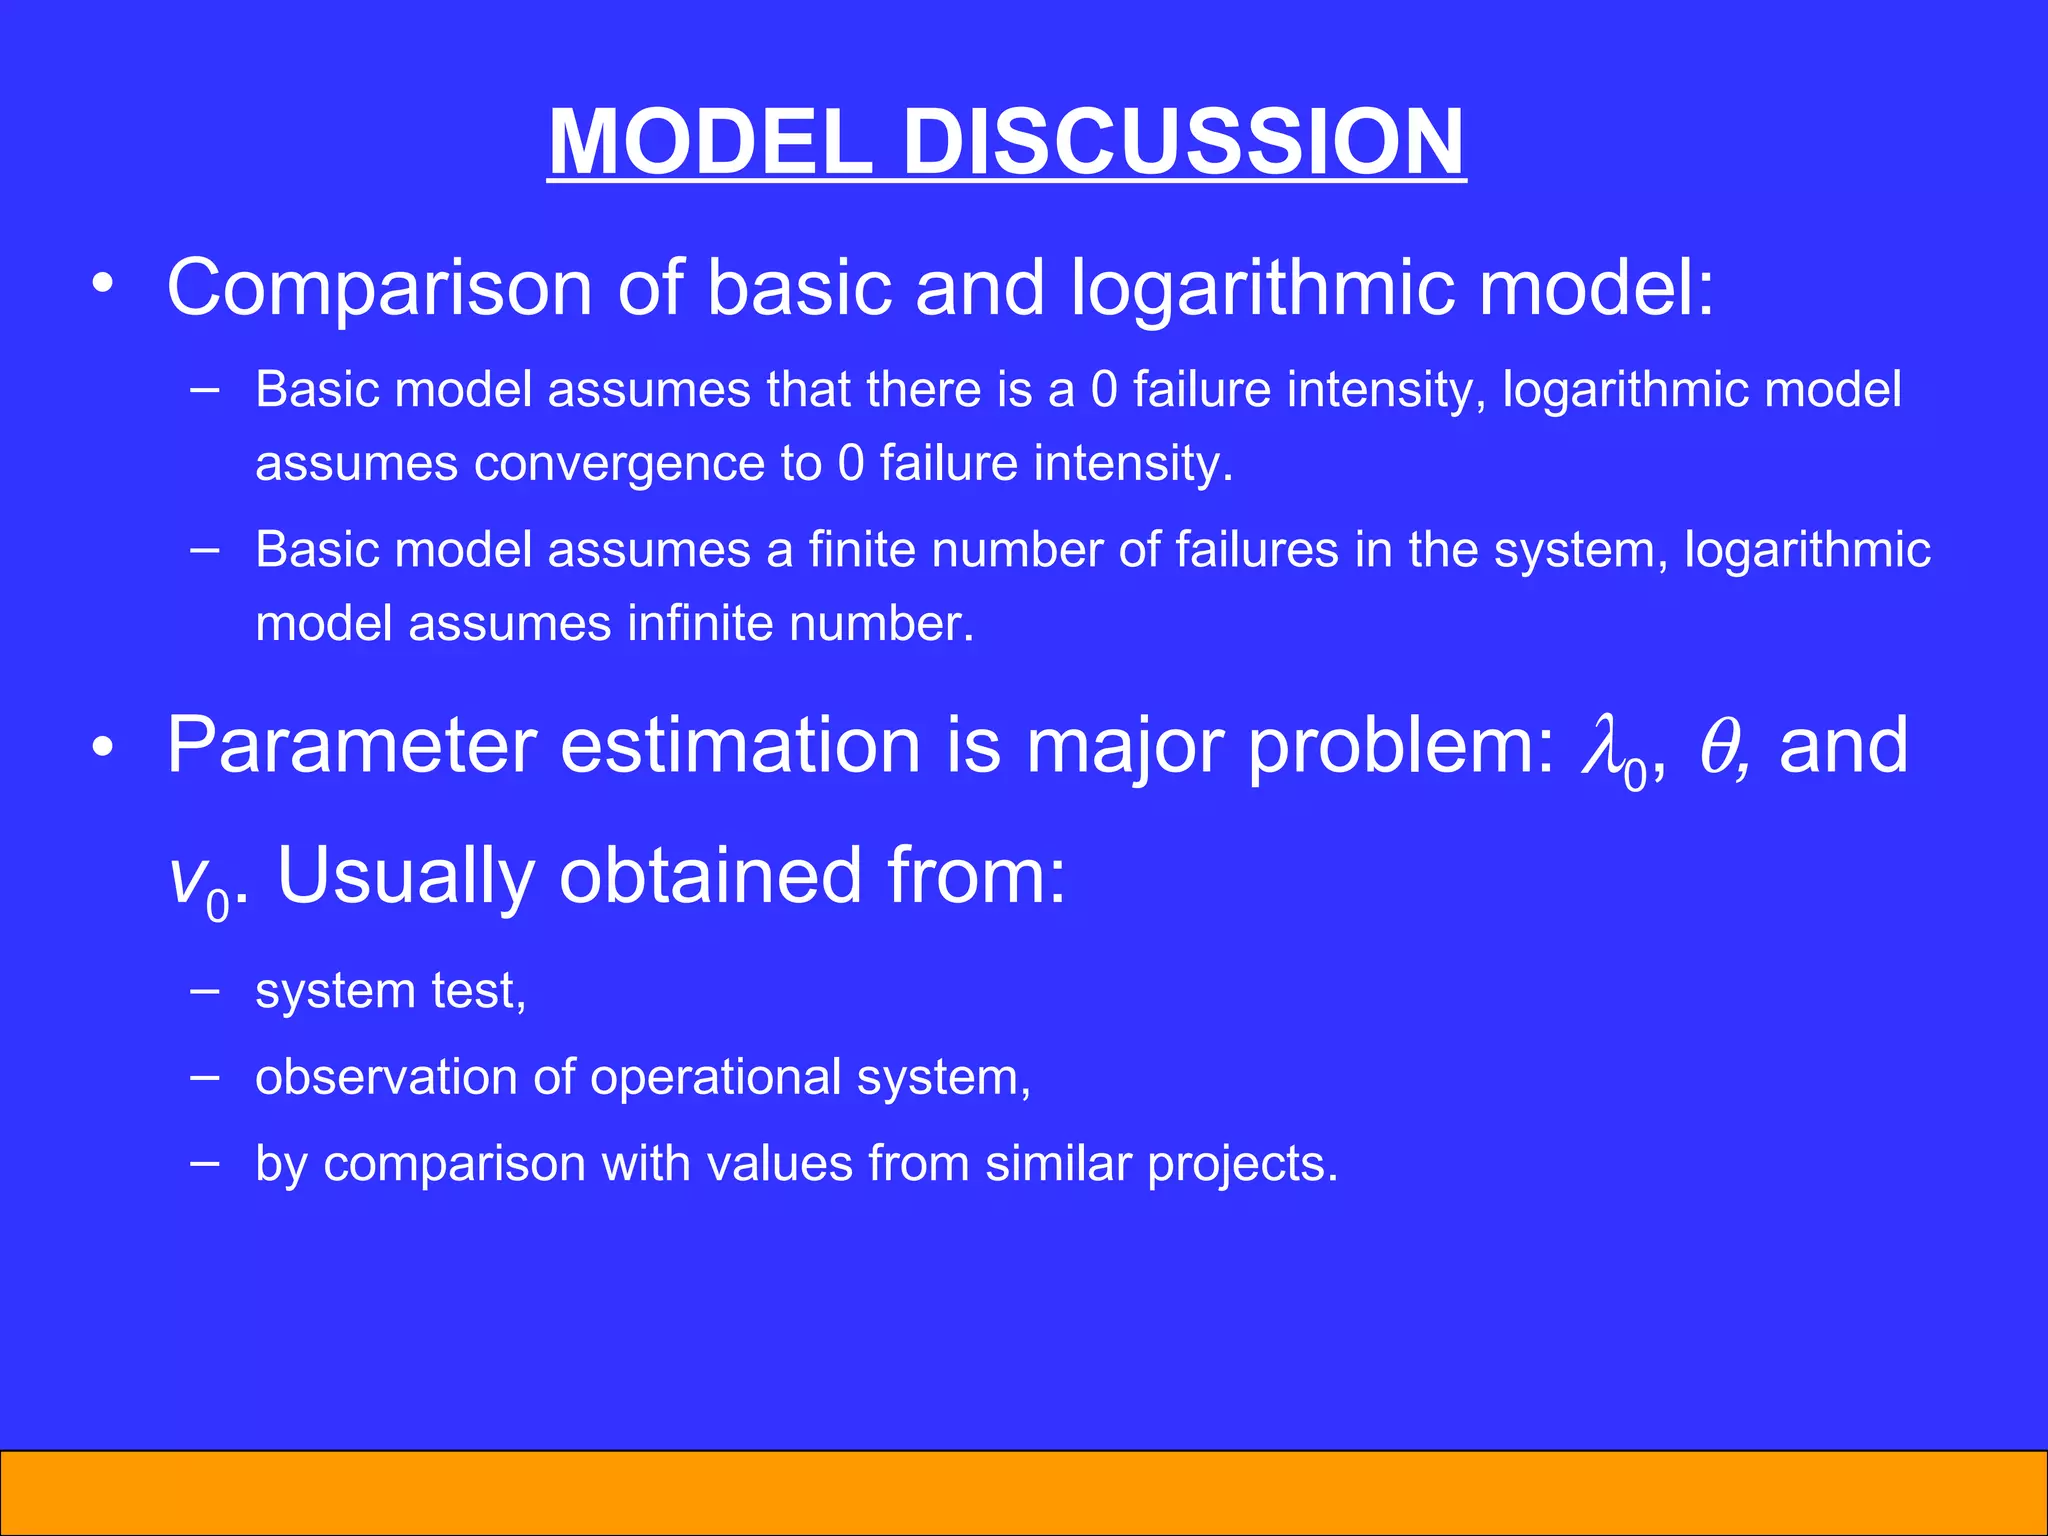
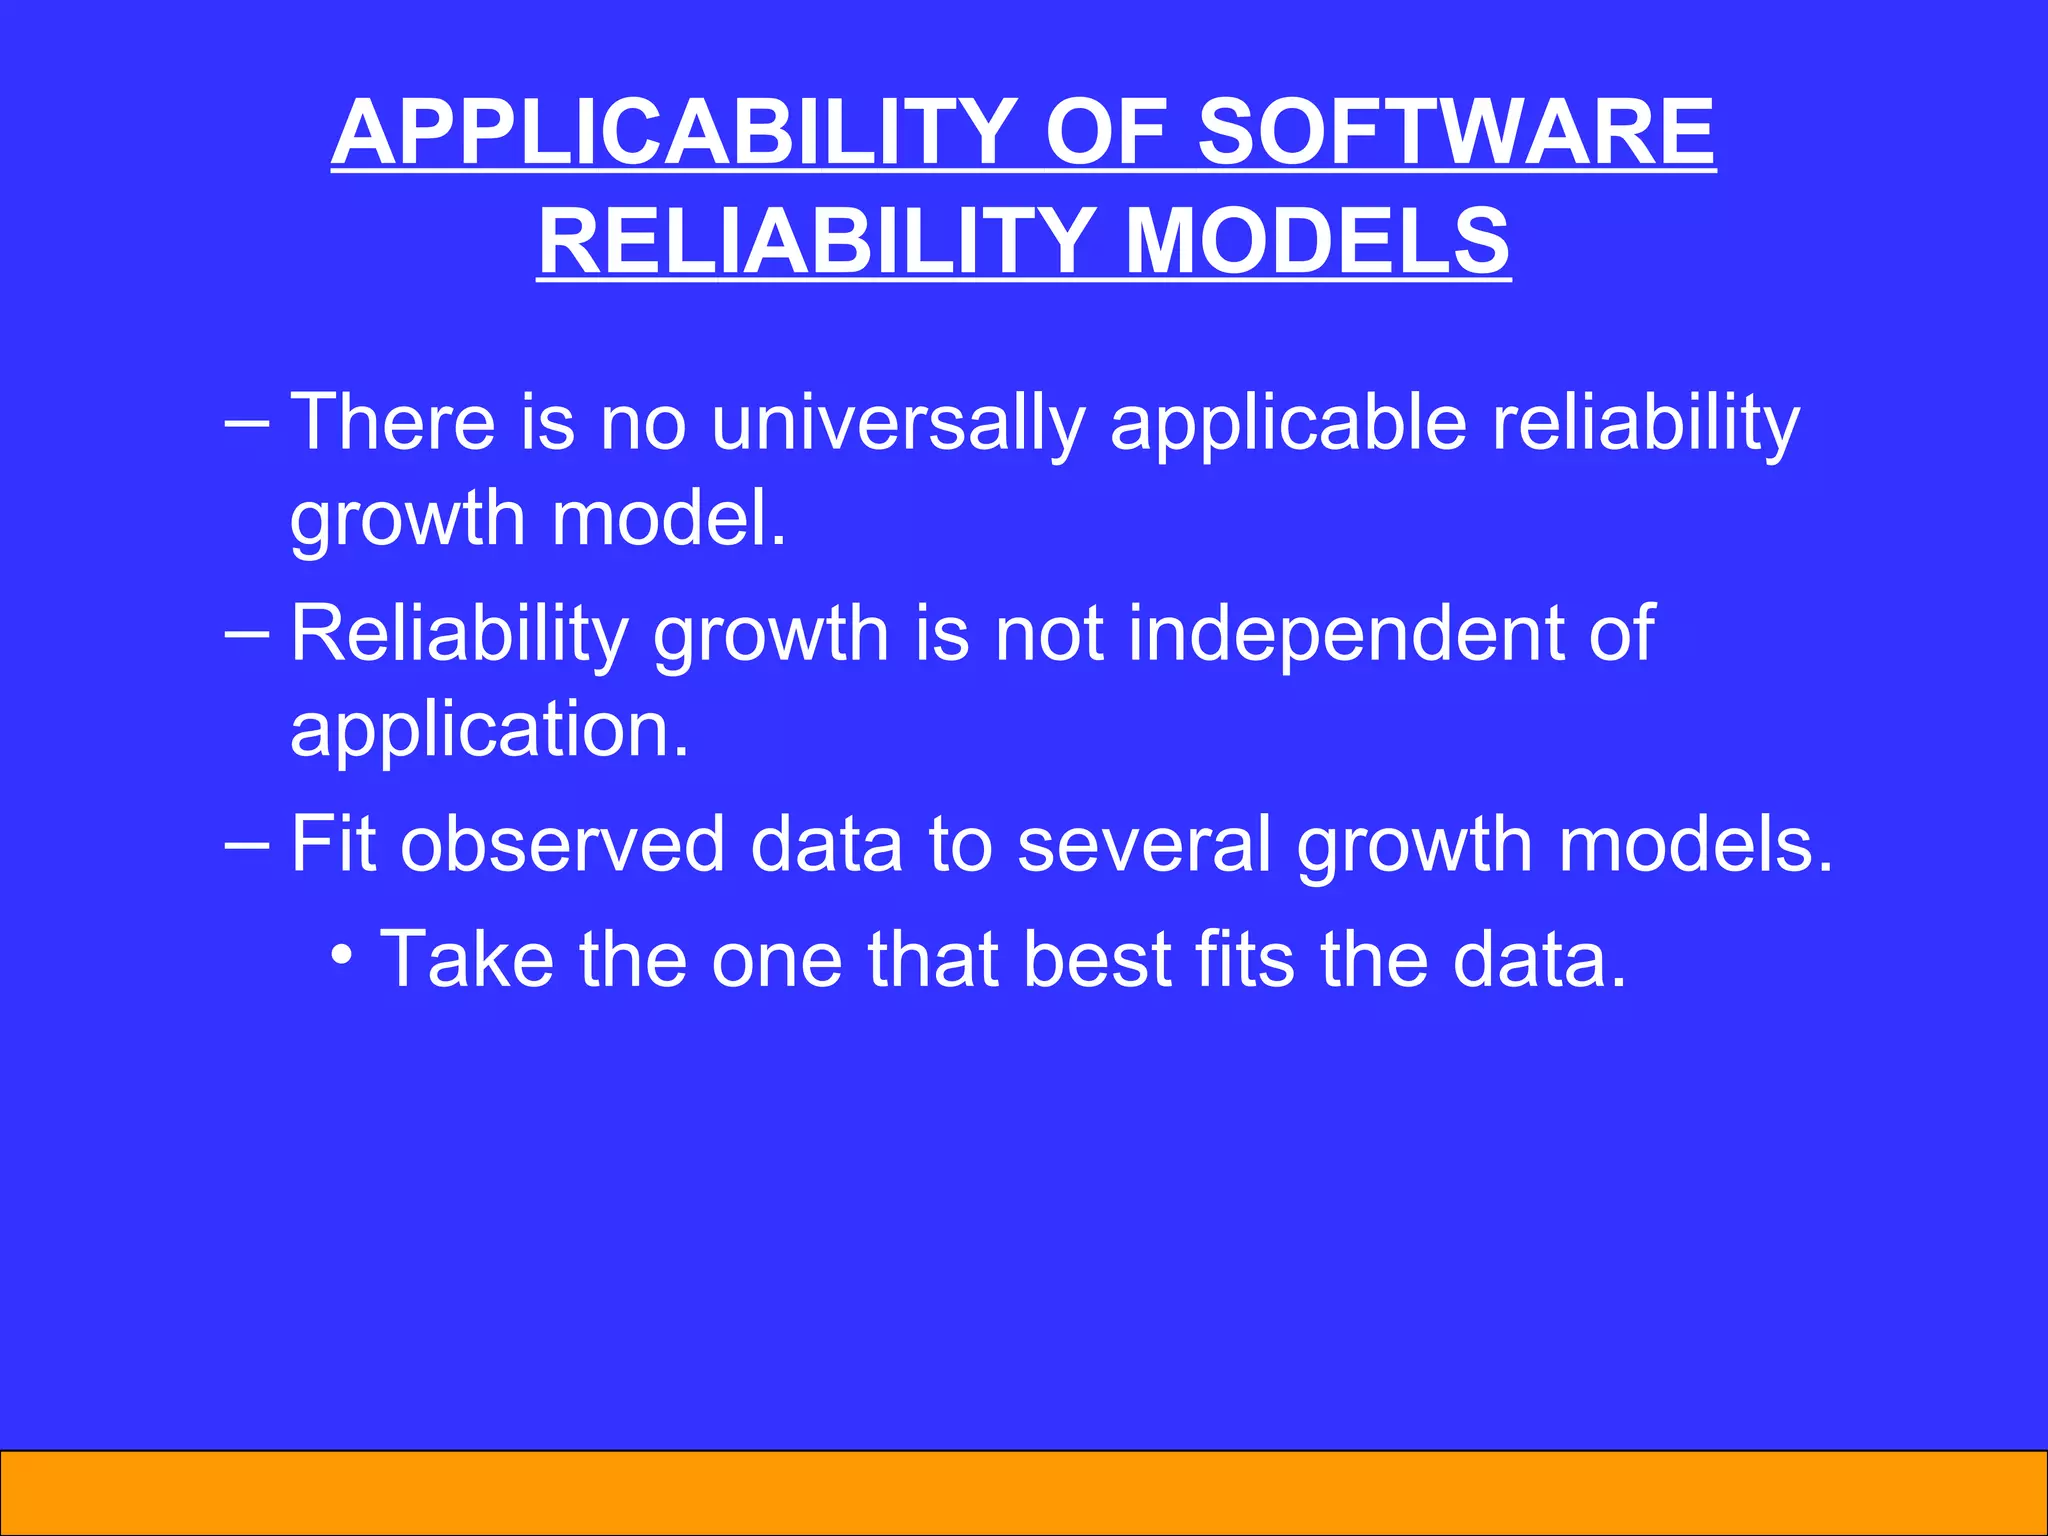

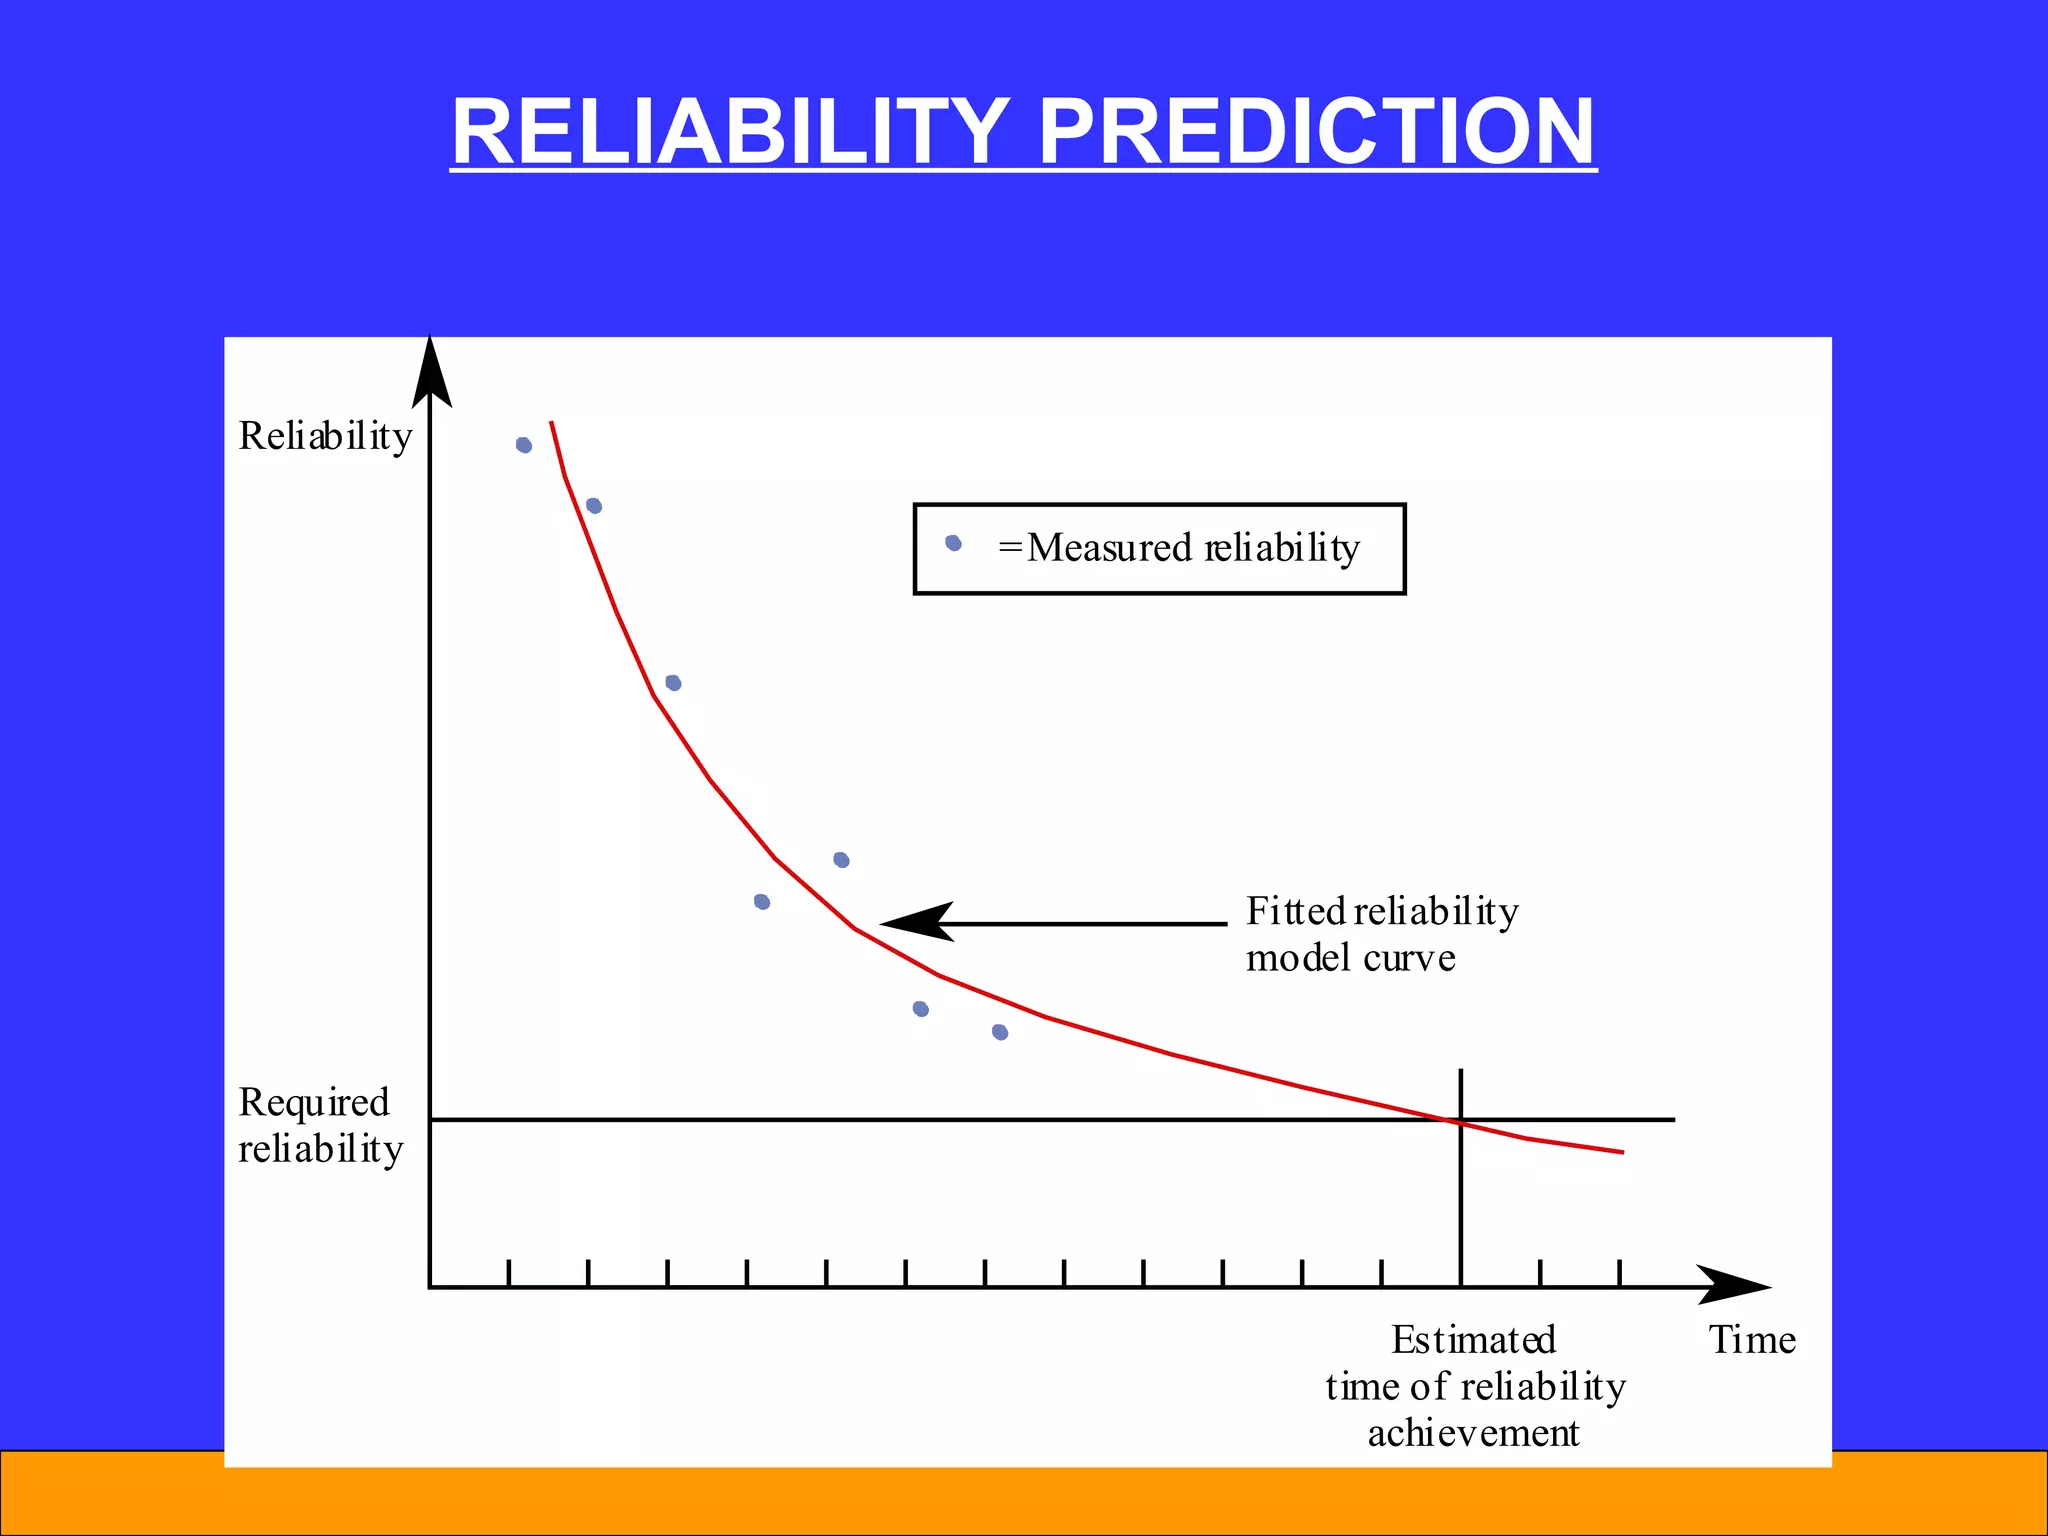


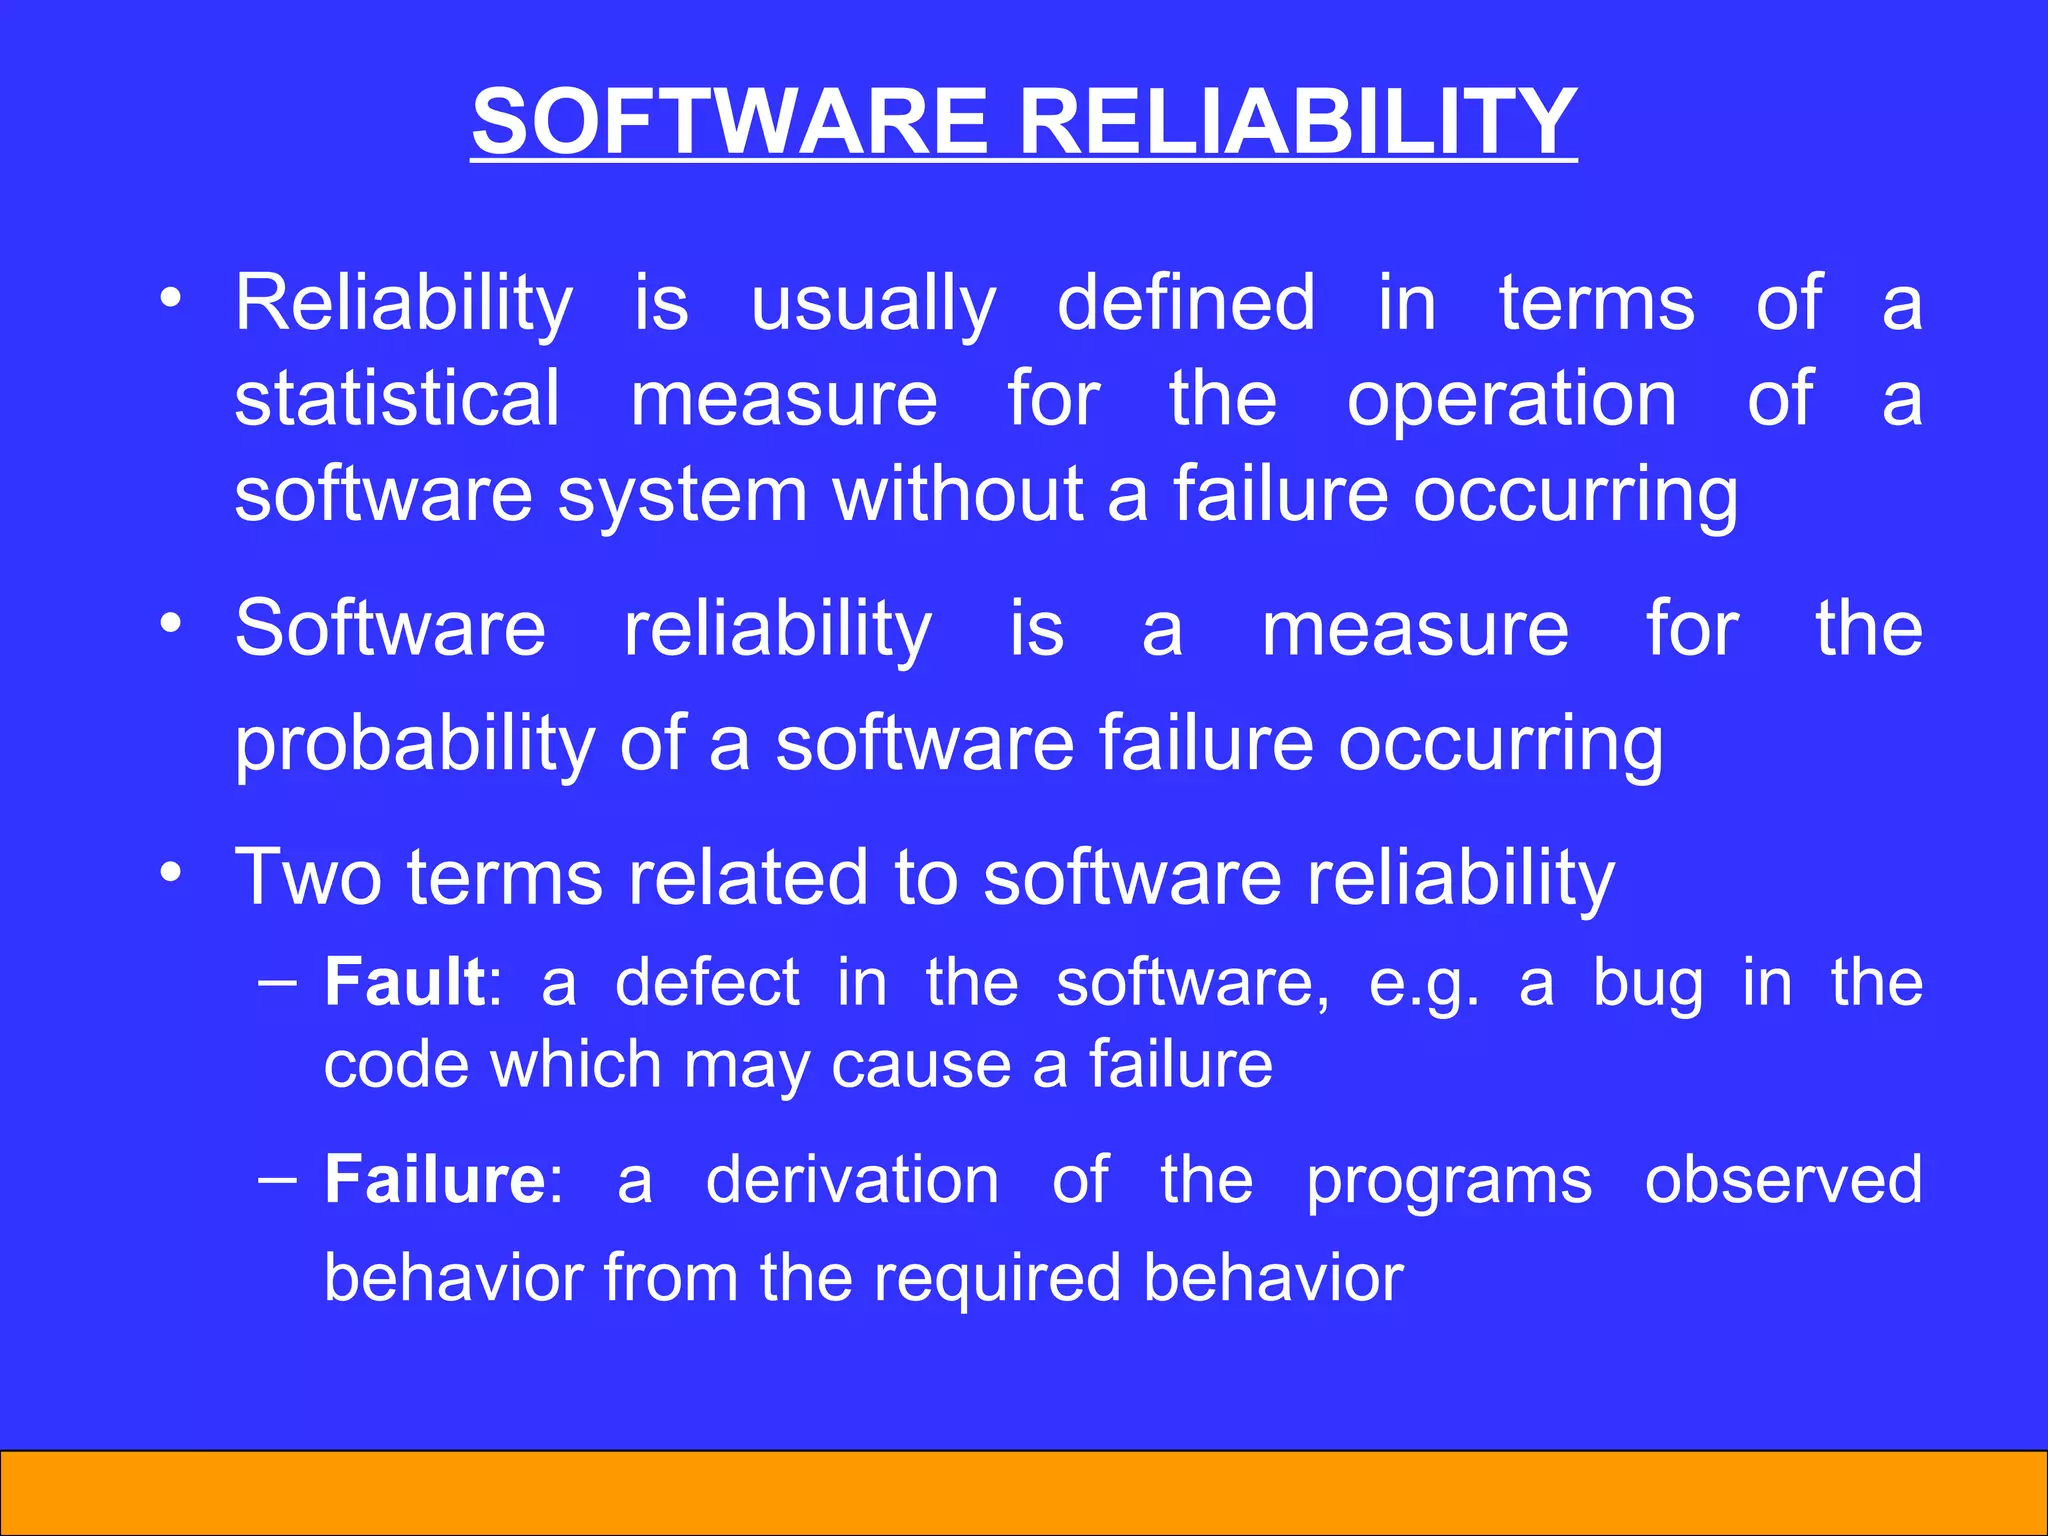
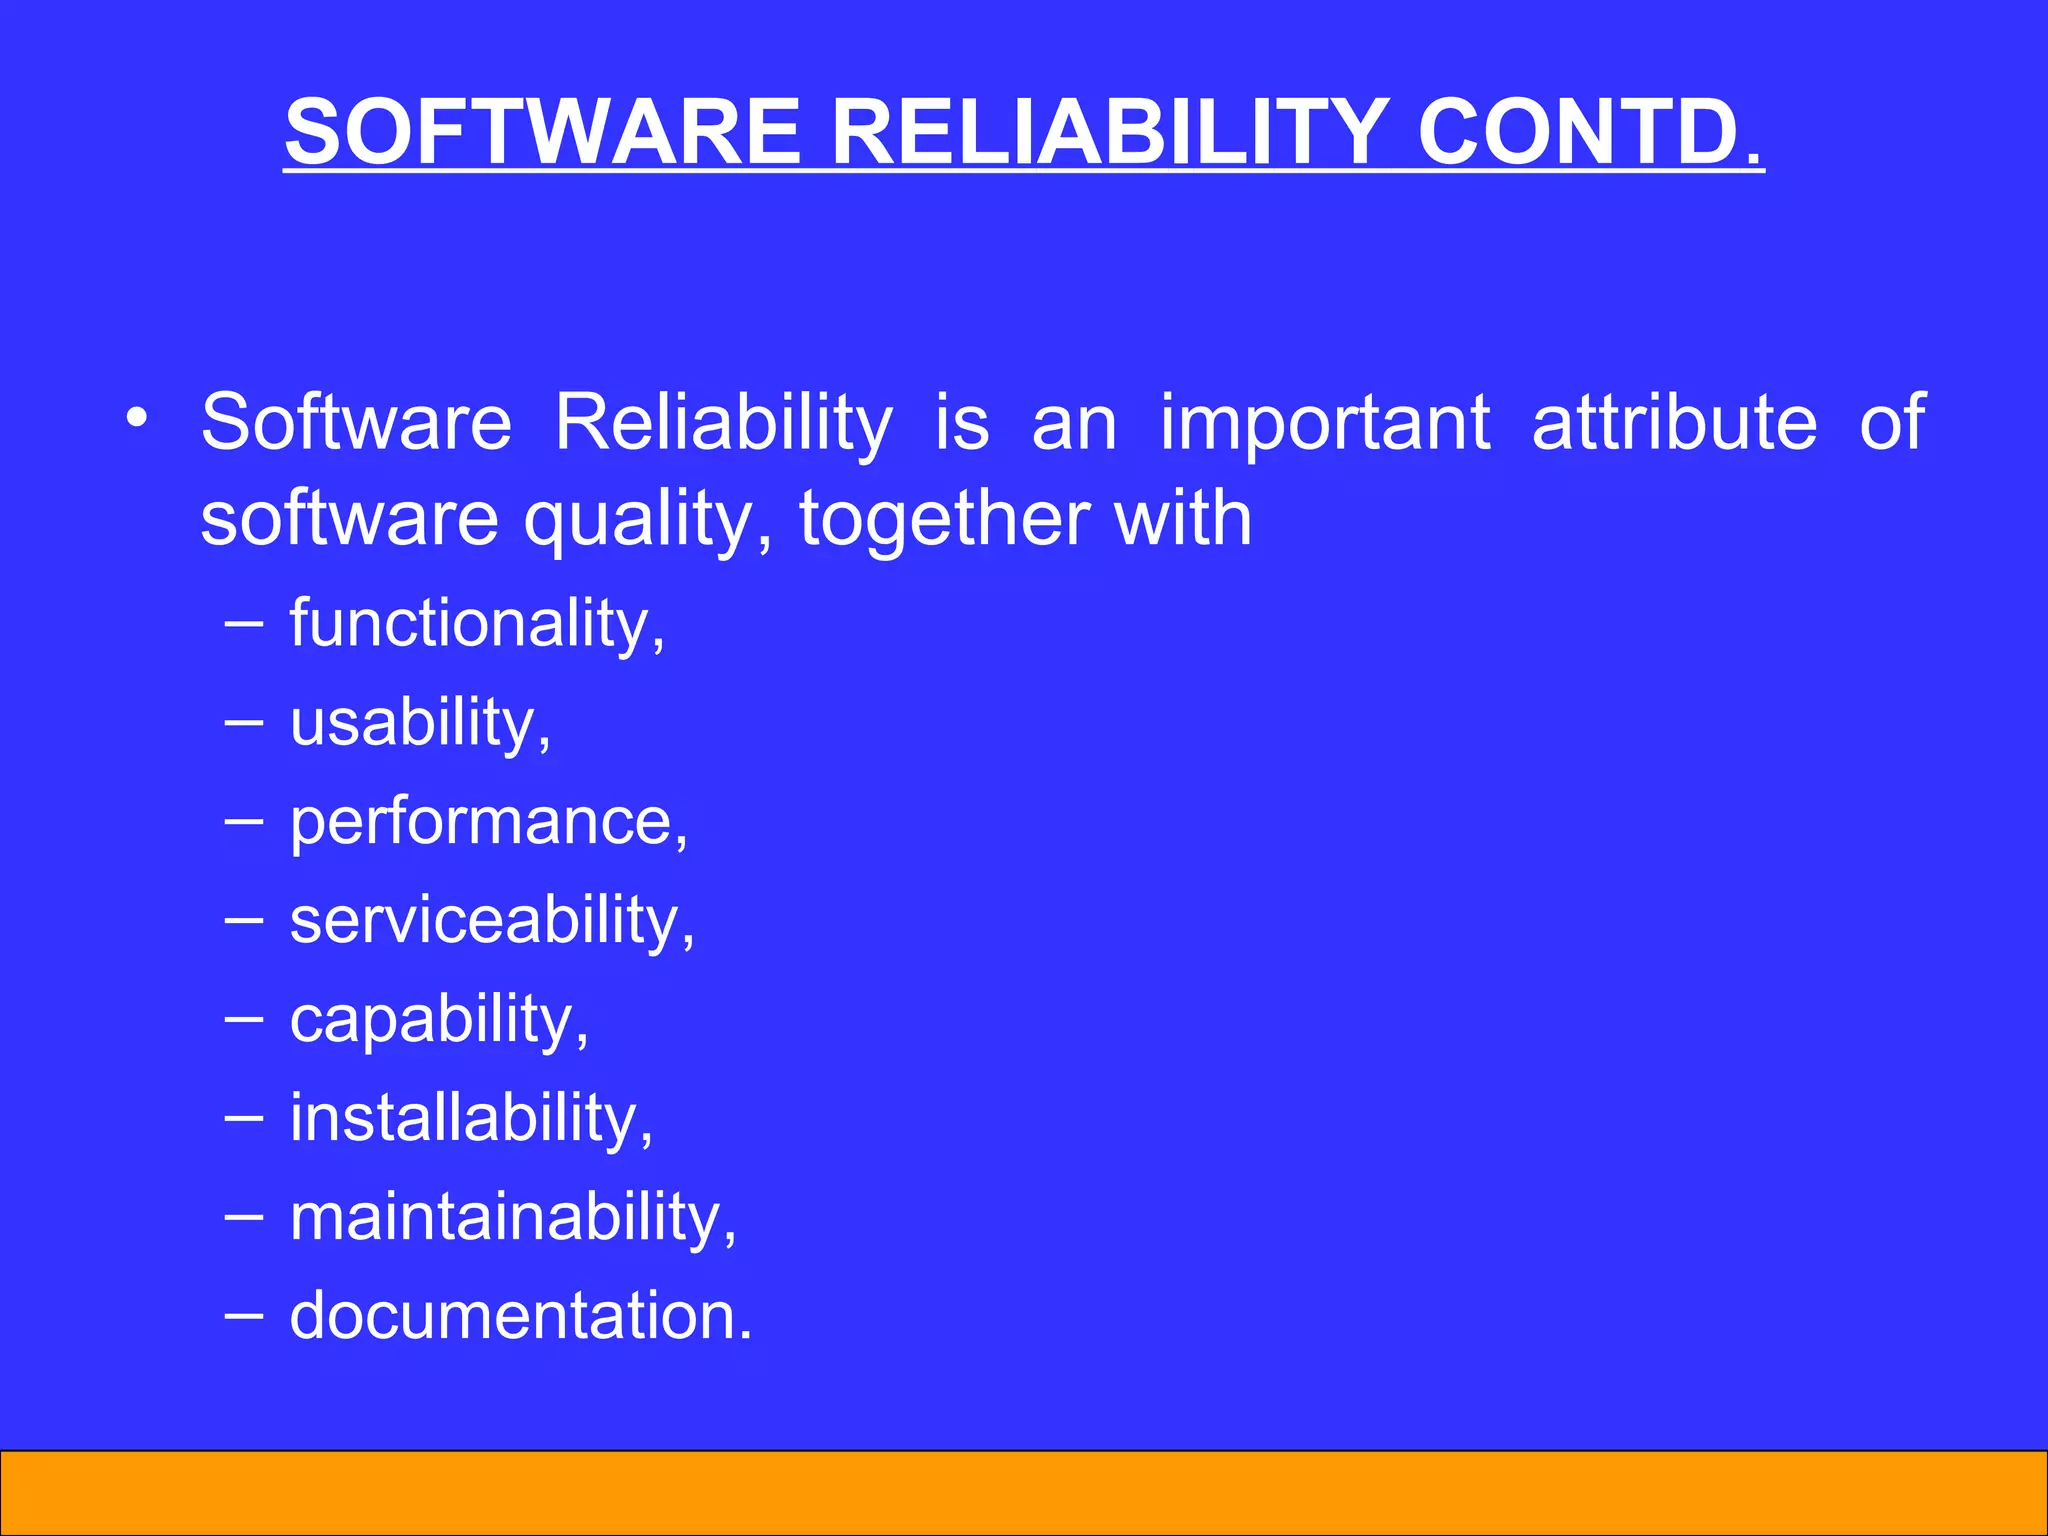
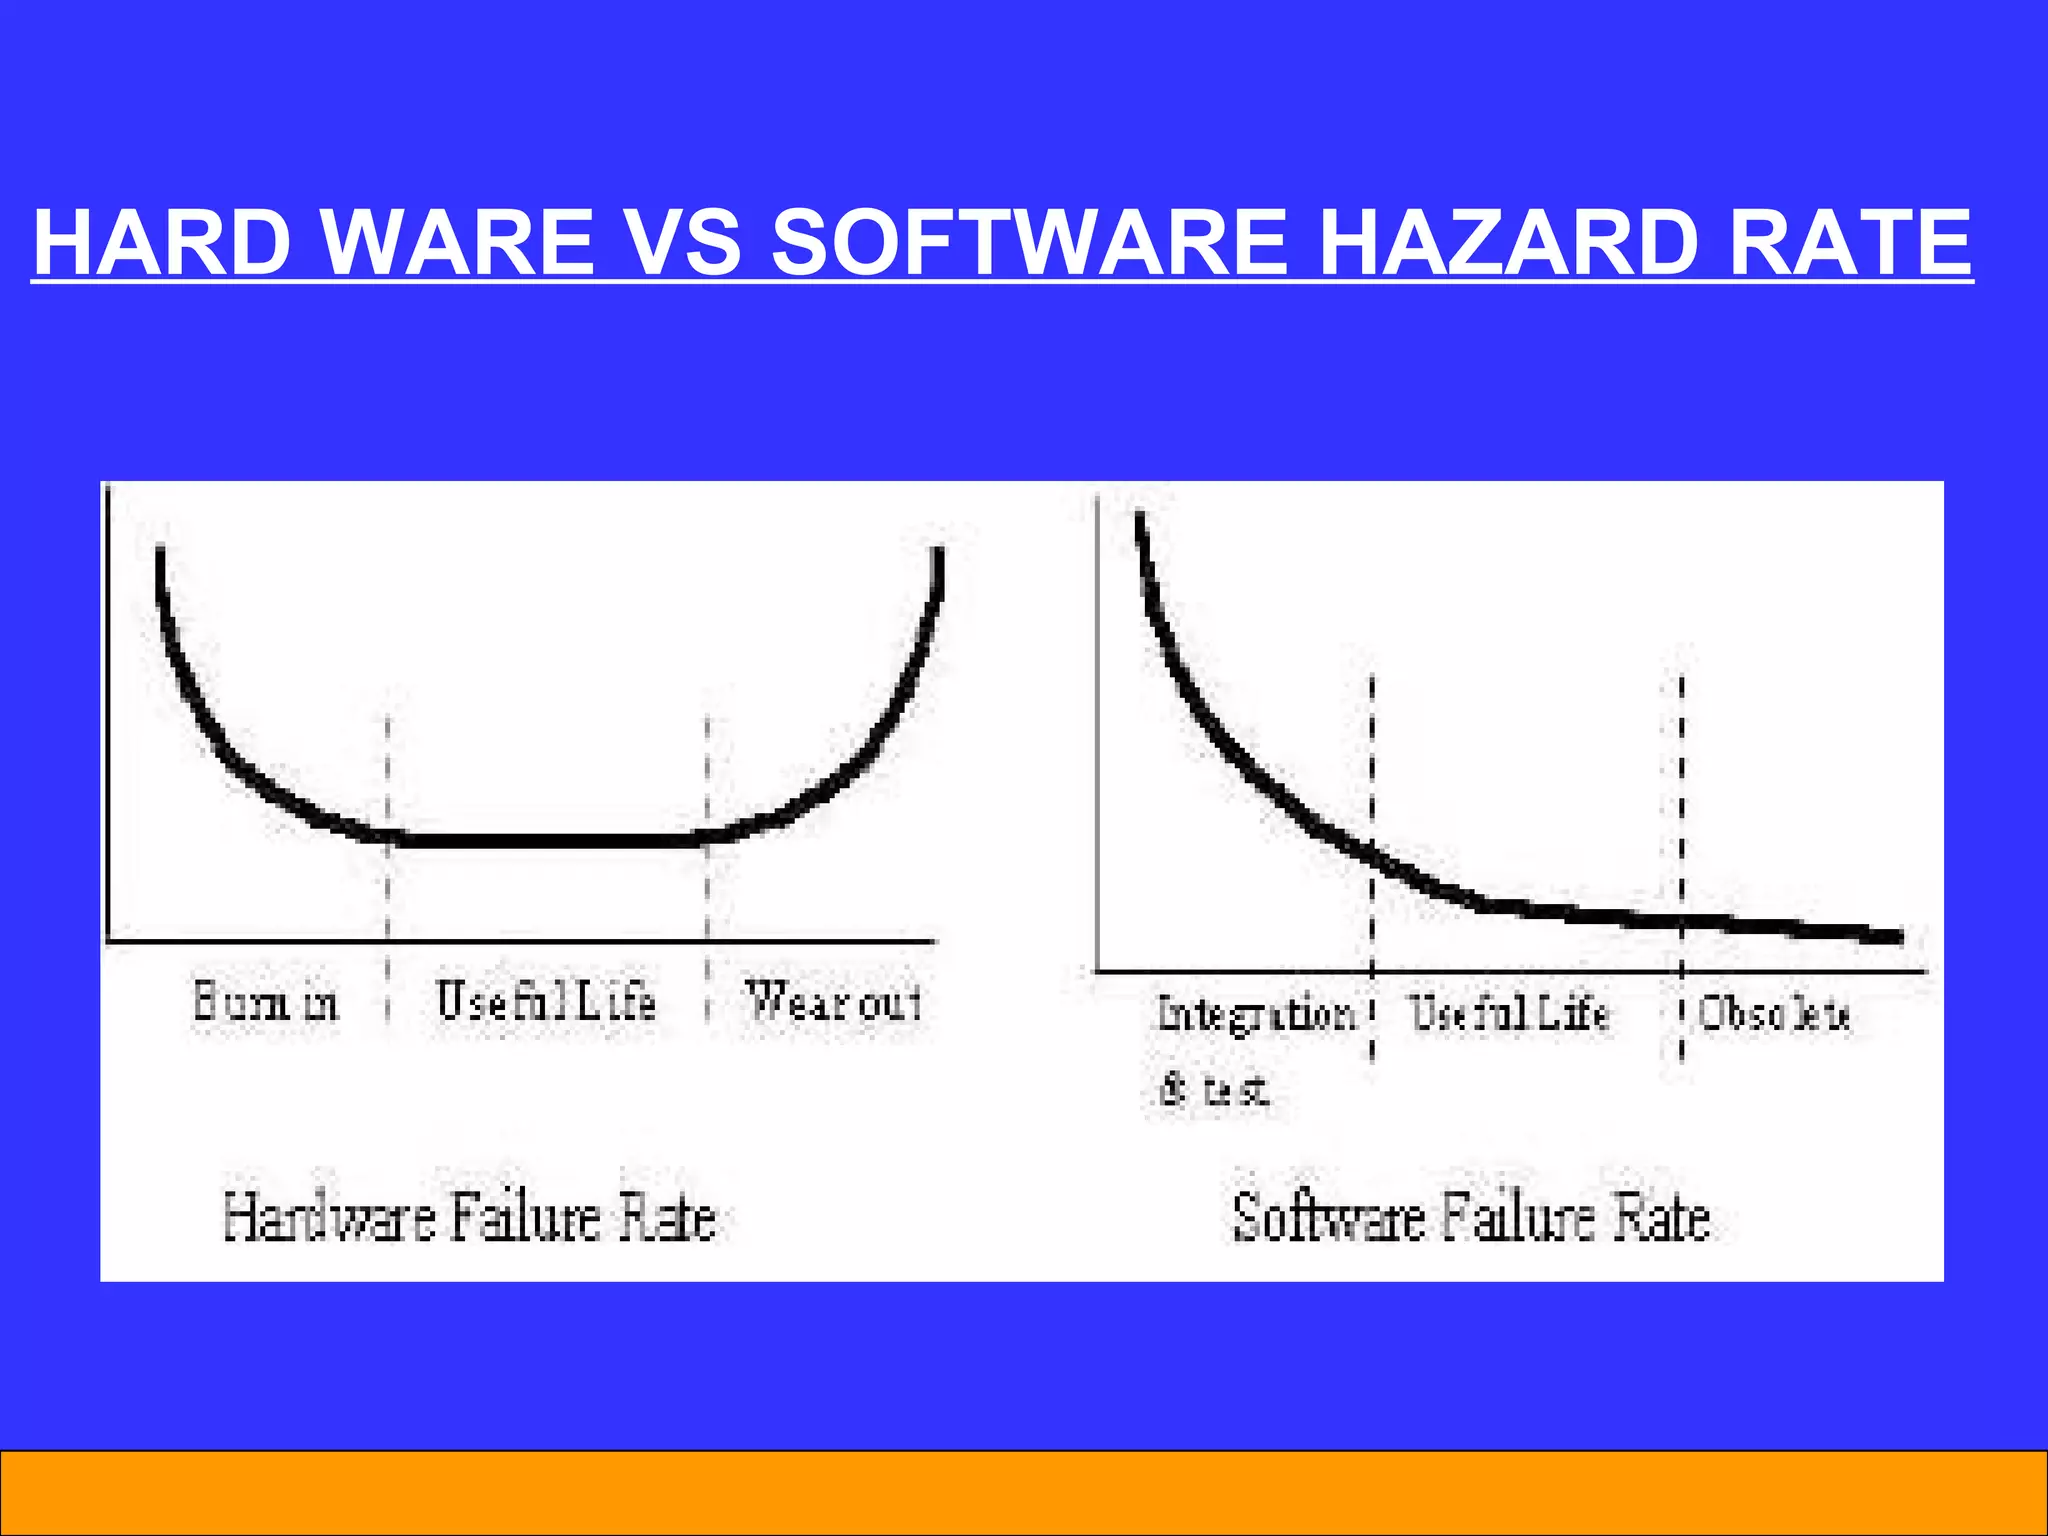
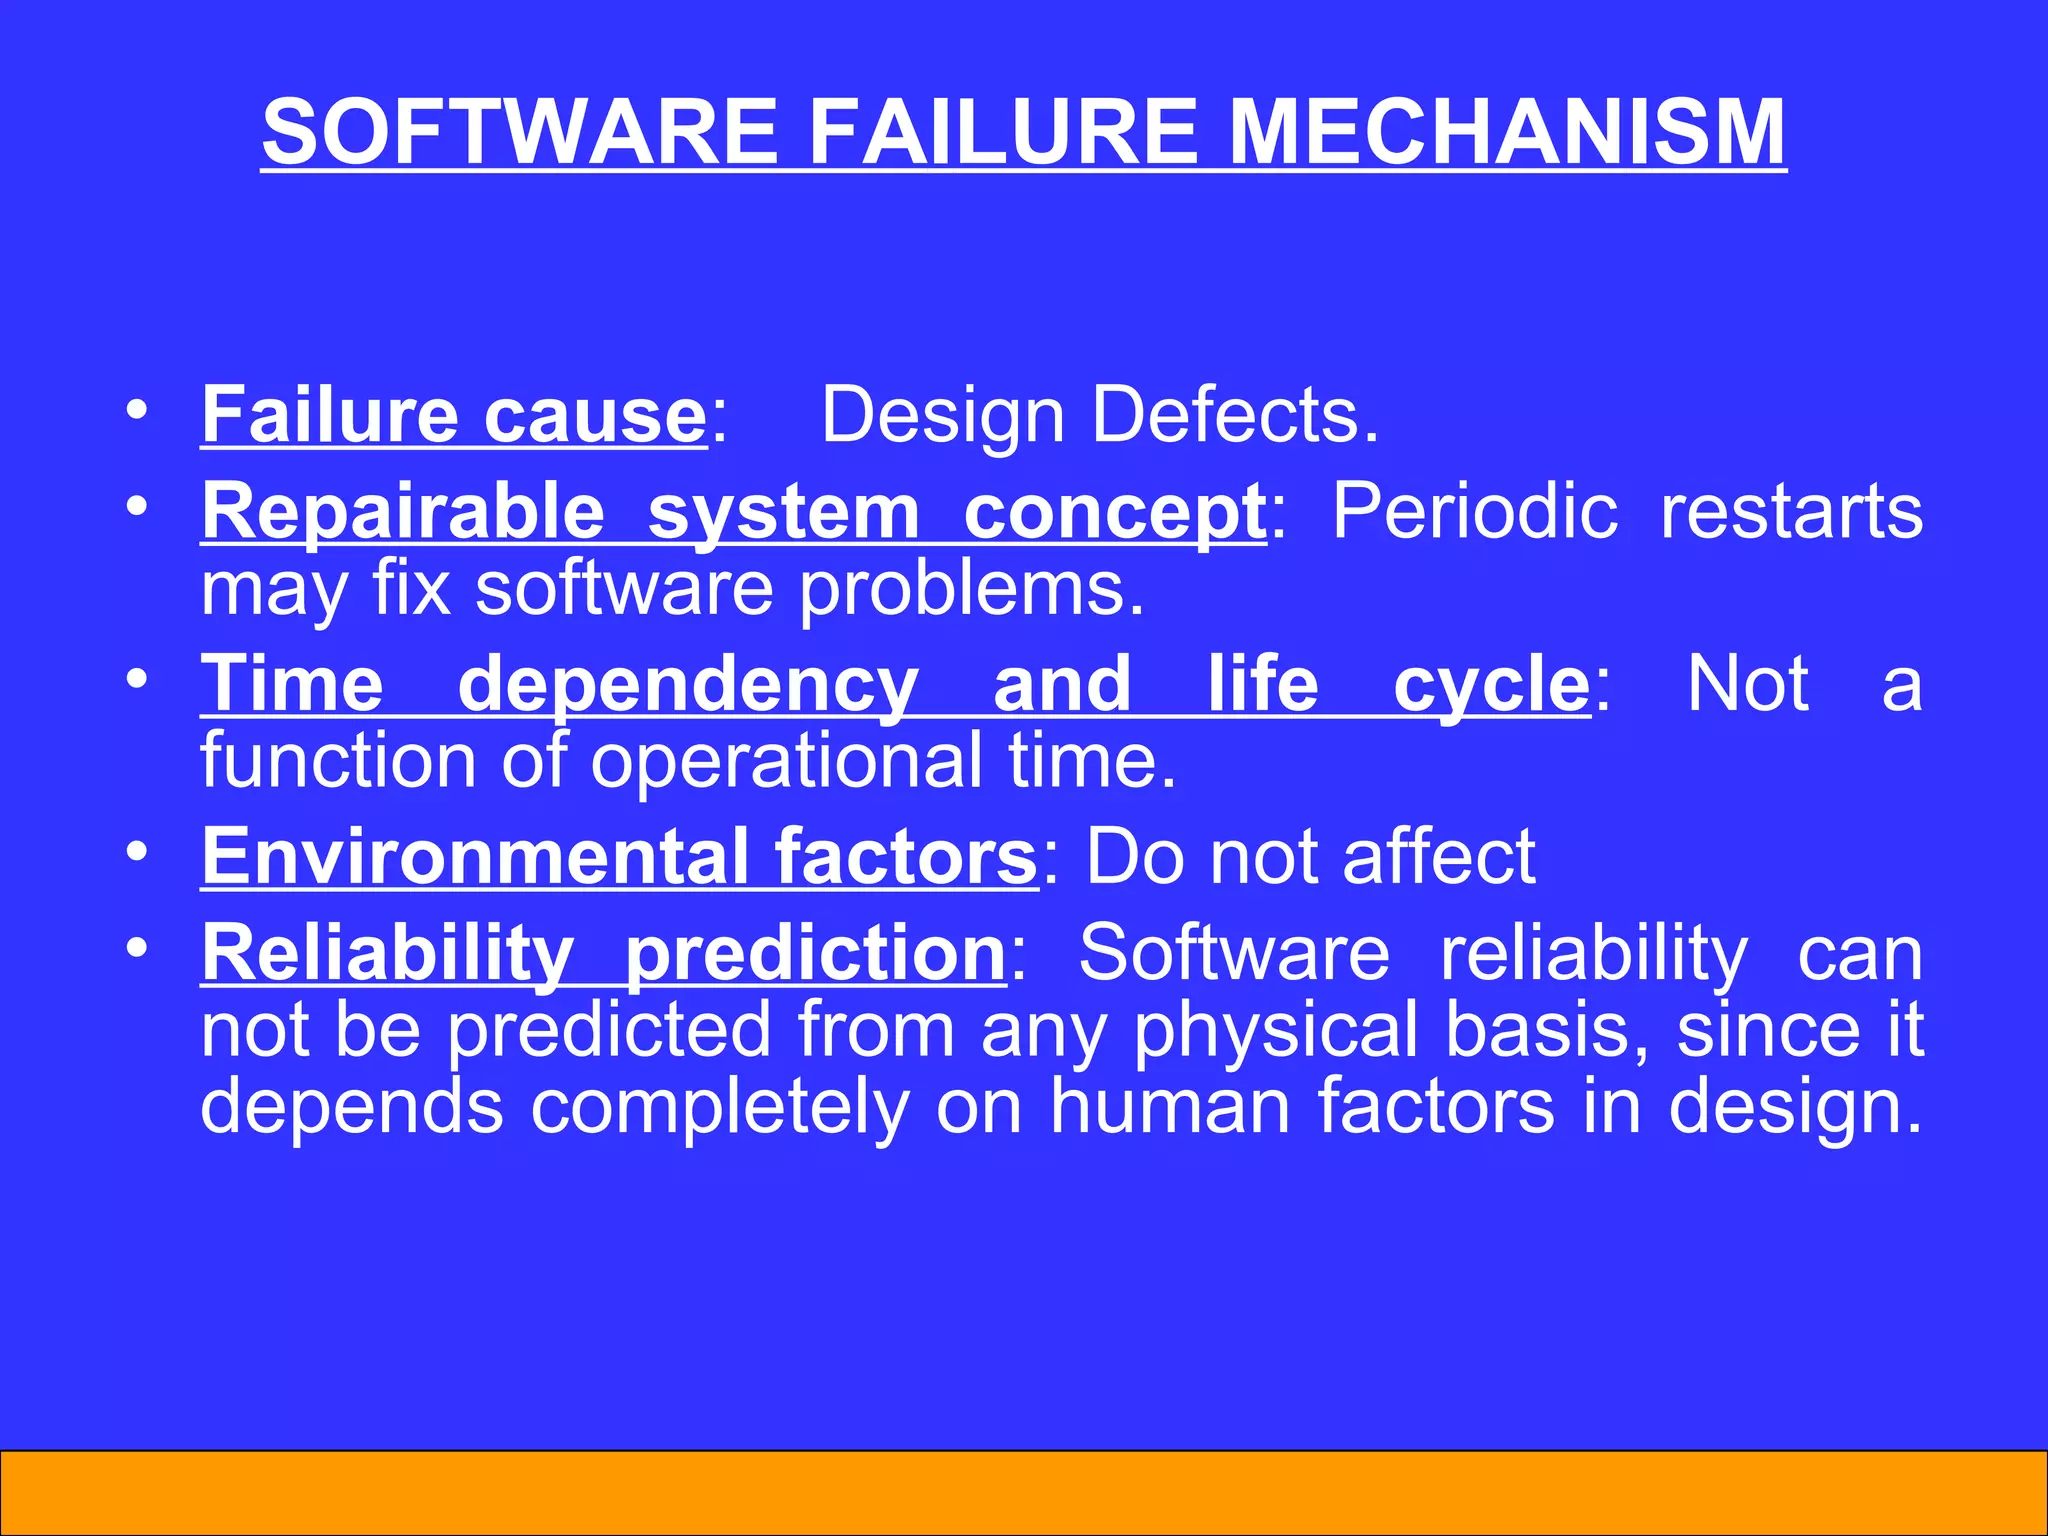
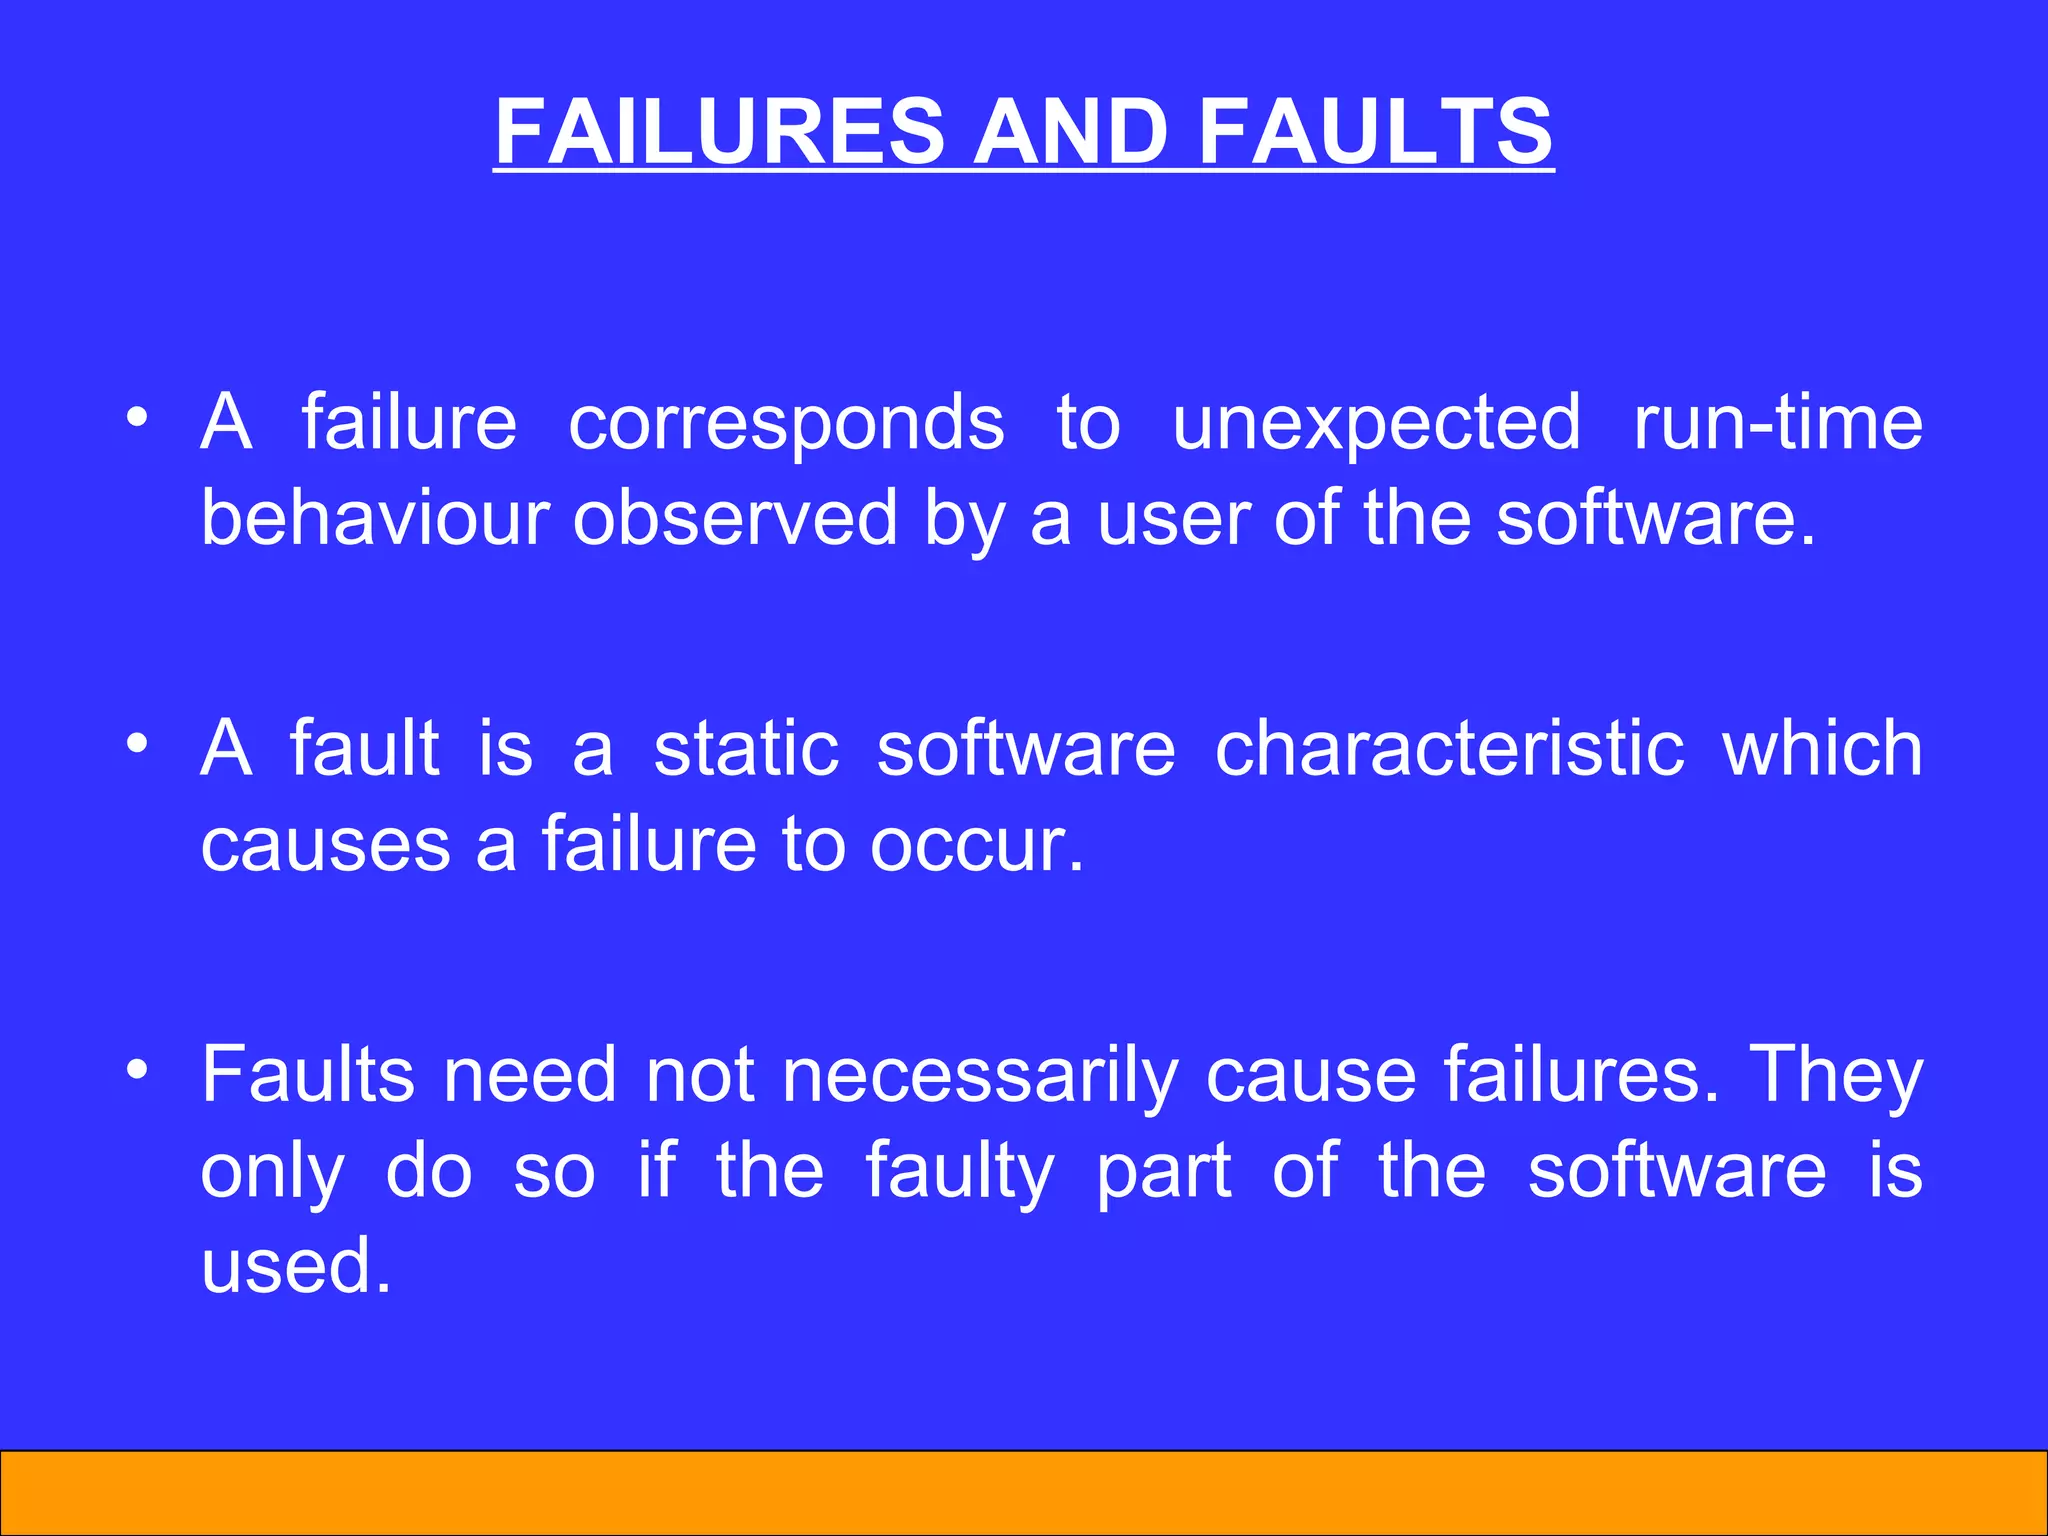
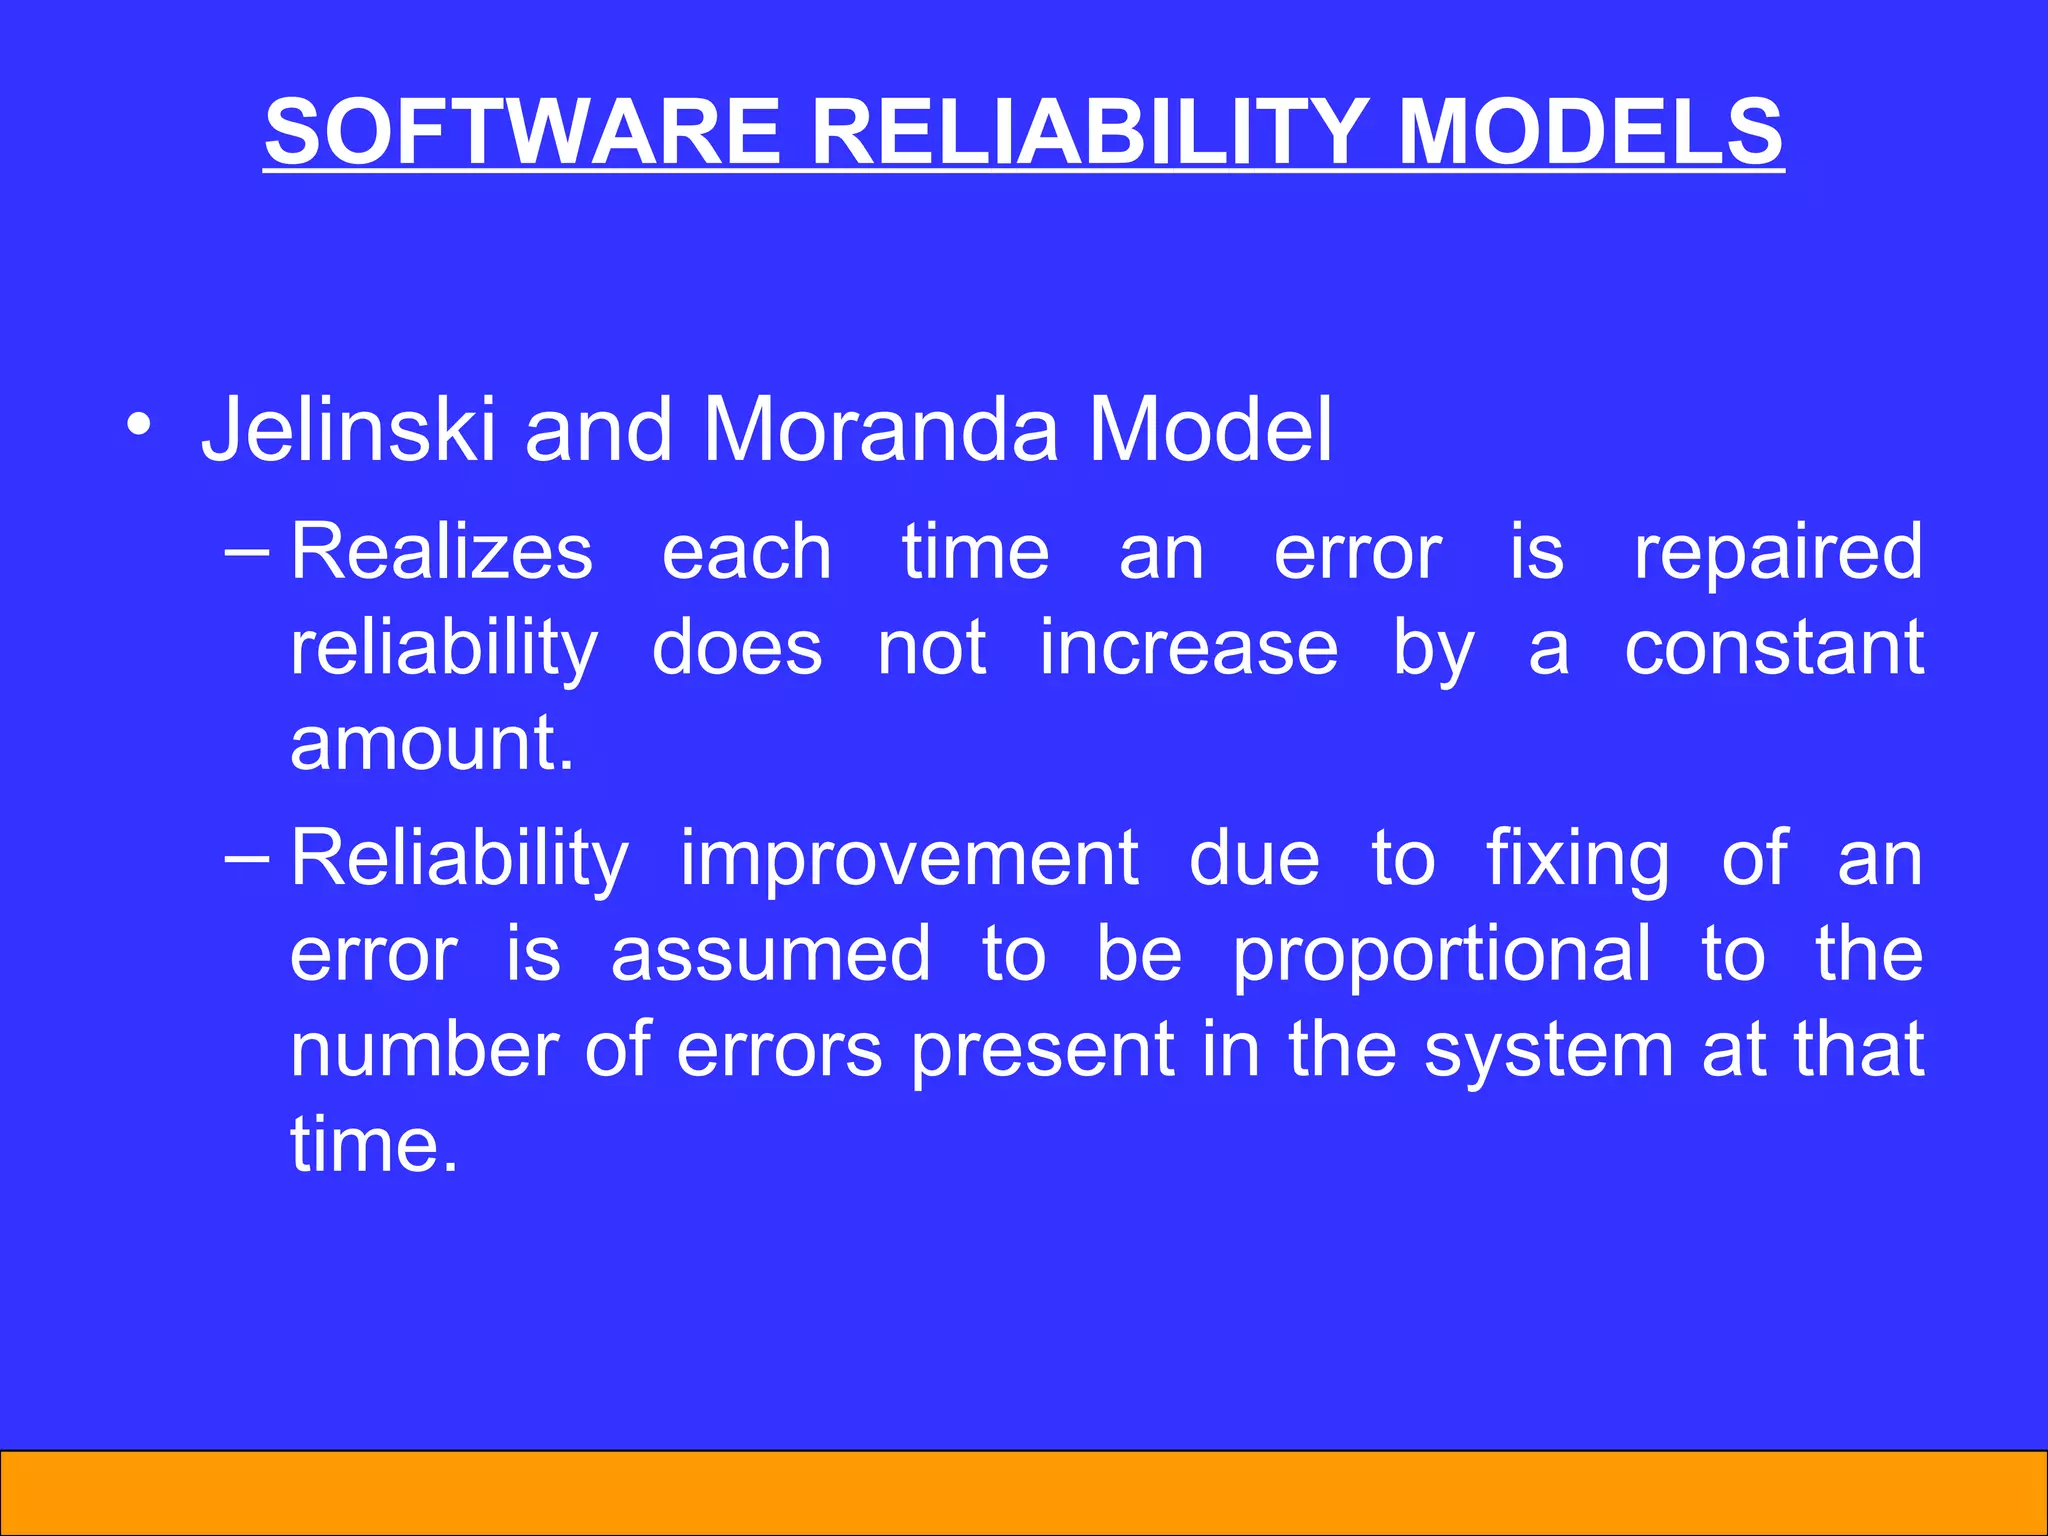
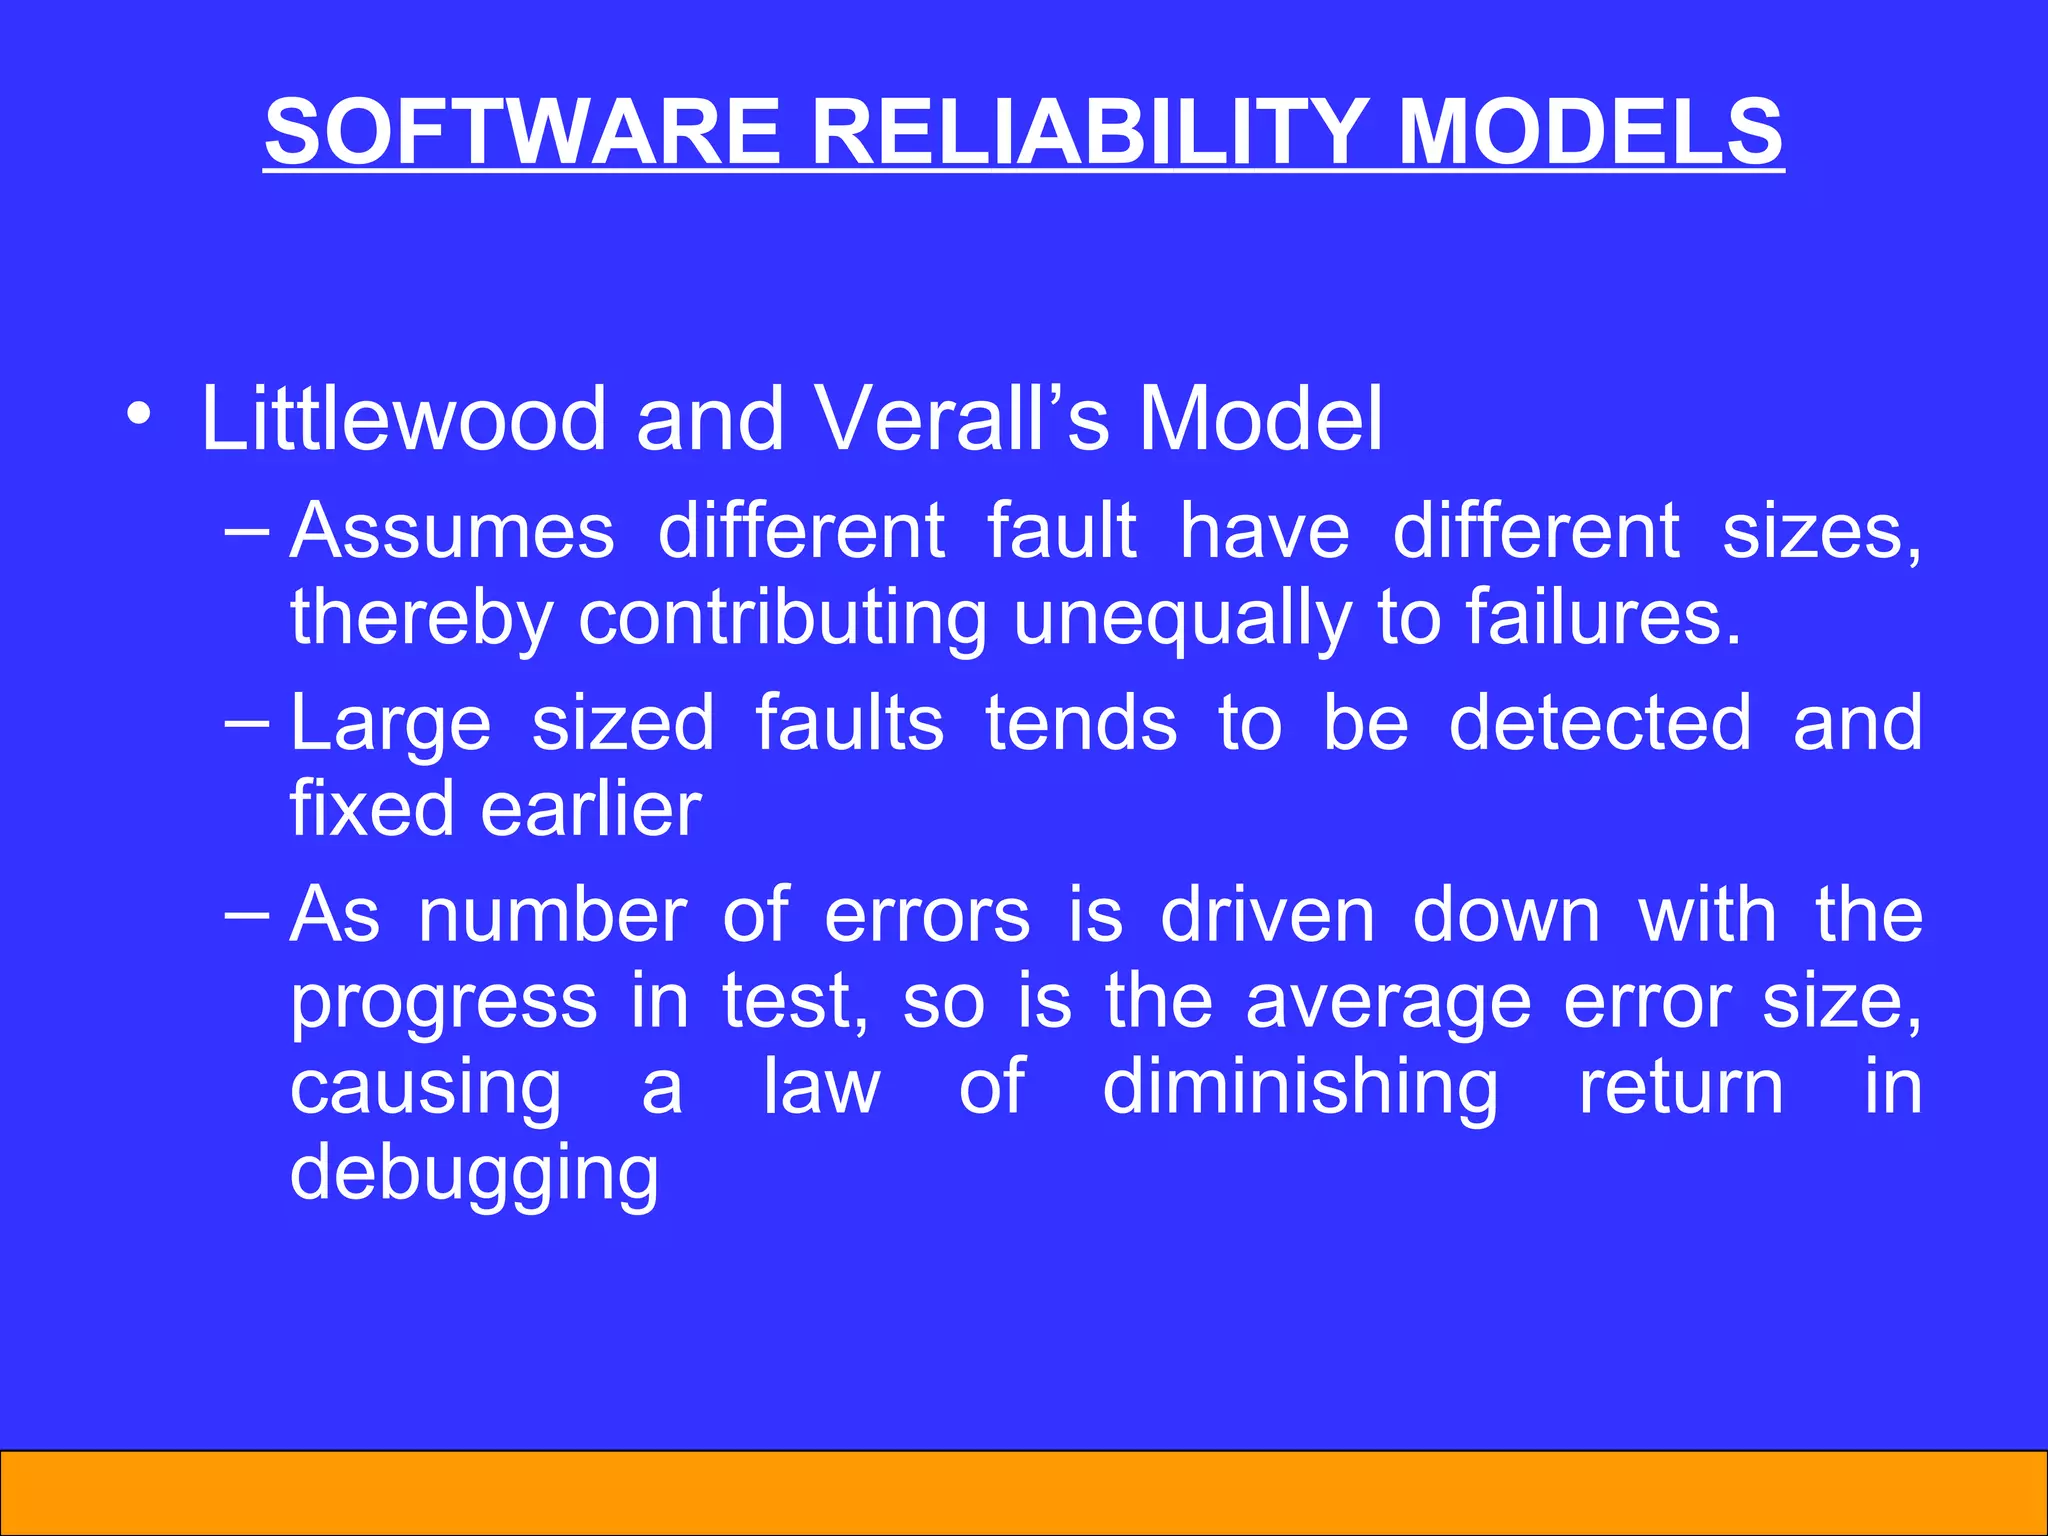
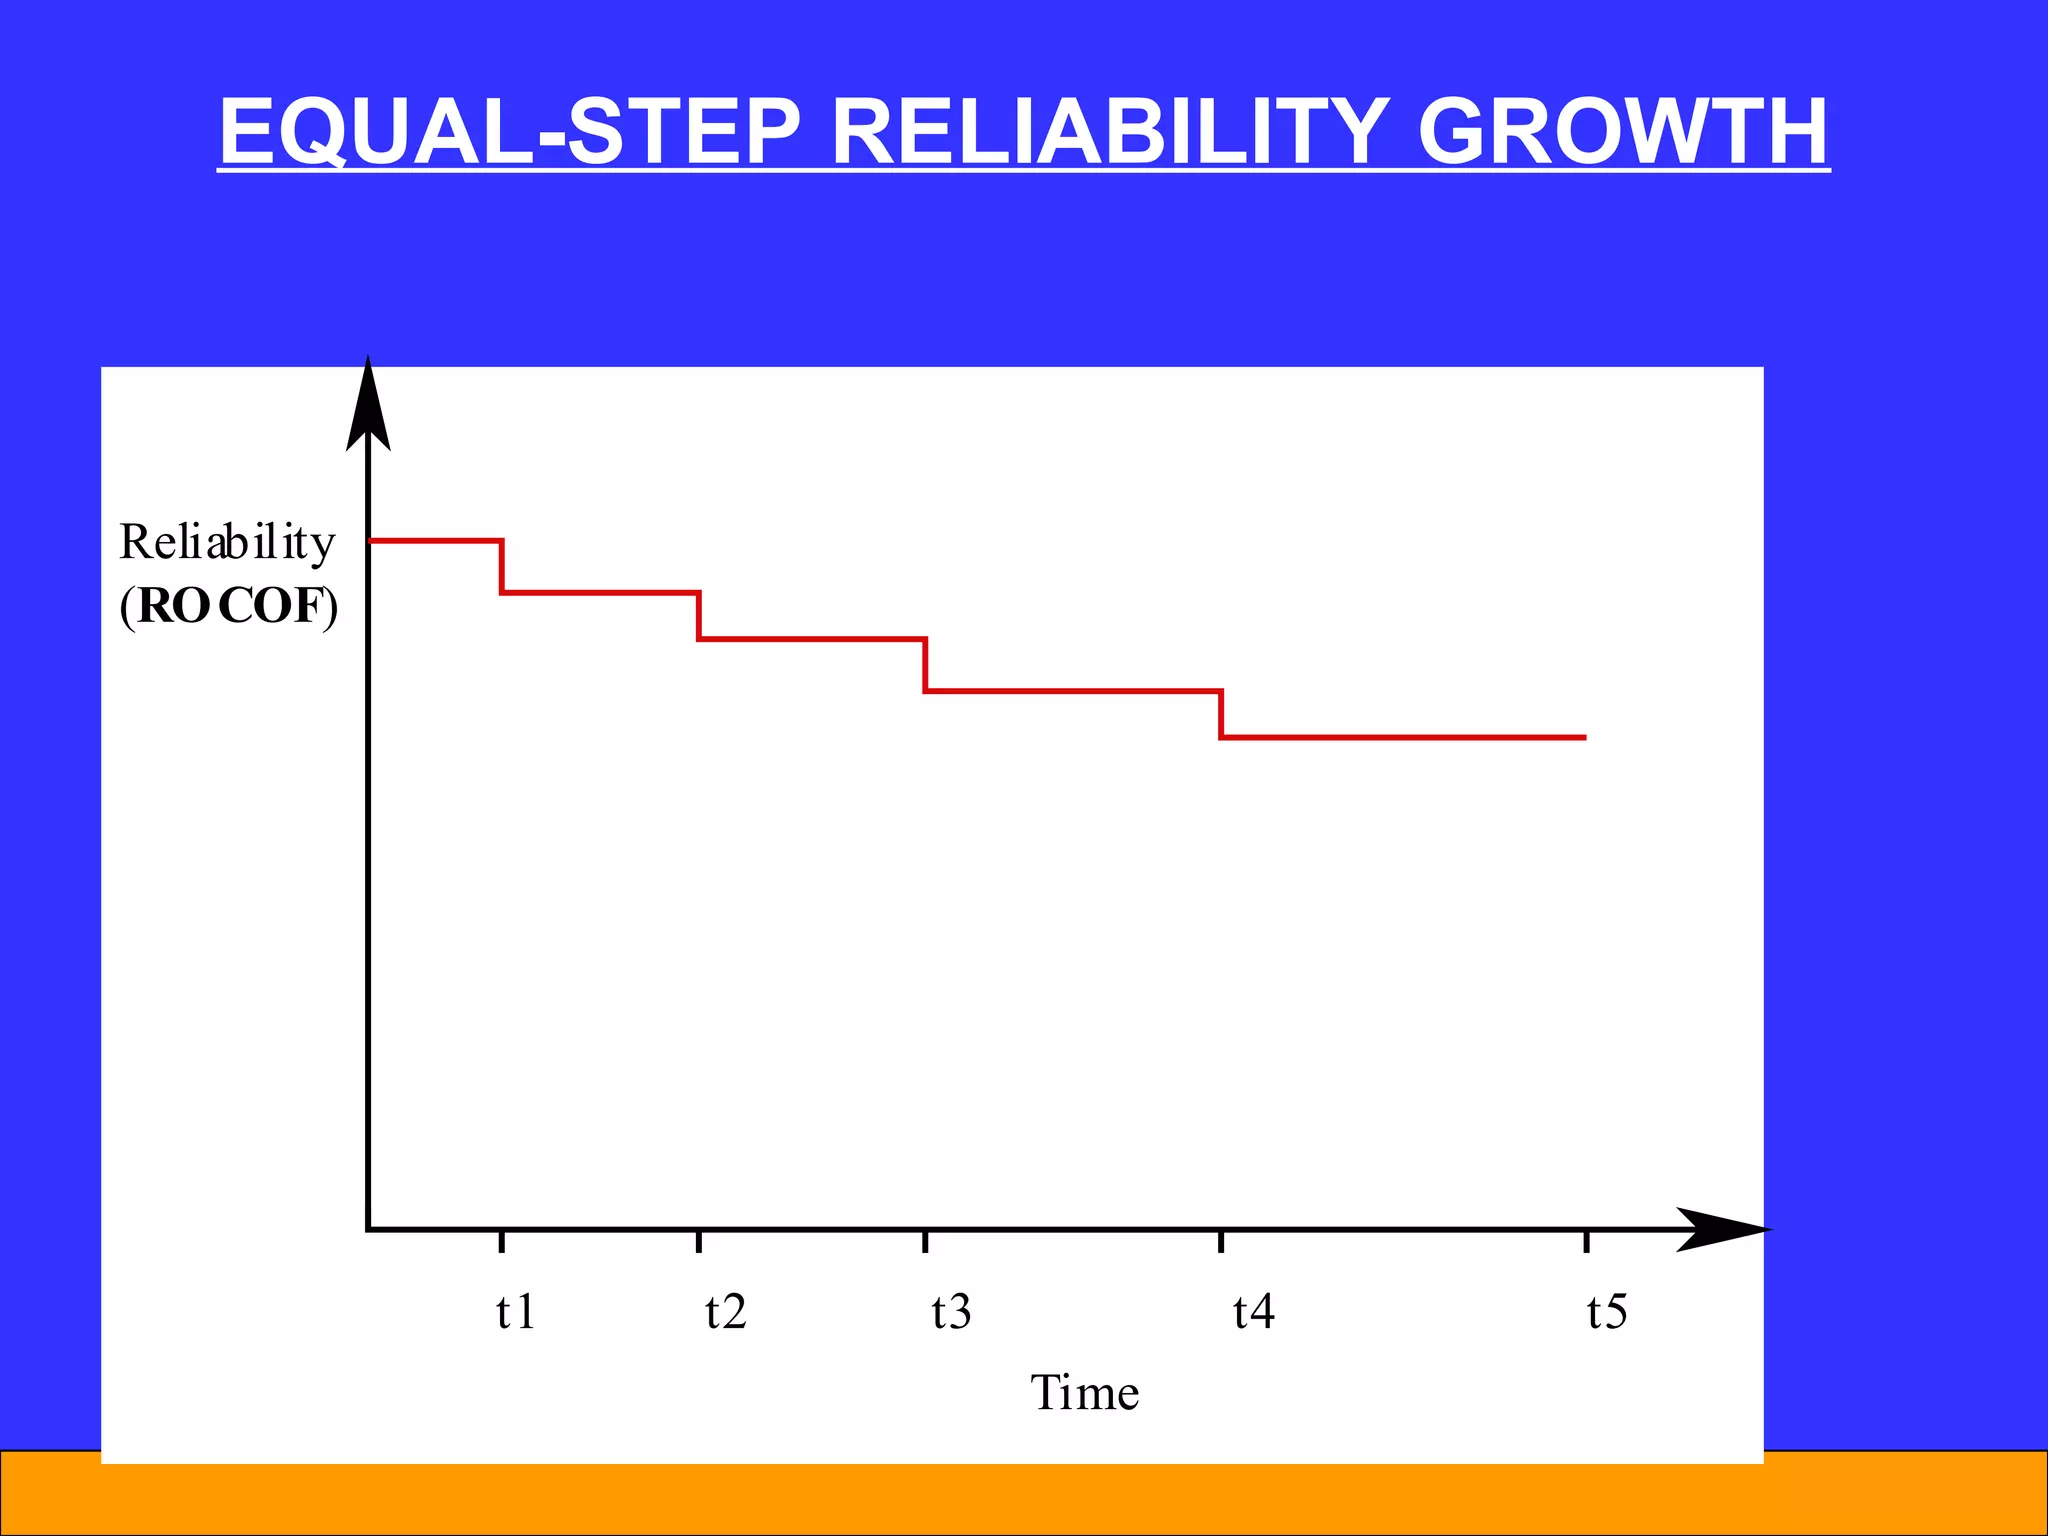
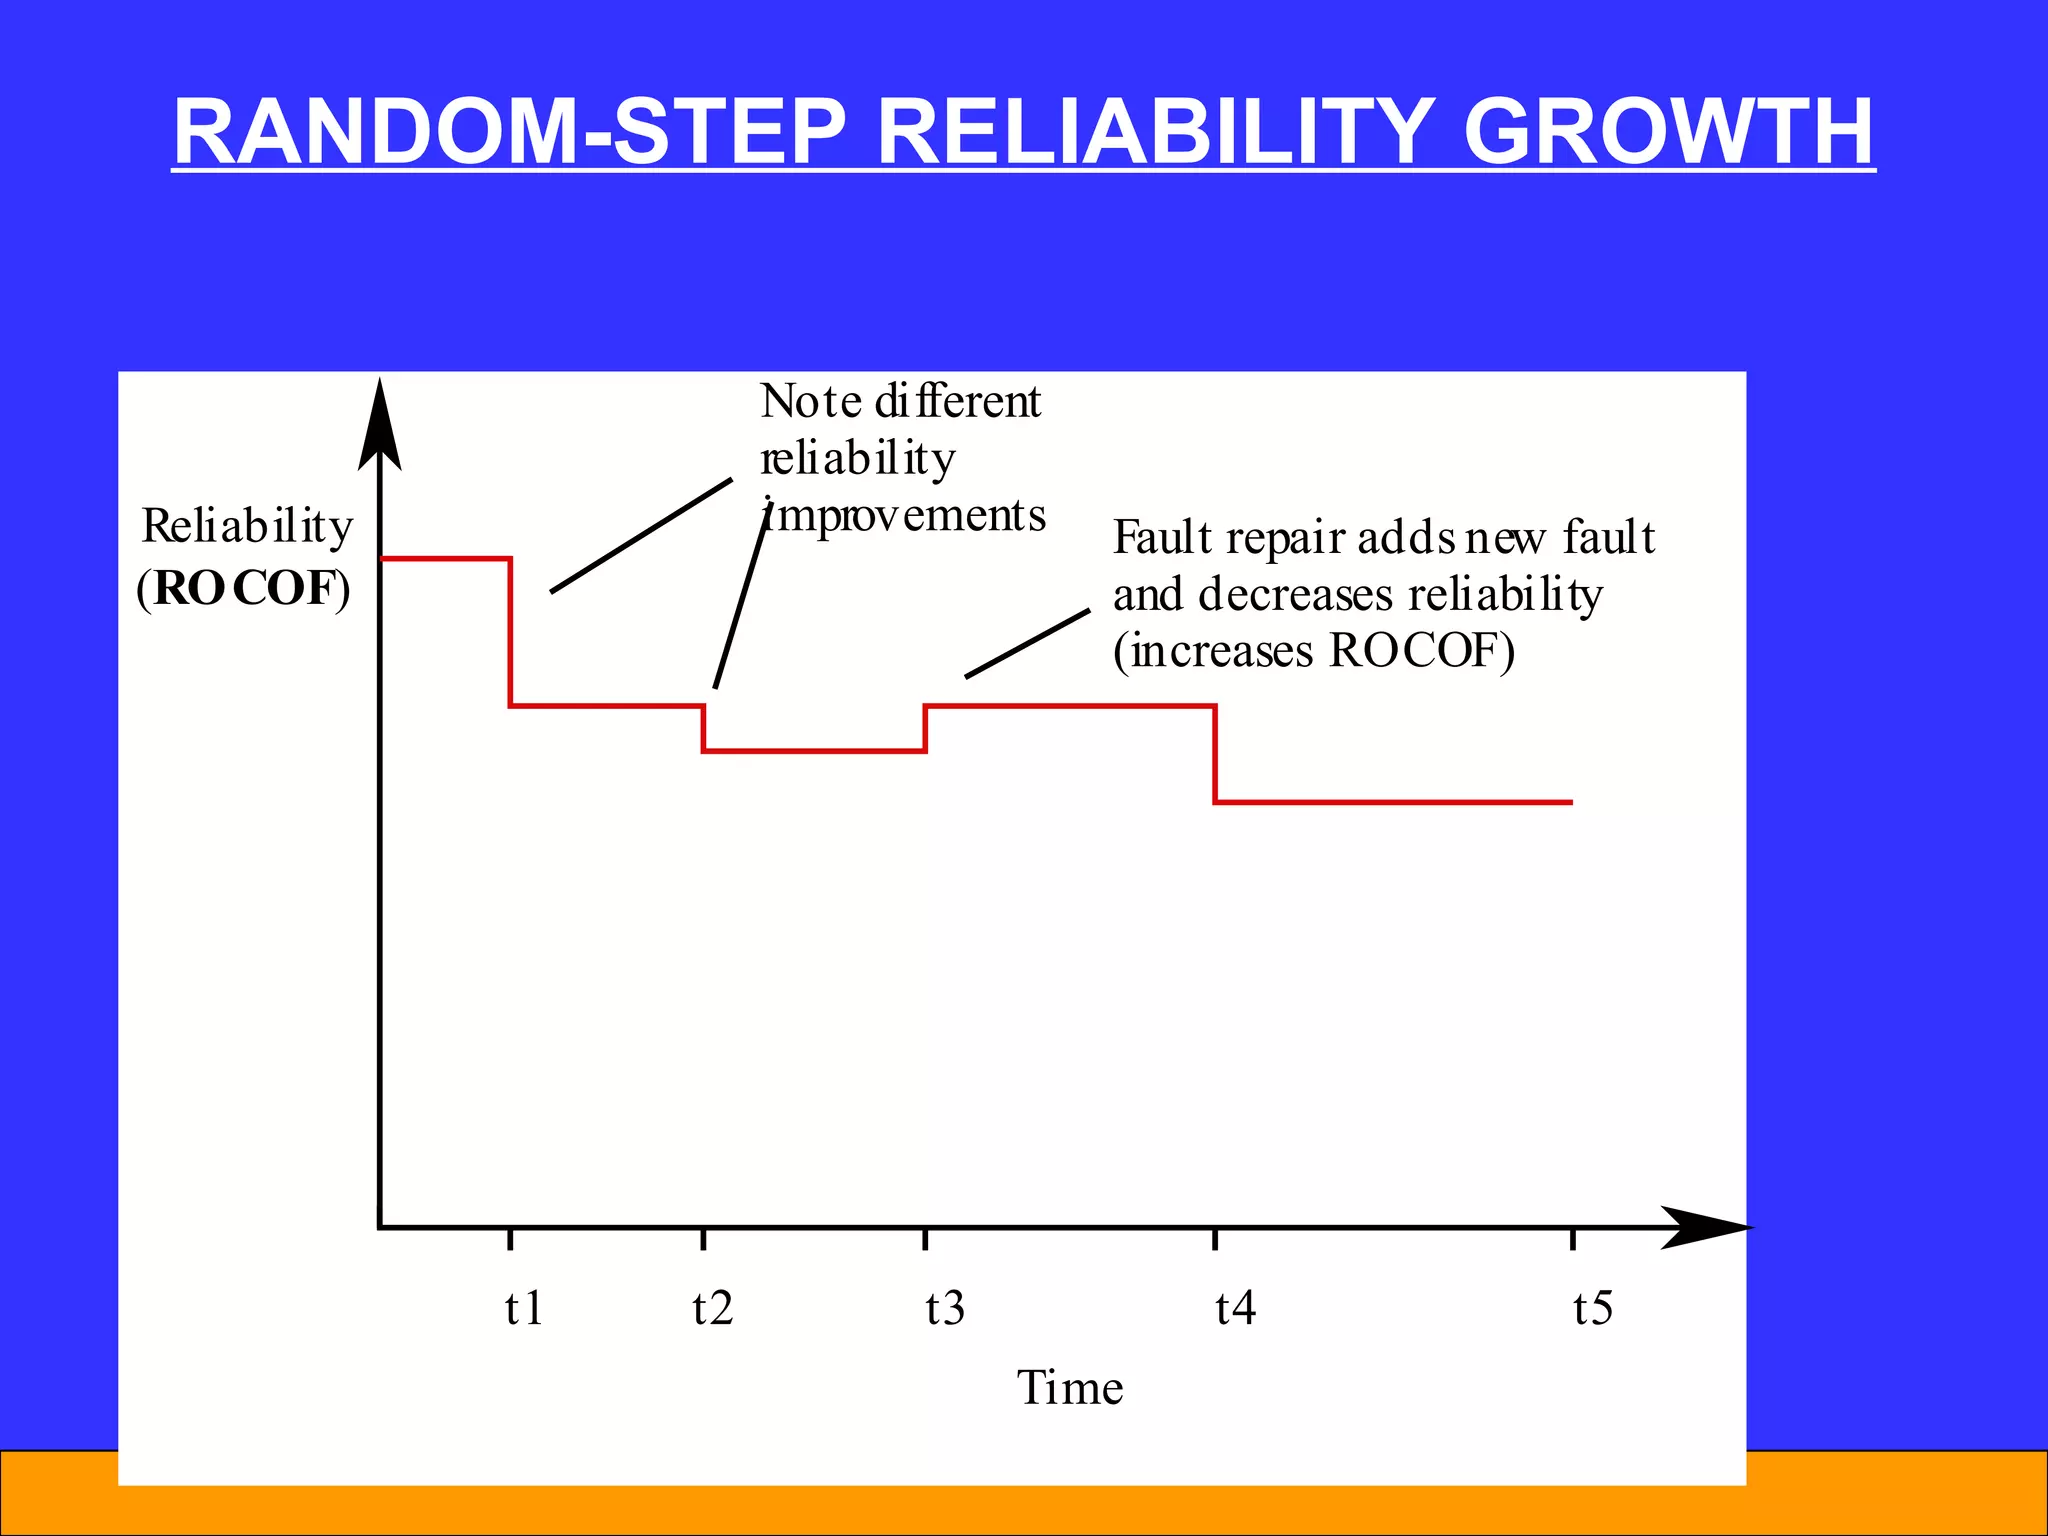
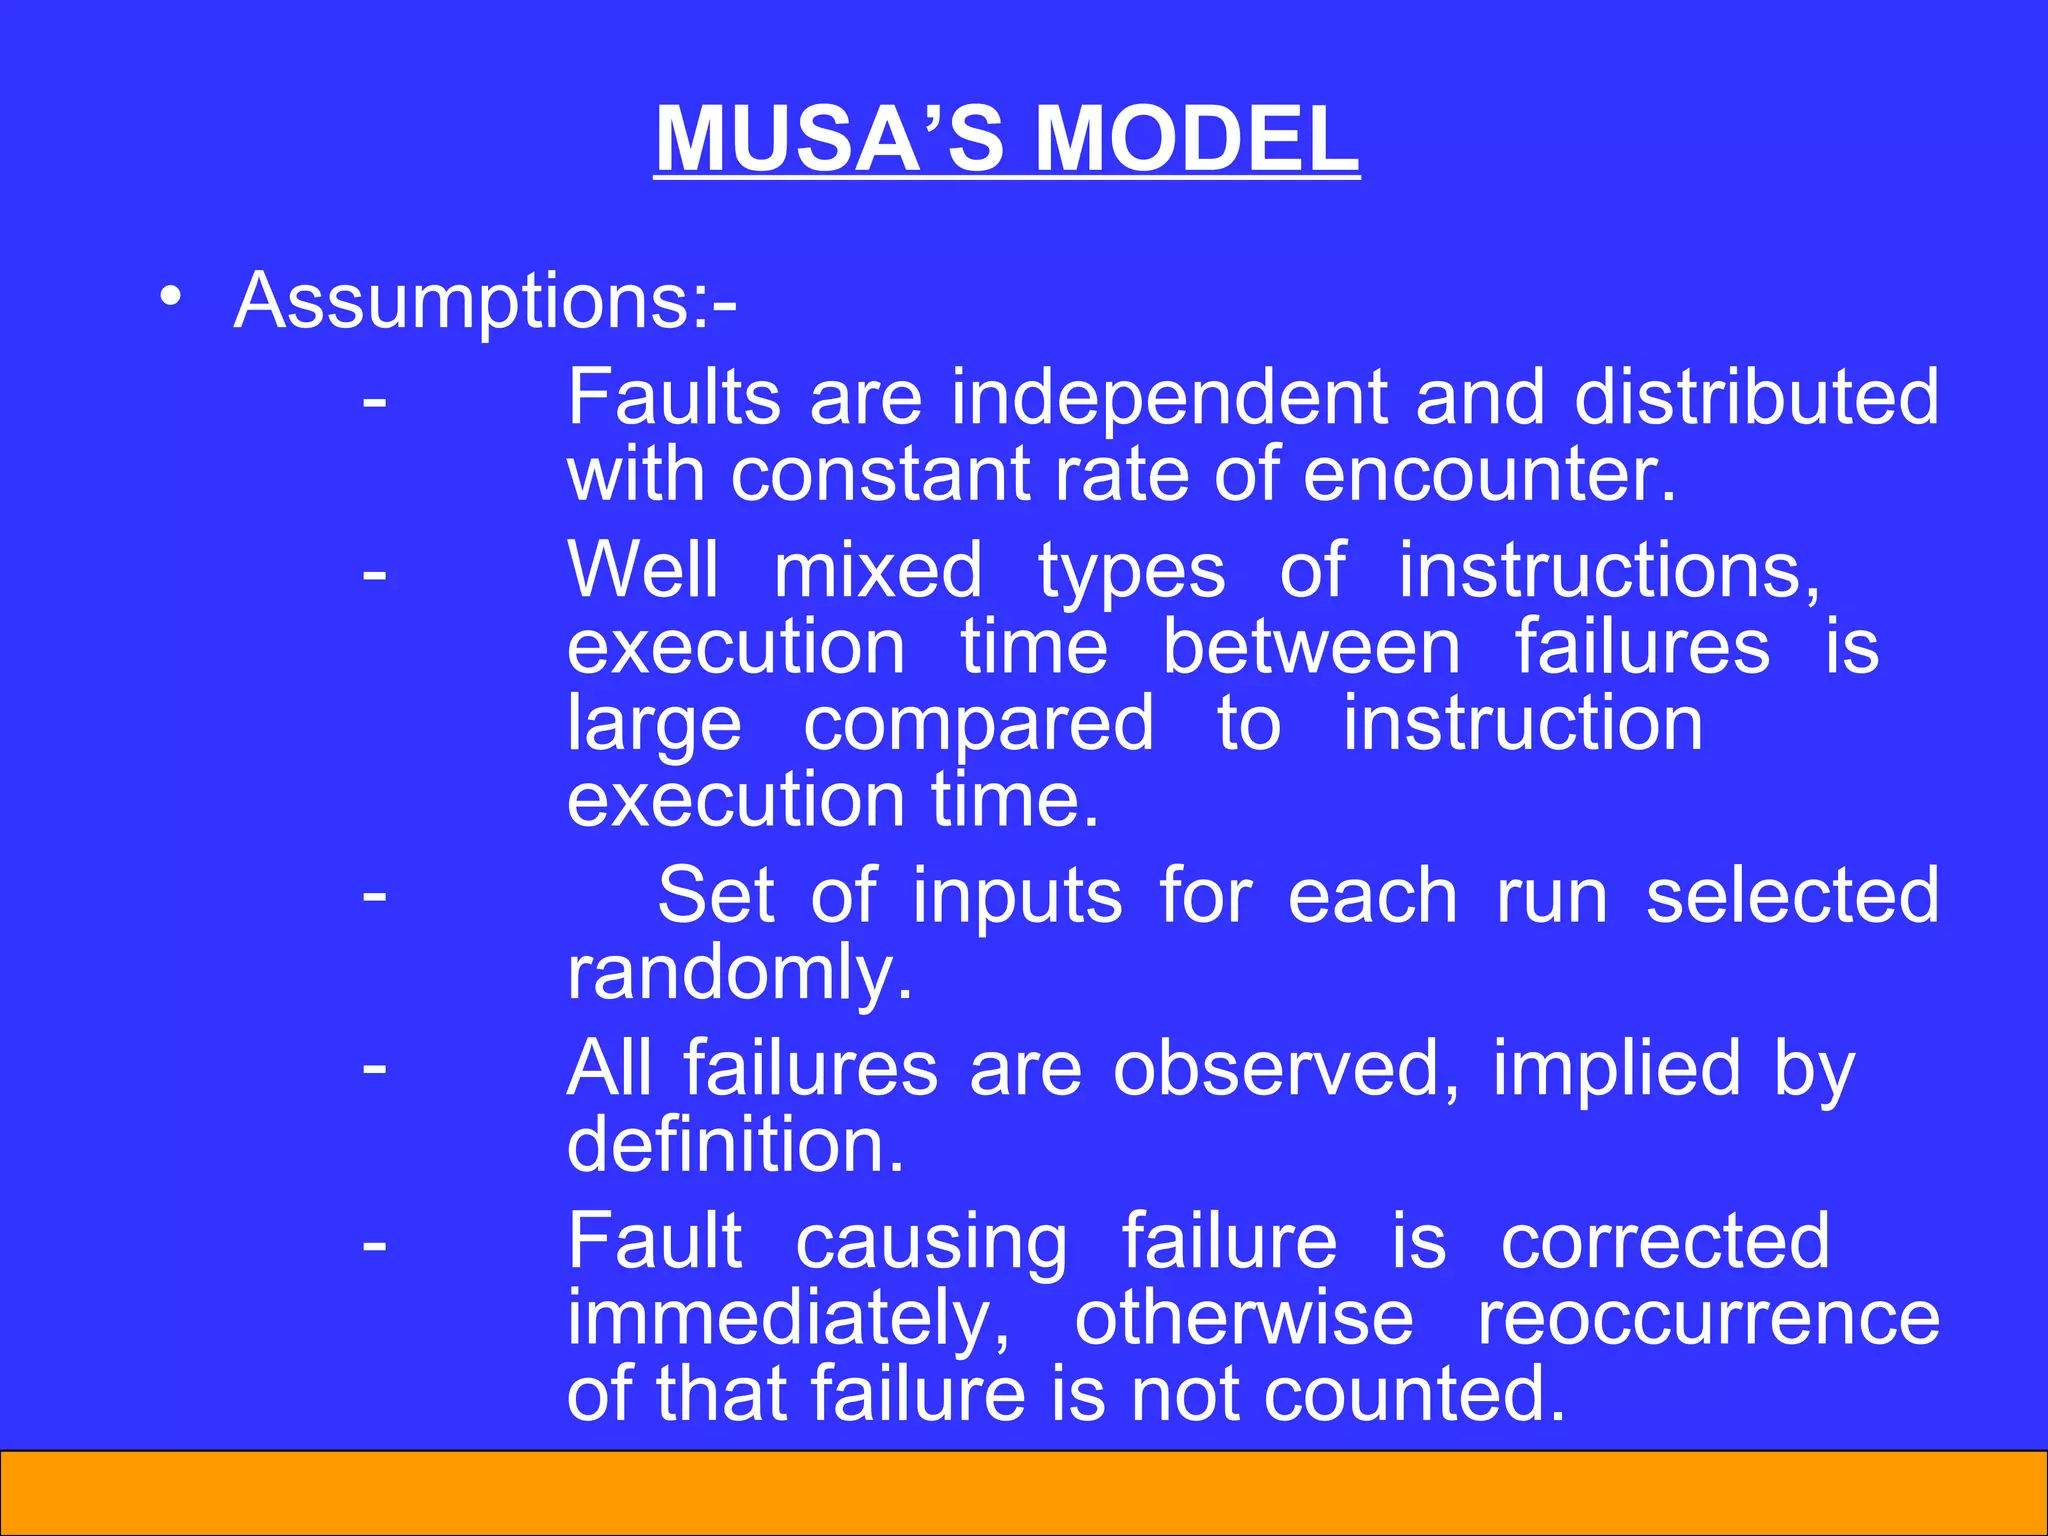
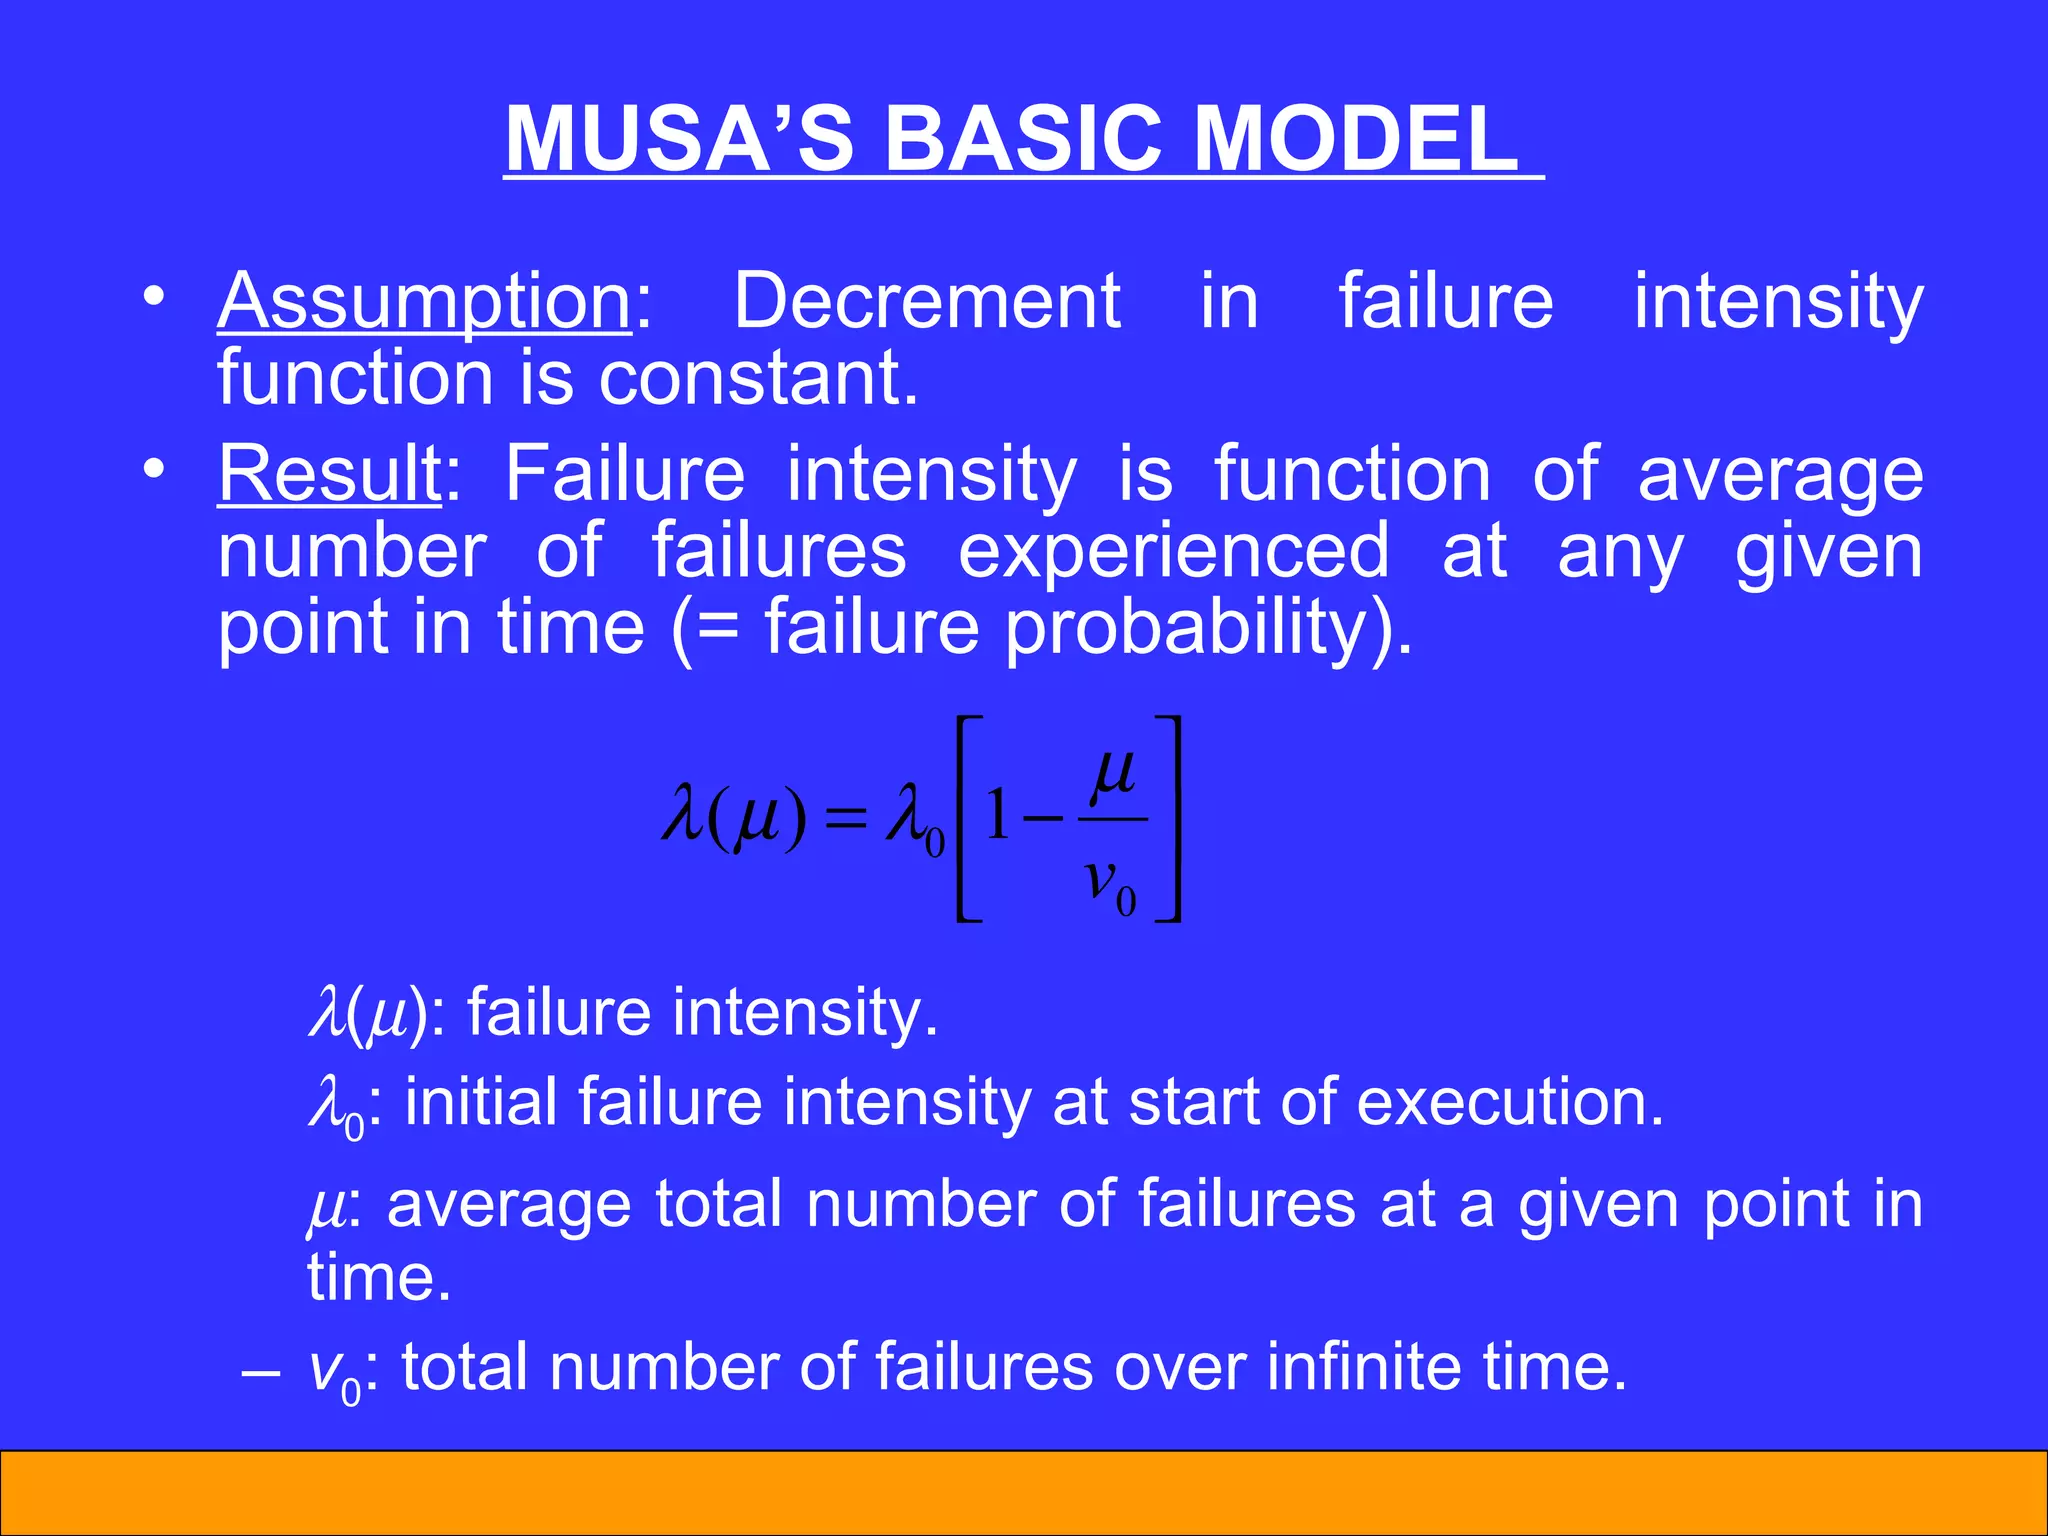
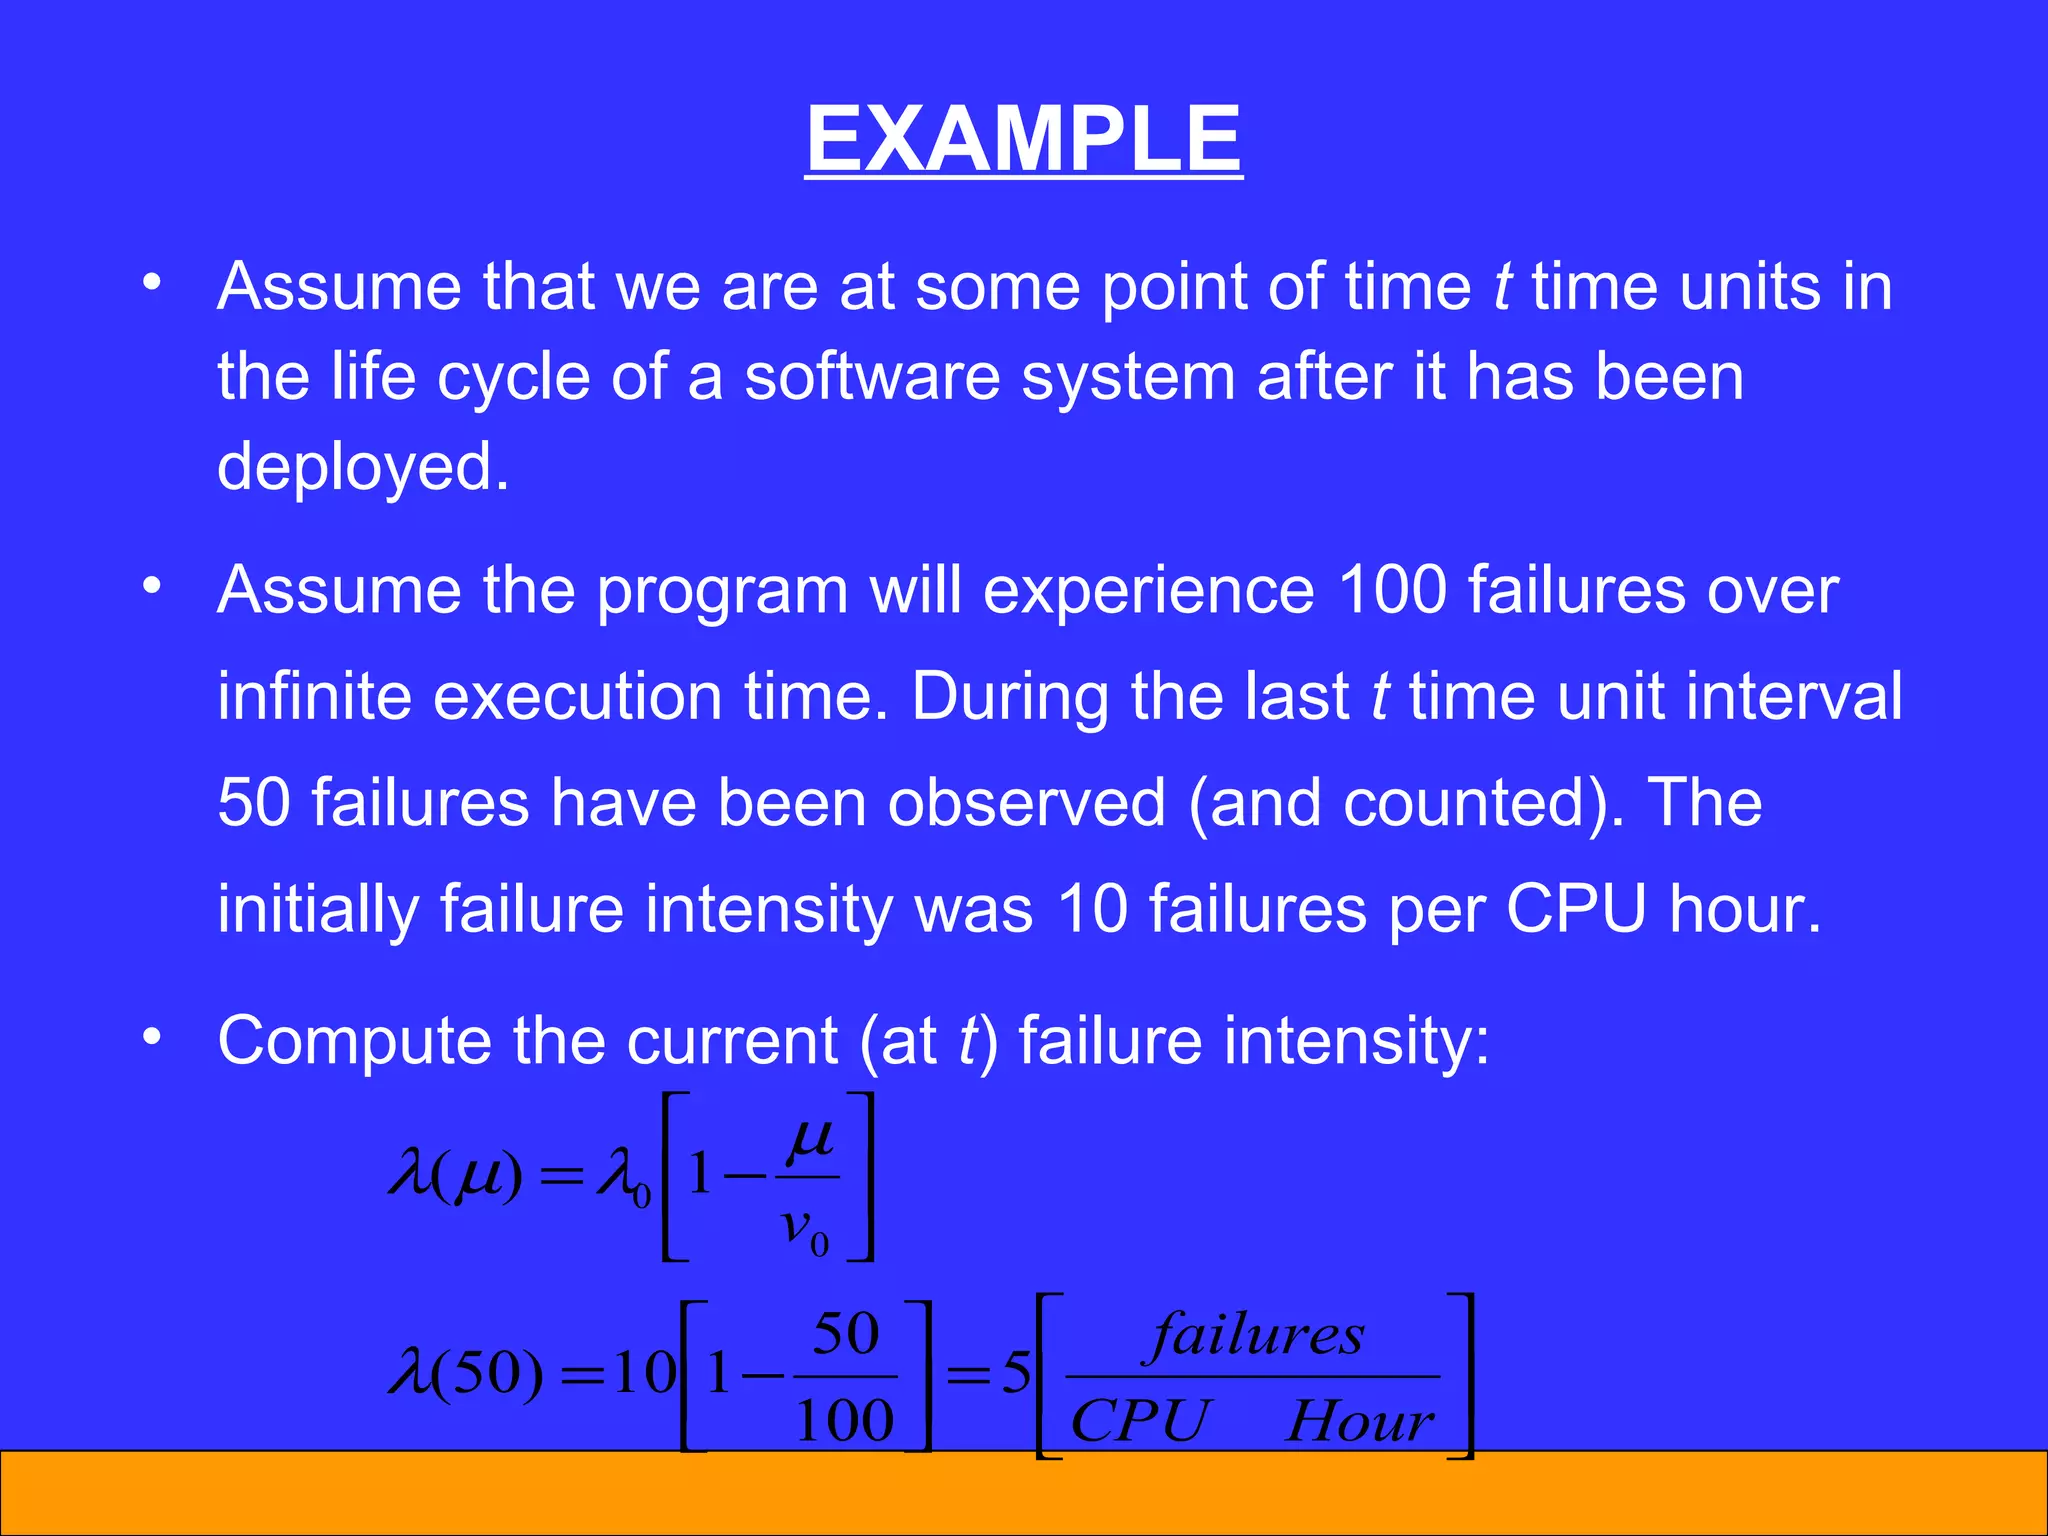
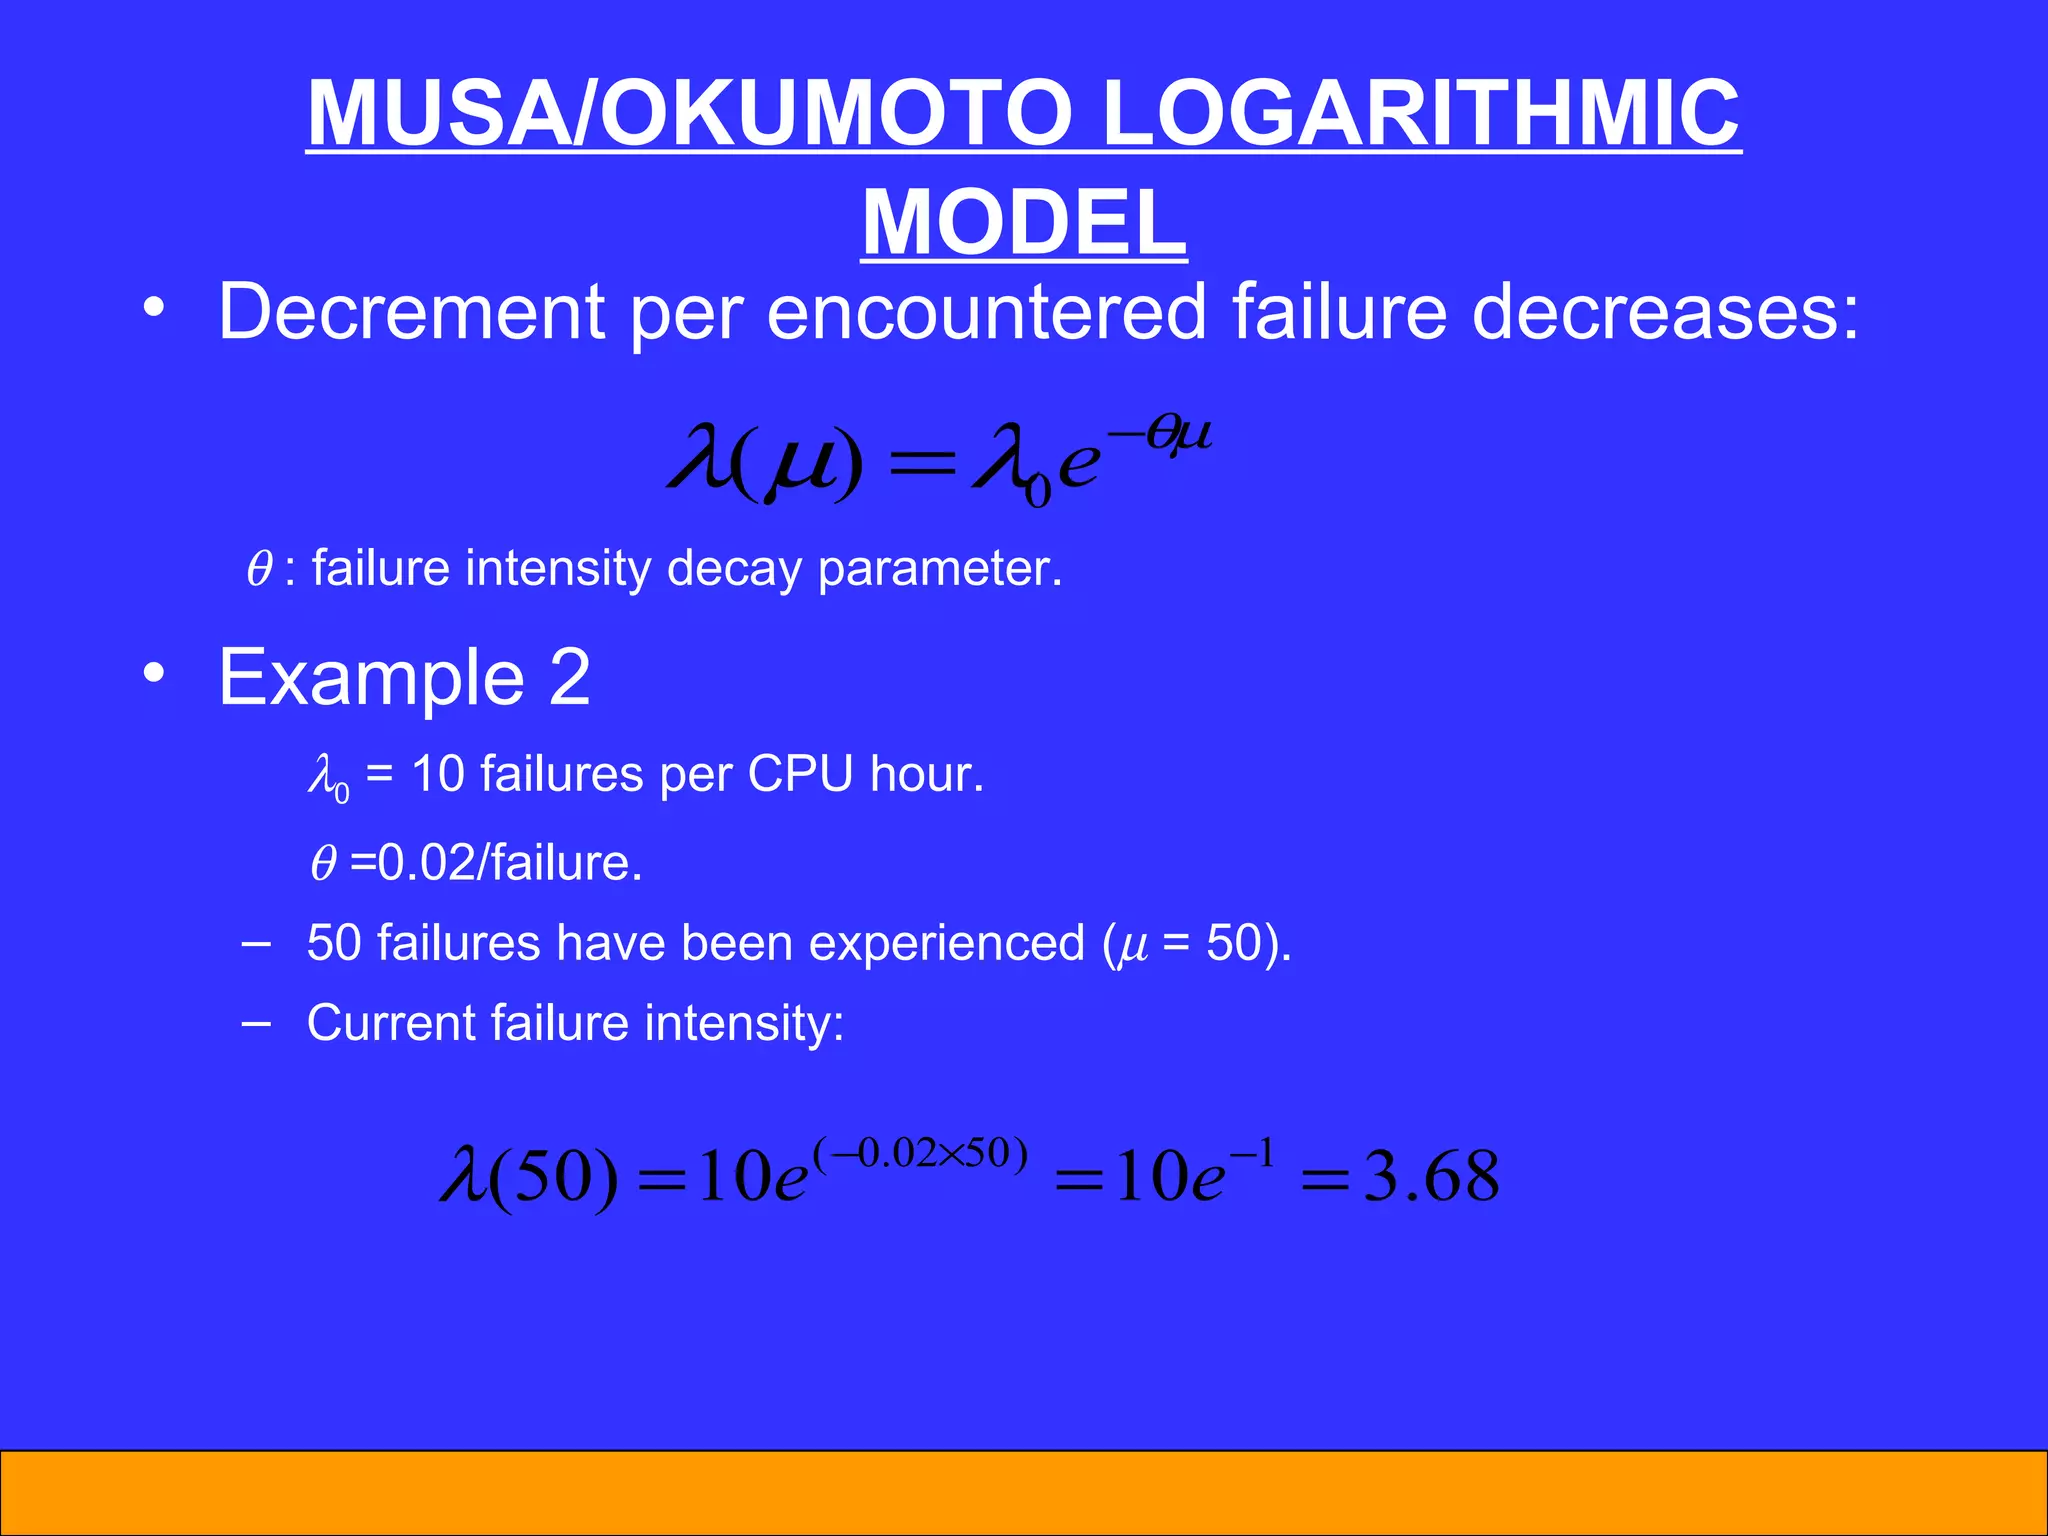
The document discusses software reliability and reliability growth models. It defines software reliability and differentiates it from hardware reliability. It also describes some commonly used software reliability growth models like Musa's basic and logarithmic models. These models make assumptions about fault removal over time to predict how failure rates will change as testing progresses. The key challenges with models are uncertainty and accurately estimating their parameters.