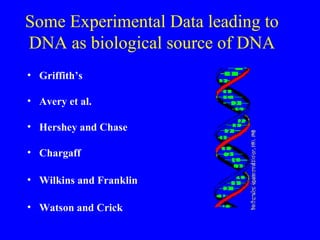
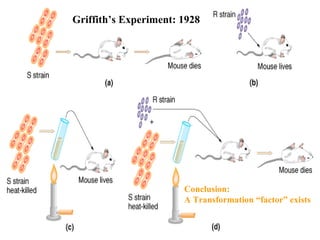
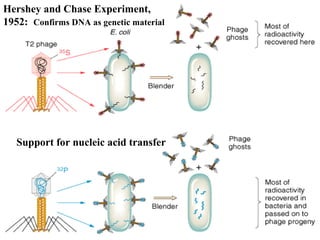
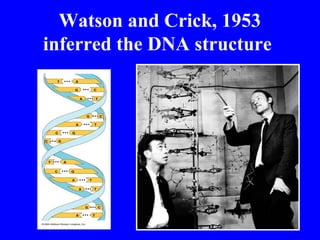
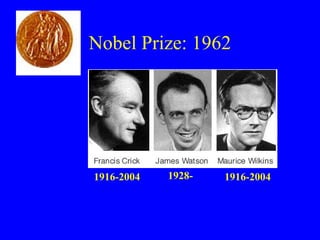
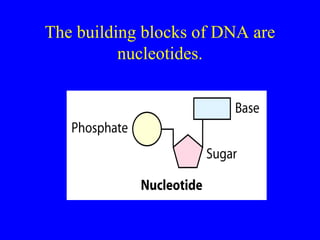
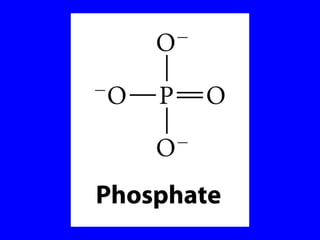
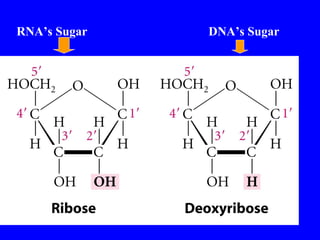
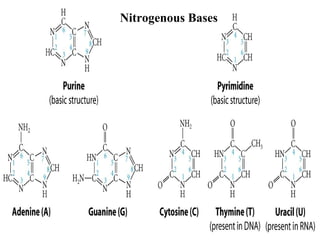
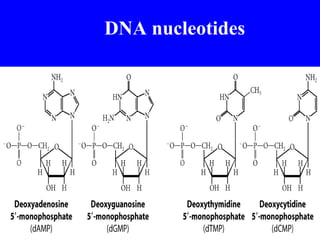
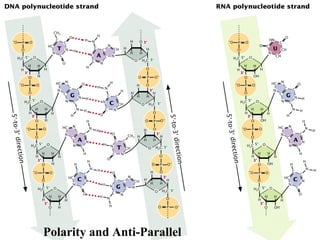
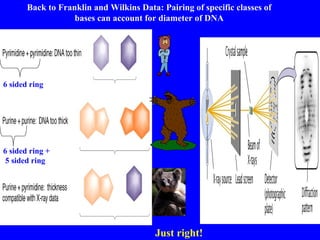
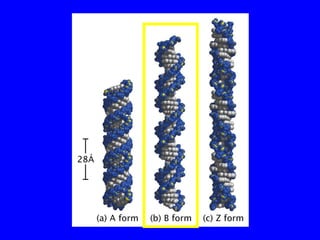
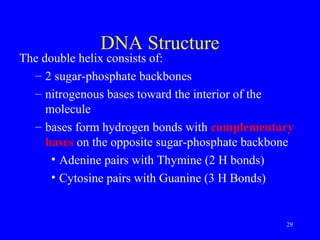
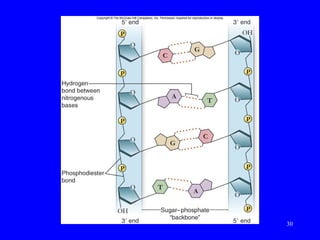
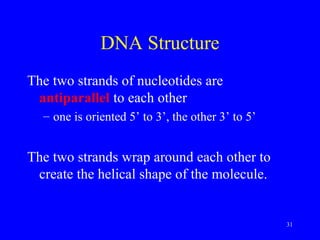
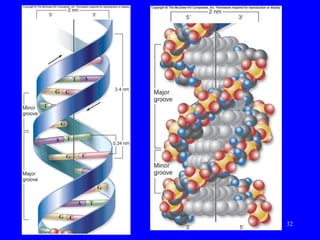
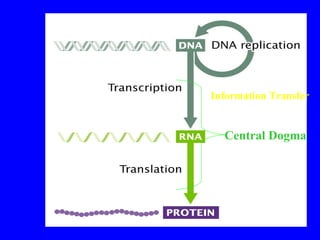
DNA: The Secret Of Our Life
(An Introduction Lecture)
lecture 1
Lecture Objectives
• At the of this Lecture you should be able to
learn:
• 1. The history of DNA discovery with their
importance for the new concepts and
application techniques
• 2. The chemical and physical properties of
DNA and how these properties were
exploited for DNA technologies
Early historical perspective
We enter the 20th
century with an
understanding of the DNA building
block.
Some Experimental Data leading to
DNA as biological source of DNA
• Griffith’s
• Avery et al.
• Hershey and Chase
• Chargaff
• Wilkins and Franklin
• Watson and Crick
Griffith’s Experiment: 1928
Conclusion:
A Transformation “factor” exists
Support for nucleic acid transfer
Hershey and Chase Experiment,
1952: Confirms DNA as genetic material
Conclusion: DNA identified as
source of genetic information
Franklin and Wilkins 1947
1920-1958 1916-2004
Chargaff’s Rule 1948
1905-20021905-20021905-2002
1905-2002
Watson and Crick, 1953
inferred the DNA structure
Nobel Prize: 1962
1928-1916-2004 1916-2004
The building blocks of DNA are
nucleotides.
RNA’s Sugar DNA’s Sugar
Nitrogenous Bases
DNA nucleotides
Polarity and Anti-Parallel
Back to Franklin and Wilkins Data: Pairing of specific classes of
bases can account for diameter of DNA
Just right!
6 sided ring
6 sided ring +
5 sided ring
Most Common Secondary Structure (3D structure)
• B-DNA
• Alpha Helix
• Right Handed Turn
• 10 bases per 360º turn
A function of Major and Minor Grooves
23
Nucleosides• Nucleosides: nitrogenous base linked to specific sugar
– RNA: adenosine, guanosine, cytidine, uridine
– DNA: deoxyadenosine, deoxyguanosine,
deoxycytidine, (deoxy)thymidine
138.192.68.68/.../Nucleosides.gif
DNA nucleoside RNA nucleoside
24
Nucleotides
The nucleotide structure consists of
– the nitrogenous base attached to the 1’ carbon
of deoxyribose
– the phosphate group attached to the 5’ carbon
of deoxyribose
– a free hydroxyl group (-OH) at the 3’ carbon of
deoxyribose
25
Nucleotides
• Subunits of DNA
and RNA
– Nucleosides
linked to
phosphate group
via ester bond
– “dNTP’s”: DNA
– “rNTP’s”: RNA
26
DNA Structure
Nucleotides are connected to each other to
form a long chain
phosphodiester bond: bond between
adjacent nucleotides
– formed between the phosphate group of one
nucleotide and the 3’ –OH of the next
nucleotide
The chain of nucleotides has a 5’ to 3’
orientation.
27
28
DNA structure determination
Chargaff's Rules
– Erwin Chargaff determined that
• amount of adenine = amount of thymine
• amount of cytosine = amount of guanine
29
DNA Structure
The double helix consists of:
– 2 sugar-phosphate backbones
– nitrogenous bases toward the interior of the
molecule
– bases form hydrogen bonds with complementary
bases on the opposite sugar-phosphate backbone
• Adenine pairs with Thymine (2 H bonds)
• Cytosine pairs with Guanine (3 H Bonds)
30
31
DNA Structure
The two strands of nucleotides are
antiparallel to each other
– one is oriented 5’ to 3’, the other 3’ to 5’
The two strands wrap around each other to
create the helical shape of the molecule.
32
33
Chemical Properties of DNA
• Factors that affect DNA structure
– Temperature: denaturation (can be reversible)
– pH: high pH can denature DNA
– Salt concentration: lowering salt concentration
can denature DNA
– Molecular Hybridization (DNA:DNA) and
(DNA:RNA)
– UV absorption (230-260nm)
• Southern blotting of DNA fragments
APPLICATION Researchers can detect specific nucleotide sequences within a DNA sample with this method. In
particular, Southern blotting is useful for comparing the restriction fragments produced from
different samples of genomic DNA.
TECHNIQUE In this example, we compare genomic DNA samples from three individuals: a homozygote
for the normal -globin allele (I), a homozygote for the mutant sickle-cell allele (II), and a
heterozygote (III).
DNA + restriction enzyme Restriction
fragments I II III
I Normal
-globin
allele
II Sickle-cell
allele
III Heterozygote
Preparation of restriction fragments. Gel electrophoresis. Blotting.
Gel
Sponge
Alkaline
solution
Nitrocellulose
paper (blot)
Heavy
weight
Paper
towels
1 2 3
Figure 20.10
RESULTS Because the band patterns for the three samples are clearly different, this method can be used to
identify heterozygous carriers of the sickle-cell allele (III), as well as those with the disease, who have
two mutant alleles (II), and unaffected individuals, who have two normal alleles (I). The band patterns
for samples I and II resemble those observed for the purified normal and mutant alleles, respectively,
seen in Figure 20.9b. The band pattern for the sample from the heterozygote (III) is a combination
of the patterns for the two homozygotes (I and II).
Radioactively
labeled probe
for -globin
gene is added
to solution in
a plastic bag
Probe hydrogen-
bonds to fragments
containing normal
or mutant -globin
Fragment from
sickle-cell
-globin allele
Fragment from
normal -globin
allele
Paper blot
Film over
paper blot
Hybridization with radioactive probe. Autoradiography.
I II III
I II III
1 2
• DNA microarray assay of gene expression levels
APPLICATION
TECHNIQUE
Tissue sample
mRNA molecules
Labeled cDNA molecules
(single strands)
DNA
microarray
Size of an actual
DNA microarray
with all the genes
of yeast (6,400
spots)
Isolate mRNA.1
With this method, researchers can test thousands of genes simultaneously to determine
which ones are expressed in a particular tissue, under different environmental conditions in various disease
states, or at different developmental stages. They can also look for coordinated gene expression.
Make cDNA by reverse transcription, using fluores-cently labeled nucleotides.2
Apply the cDNA mixture to a microarray, a microscope slide on which copies of single-stranded
DNA fragments from the organism‘s genes are fixed, a different gene in each spot. The cDNA
hybridizes with any complementary DNA on the microarray.
3
Rinse off excess cDNA; scan microarray for fluorescence. Each fluorescent spot
(yellow) represents a gene expressed in the tissue sample.
4
RESULT
The intensity of fluorescence at each spot is a measure of the expression of the gene
represented by that spot in the tissue sample. Commonly, two different samples are tested together by
labeling the cDNAs prepared from each sample with a differently colored fluorescence label. The
resulting color at a spot reveals the relative levels of expression of a particular gene in the two samples,
which may be from different tissues or the same tissue under different conditions.
Figure 20.14
Central Dogma
Information Transfer

Dna in basic

  • 1.
    DNA: The SecretOf Our Life (An Introduction Lecture) lecture 1
  • 2.
    Lecture Objectives • Atthe of this Lecture you should be able to learn: • 1. The history of DNA discovery with their importance for the new concepts and application techniques • 2. The chemical and physical properties of DNA and how these properties were exploited for DNA technologies
  • 3.
  • 4.
    We enter the20th century with an understanding of the DNA building block.
  • 5.
    Some Experimental Dataleading to DNA as biological source of DNA • Griffith’s • Avery et al. • Hershey and Chase • Chargaff • Wilkins and Franklin • Watson and Crick
  • 6.
    Griffith’s Experiment: 1928 Conclusion: ATransformation “factor” exists
  • 7.
    Support for nucleicacid transfer Hershey and Chase Experiment, 1952: Confirms DNA as genetic material
  • 8.
    Conclusion: DNA identifiedas source of genetic information
  • 9.
    Franklin and Wilkins1947 1920-1958 1916-2004
  • 10.
  • 11.
    Watson and Crick,1953 inferred the DNA structure
  • 12.
  • 13.
    The building blocksof DNA are nucleotides.
  • 15.
  • 16.
  • 17.
  • 18.
  • 19.
    Back to Franklinand Wilkins Data: Pairing of specific classes of bases can account for diameter of DNA Just right! 6 sided ring 6 sided ring + 5 sided ring
  • 21.
    Most Common SecondaryStructure (3D structure) • B-DNA • Alpha Helix • Right Handed Turn • 10 bases per 360º turn
  • 22.
    A function ofMajor and Minor Grooves
  • 23.
    23 Nucleosides• Nucleosides: nitrogenousbase linked to specific sugar – RNA: adenosine, guanosine, cytidine, uridine – DNA: deoxyadenosine, deoxyguanosine, deoxycytidine, (deoxy)thymidine 138.192.68.68/.../Nucleosides.gif DNA nucleoside RNA nucleoside
  • 24.
    24 Nucleotides The nucleotide structureconsists of – the nitrogenous base attached to the 1’ carbon of deoxyribose – the phosphate group attached to the 5’ carbon of deoxyribose – a free hydroxyl group (-OH) at the 3’ carbon of deoxyribose
  • 25.
    25 Nucleotides • Subunits ofDNA and RNA – Nucleosides linked to phosphate group via ester bond – “dNTP’s”: DNA – “rNTP’s”: RNA
  • 26.
    26 DNA Structure Nucleotides areconnected to each other to form a long chain phosphodiester bond: bond between adjacent nucleotides – formed between the phosphate group of one nucleotide and the 3’ –OH of the next nucleotide The chain of nucleotides has a 5’ to 3’ orientation.
  • 27.
  • 28.
    28 DNA structure determination Chargaff'sRules – Erwin Chargaff determined that • amount of adenine = amount of thymine • amount of cytosine = amount of guanine
  • 29.
    29 DNA Structure The doublehelix consists of: – 2 sugar-phosphate backbones – nitrogenous bases toward the interior of the molecule – bases form hydrogen bonds with complementary bases on the opposite sugar-phosphate backbone • Adenine pairs with Thymine (2 H bonds) • Cytosine pairs with Guanine (3 H Bonds)
  • 30.
  • 31.
    31 DNA Structure The twostrands of nucleotides are antiparallel to each other – one is oriented 5’ to 3’, the other 3’ to 5’ The two strands wrap around each other to create the helical shape of the molecule.
  • 32.
  • 33.
    33 Chemical Properties ofDNA • Factors that affect DNA structure – Temperature: denaturation (can be reversible) – pH: high pH can denature DNA – Salt concentration: lowering salt concentration can denature DNA – Molecular Hybridization (DNA:DNA) and (DNA:RNA) – UV absorption (230-260nm)
  • 34.
    • Southern blottingof DNA fragments APPLICATION Researchers can detect specific nucleotide sequences within a DNA sample with this method. In particular, Southern blotting is useful for comparing the restriction fragments produced from different samples of genomic DNA. TECHNIQUE In this example, we compare genomic DNA samples from three individuals: a homozygote for the normal -globin allele (I), a homozygote for the mutant sickle-cell allele (II), and a heterozygote (III). DNA + restriction enzyme Restriction fragments I II III I Normal -globin allele II Sickle-cell allele III Heterozygote Preparation of restriction fragments. Gel electrophoresis. Blotting. Gel Sponge Alkaline solution Nitrocellulose paper (blot) Heavy weight Paper towels 1 2 3 Figure 20.10
  • 35.
    RESULTS Because theband patterns for the three samples are clearly different, this method can be used to identify heterozygous carriers of the sickle-cell allele (III), as well as those with the disease, who have two mutant alleles (II), and unaffected individuals, who have two normal alleles (I). The band patterns for samples I and II resemble those observed for the purified normal and mutant alleles, respectively, seen in Figure 20.9b. The band pattern for the sample from the heterozygote (III) is a combination of the patterns for the two homozygotes (I and II). Radioactively labeled probe for -globin gene is added to solution in a plastic bag Probe hydrogen- bonds to fragments containing normal or mutant -globin Fragment from sickle-cell -globin allele Fragment from normal -globin allele Paper blot Film over paper blot Hybridization with radioactive probe. Autoradiography. I II III I II III 1 2
  • 36.
    • DNA microarrayassay of gene expression levels APPLICATION TECHNIQUE Tissue sample mRNA molecules Labeled cDNA molecules (single strands) DNA microarray Size of an actual DNA microarray with all the genes of yeast (6,400 spots) Isolate mRNA.1 With this method, researchers can test thousands of genes simultaneously to determine which ones are expressed in a particular tissue, under different environmental conditions in various disease states, or at different developmental stages. They can also look for coordinated gene expression. Make cDNA by reverse transcription, using fluores-cently labeled nucleotides.2 Apply the cDNA mixture to a microarray, a microscope slide on which copies of single-stranded DNA fragments from the organism‘s genes are fixed, a different gene in each spot. The cDNA hybridizes with any complementary DNA on the microarray. 3 Rinse off excess cDNA; scan microarray for fluorescence. Each fluorescent spot (yellow) represents a gene expressed in the tissue sample. 4 RESULT The intensity of fluorescence at each spot is a measure of the expression of the gene represented by that spot in the tissue sample. Commonly, two different samples are tested together by labeling the cDNAs prepared from each sample with a differently colored fluorescence label. The resulting color at a spot reveals the relative levels of expression of a particular gene in the two samples, which may be from different tissues or the same tissue under different conditions. Figure 20.14
  • 37.