Downloaded 403 times


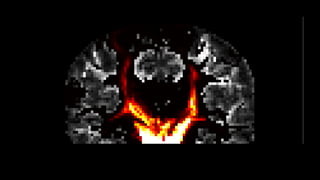


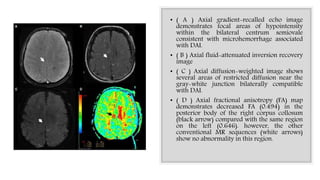

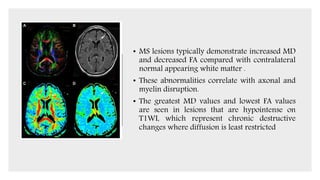

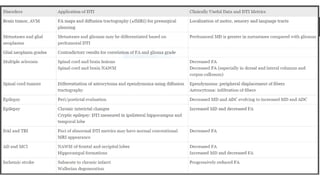
![Comparison of conventional T1- (A) and
T2- (B) weighted images, and DTI-derived
mean diffusivity (MD) (C), fractional
anisotropy (FA) (D), and color-coded
orientation (E) maps of cognitively normal
72-year-old woman (upper row) and 70-
year-old woman with Alzheimer’s disease.
The areas surrounded by yellow rectangles
in (E) are magnified and shown in (F) [left
(F-1): from the cognitively normal woman;
right (F-2): the Alzheimer’s disease patient].
The yellow arrows indicate the cingulum
hippocampal part.](https://image.slidesharecdn.com/diffusiontensorimaginginneurology-170514021419/85/Diffusion-tensor-imaging-in-Neurology-52-320.jpg)


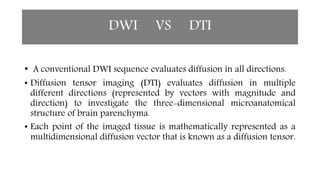
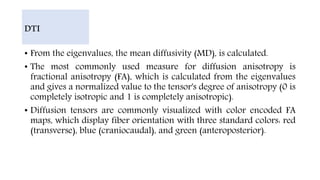
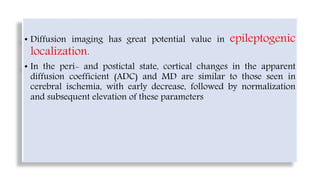
The document discusses diffusion tensor imaging (DTI) in neurology, detailing how it allows the study of water molecule diffusion in brain tissue to map microanatomical structures. It contrasts DTI with conventional diffusion-weighted imaging (DWI), highlighting DTI's ability to evaluate diffusion directionally and characterize brain conditions such as tumors, multiple sclerosis, and epilepsy. Additionally, the document addresses practical applications of DTI, including pre-surgical planning and diagnosis, as well as its limitations and the importance of combining it with conventional MRI for better analysis.