


![Choline (Cho)
• Peak at 3.22; [tCho(free choline (Cho),phosphocholine (PC) and glycerophosphocholine (GPC)]
• Metabolic index of membrane density and integrity as well as membrane turnover
• Elevation of tCho include accelerated membrane synthesis of rapidly dividing cancer cells in brain
tumors - correlate with degree of malignancy
• Also increase in cerebral infractions, infectious diseases and inflammatory-demyelinating diseases ;
non-specific
• A marked physiologic regional variability with higher concentrations observed in the pons and
lower levels in the vermis and dentate](https://image.slidesharecdn.com/mrspectroscopy-copy-201206191952/85/MR-spectroscopy-19-320.jpg)


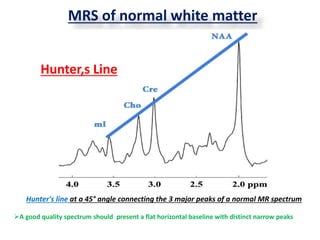
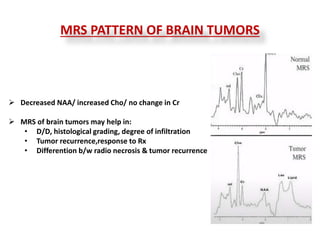


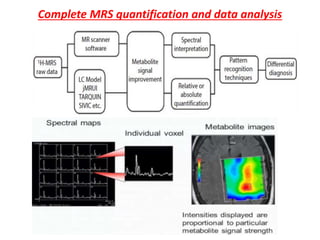
1. Magnetic resonance spectroscopy (MRS) provides information about the metabolic and biochemical composition of brain tissue by detecting certain metabolites. It can help differentiate between various brain pathologies and tumor types. 2. Common metabolites detected by MRS include NAA, creatine, choline, myoinositol, and lactate. Changes in levels of these metabolites indicate different disease states. For example, decreased NAA and increased choline suggest a brain tumor. 3. MRS has various clinical applications such as distinguishing tumor recurrence from treatment effects like radiation necrosis, tumor grading, aiding tumor biopsy, and monitoring responses to therapy. It provides complementary information to structural MRI for diagnostic and management purposes.


