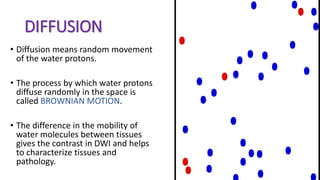
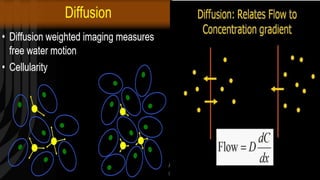
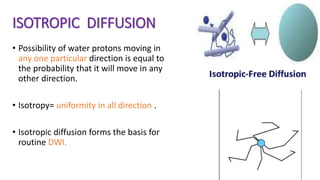
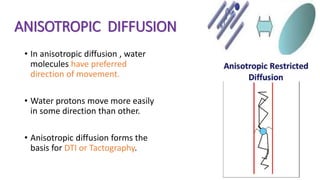
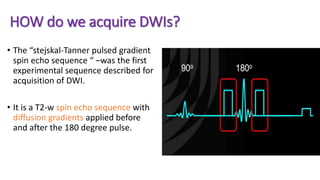
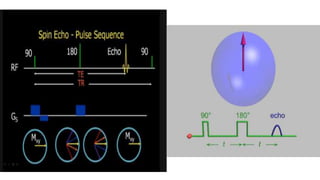
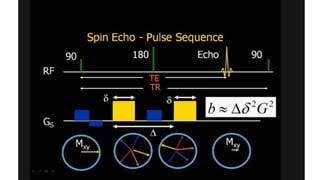
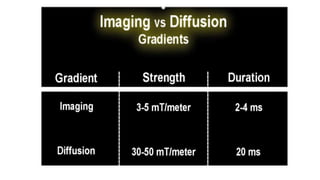
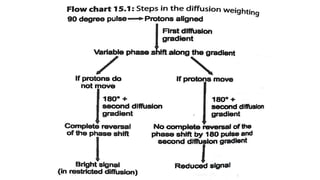
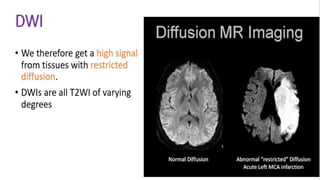
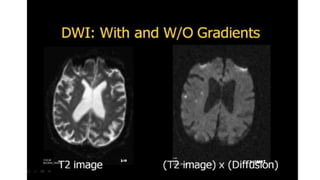
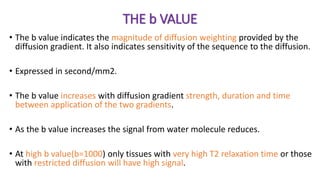
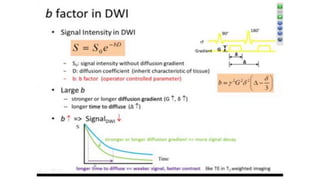
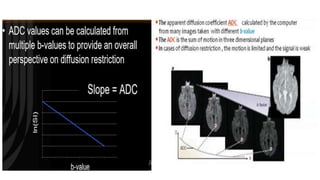
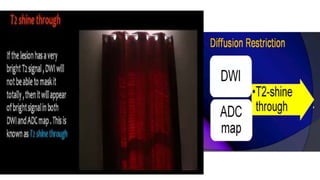
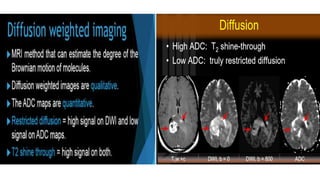
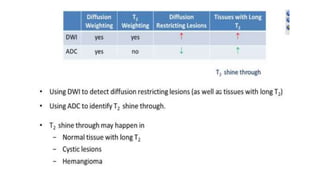
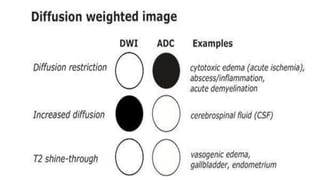
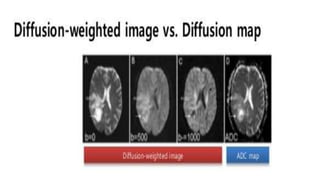
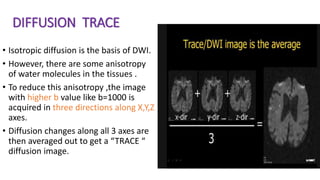
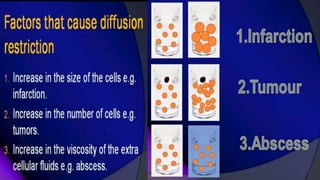
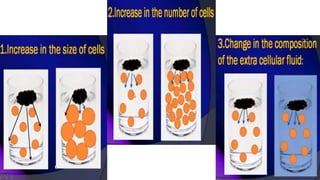
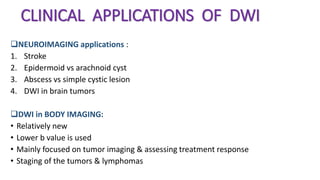
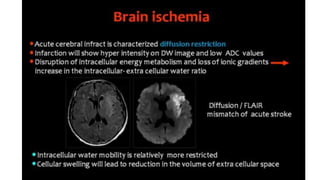
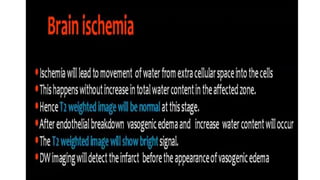
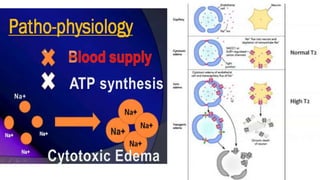
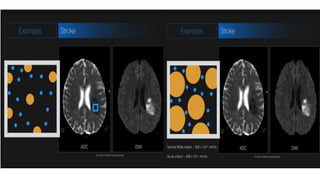
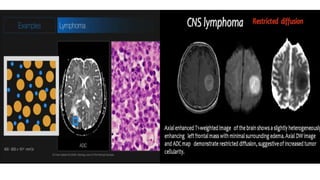
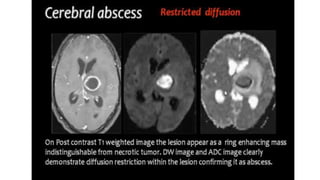
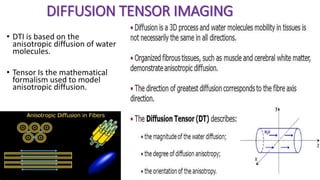
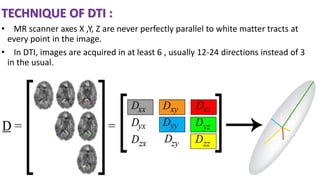
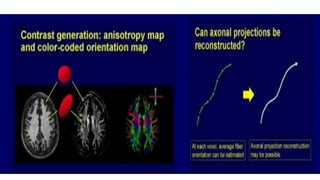
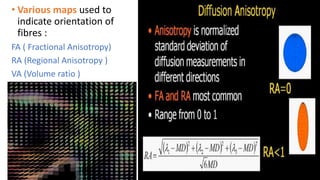
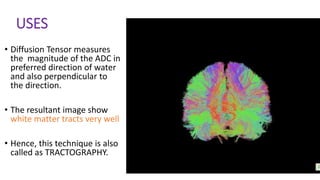
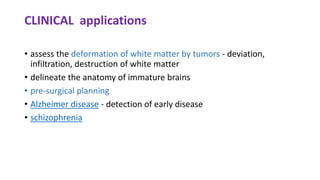
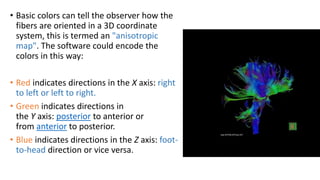
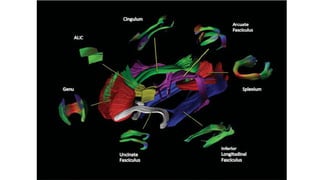
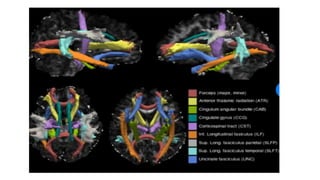
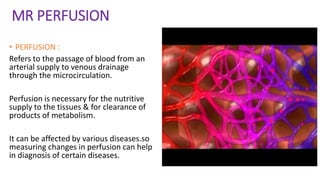
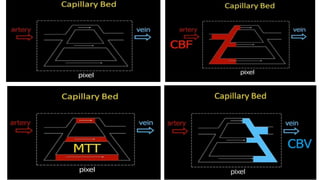
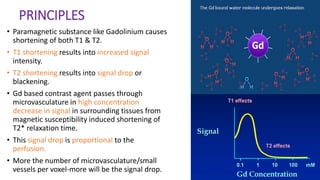
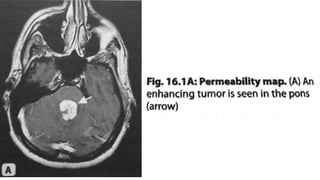
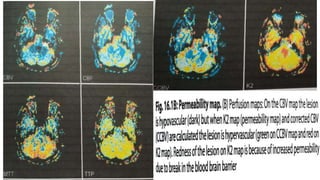
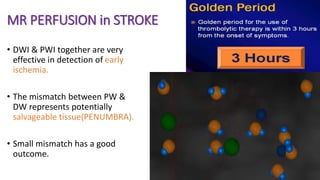
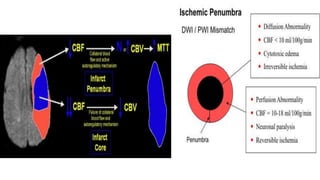
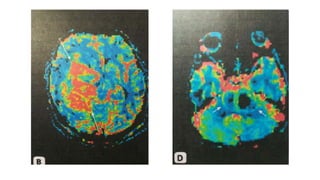
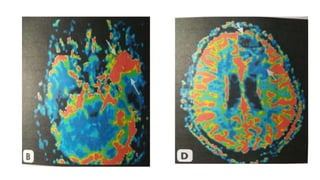
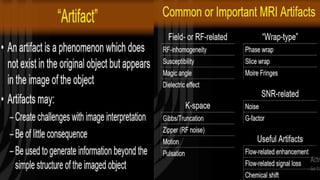
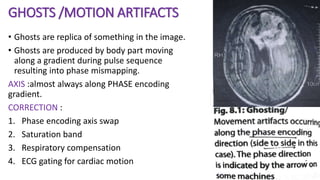
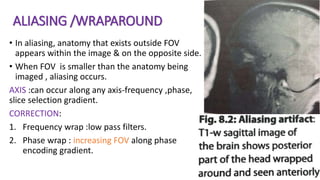
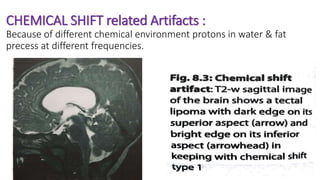
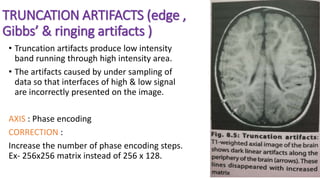
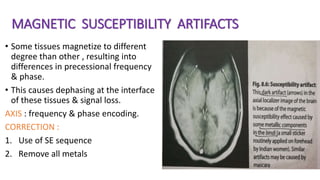
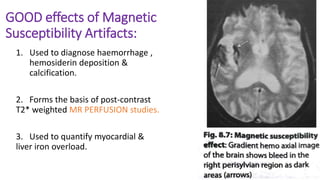
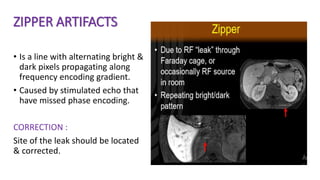
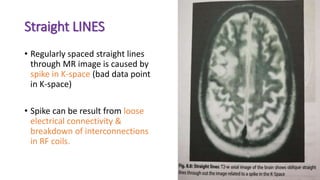
MR DIFFUSION ,
PERFUSION and
ARTIFACTS
DR. YASNA KIBRIA
MD RESIDENT ,PHASE-A
Department of RADIOLOGY and IMAGING
BSMMU
DIFFUSION
• Diffusion means random movement
of the water protons.
• The process by which water protons
diffuse randomly in the space is
called BROWNIAN MOTION.
• The difference in the mobility of
water molecules between tissues
gives the contrast in DWI and helps
to characterize tissues and
pathology.
ISOTROPIC DIFFUSION
• Possibility of water protons moving in
any one particular direction is equal to
the probability that it will move in any
other direction.
• Isotropy= uniformity in all direction .
• Isotropic diffusion forms the basis for
routine DWI.
ANISOTROPIC DIFFUSION
• In anisotropic diffusion , water
molecules have preferred
direction of movement.
• Water protons move more easily
in some direction than other.
• Anisotropic diffusion forms the
basis for DTI or Tactography.
HOW do we acquire DWIs?
• The “stejskal-Tanner pulsed gradient
spin echo sequence “ –was the first
experimental sequence described for
acquisition of DWI.
• It is a T2-w spin echo sequence with
diffusion gradients applied before
and after the 180 degree pulse.
THE b VALUE
• The b value indicates the magnitude of diffusion weighting provided by the
diffusion gradient. It also indicates sensitivity of the sequence to the diffusion.
• Expressed in second/mm2.
• The b value increases with diffusion gradient strength, duration and time
between application of the two gradients.
• As the b value increases the signal from water molecule reduces.
• At high b value(b=1000) only tissues with very high T2 relaxation time or those
with restricted diffusion will have high signal.
DIFFUSION TRACE
• Isotropic diffusion is the basis of DWI.
• However, there are some anisotropy
of water molecules in the tissues .
• To reduce this anisotropy ,the image
with higher b value like b=1000 is
acquired in three directions along X,Y,Z
axes.
• Diffusion changes along all 3 axes are
then averaged out to get a “TRACE “
diffusion image.
CLINICAL APPLICATIONS OF DWI
NEUROIMAGING applications :
1. Stroke
2. Epidermoid vs arachnoid cyst
3. Abscess vs simple cystic lesion
4. DWI in brain tumors
DWI in BODY IMAGING:
• Relatively new
• Lower b value is used
• Mainly focused on tumor imaging & assessing treatment response
• Staging of the tumors & lymphomas
DIFFUSION TENSOR IMAGING
• DTI is based on the
anisotropic diffusion of water
molecules.
• Tensor Is the mathematical
formalism used to model
anisotropic diffusion.
TECHNIQUE OF DTI :
• MR scanner axes X ,Y, Z are never perfectly parallel to white matter tracts at
every point in the image.
• In DTI, images are acquired in at least 6 , usually 12-24 directions instead of 3
in the usual.
• Various maps used to
indicate orientation of
fibres :
FA ( Fractional Anisotropy)
RA (Regional Anisotropy )
VA (Volume ratio )
USES
• Diffusion Tensor measures
the magnitude of the ADC in
preferred direction of water
and also perpendicular to
the direction.
• The resultant image show
white matter tracts very well
• Hence, this technique is also
called as TRACTOGRAPHY.
CLINICAL applications
• assess the deformation of white matter by tumors - deviation,
infiltration, destruction of white matter
• delineate the anatomy of immature brains
• pre-surgical planning
• Alzheimer disease - detection of early disease
• schizophrenia
• Basic colors can tell the observer how the
fibers are oriented in a 3D coordinate
system, this is termed an "anisotropic
map". The software could encode the
colors in this way:
• Red indicates directions in the X axis: right
to left or left to right.
• Green indicates directions in
the Y axis: posterior to anterior or
from anterior to posterior.
• Blue indicates directions in the Z axis: foot-
to-head direction or vice versa.
MR PERFUSION
• PERFUSION :
Refers to the passage of blood from an
arterial supply to venous drainage
through the microcirculation.
Perfusion is necessary for the nutritive
supply to the tissues & for clearance of
products of metabolism.
It can be affected by various diseases.so
measuring changes in perfusion can help
in diagnosis of certain diseases.
PRINCIPLES
• Paramagnetic substance like Gadolinium causes
shortening of both T1 & T2.
• T1 shortening results into increased signal
intensity.
• T2 shortening results into signal drop or
blackening.
• Gd based contrast agent passes through
microvasculature in high concentration
decrease in signal in surrounding tissues from
magnetic susceptibility induced shortening of
T2* relaxation time.
• This signal drop is proportional to the
perfusion.
• More the number of microvasculature/small
vessels per voxel-more will be the signal drop.
Technique of MR PERFUSION with exogenous
contrast agent (DSC ):
• A dose of 0.1 mmol/kg of Gd based
CONTRAST AGENT is injected
intravenously using power injector at
the rate of 5 ml/sec .
• Fast T2* weighted EPI sequence is run
to catch first pass of the contrast
through microcirculation.
• This sequence typically acquire 15-20
slices covering entire brain in 1-2
seconds.
• From raw data images various color
maps are constructed using
software.
• These maps include :
1. rCBV: relative Cerebral Blood
Volume
2. CBF:Cerebral Blood Flow
3. TTP: Time to Peak
4. MTT: Mean Transit Time
Routine contrast
enhancement
Perfusion imaging
1. Sequence T1 weighted imaging T2* weighted EPI sequence
2. Signal change Increase in signal intensity Drop in signal intensity
3. Mechanism Gd causes reduction in T1
relaxation time
Gd causes reduction in T2 or
T2* relaxation time &
magnetic susceptibility
4. Detects Break in the BBB leading to
leakage of Gd
Gd in the microvasculature
(capillaries).
Thus gives information about
number of small vessels
(vascularity ) & perfusion of
the tissue.
PERMEABILITY OR LEAKINESS
• Increased permeability or leakiness
because of break in BBB results in
accumulation of Gd based contrast in
extravascular space.
• T1 enhancing effects of this extravascular
Gd may predominate to counteract the T2
signal lowering effect of intravascular Gd,
resulting in falsely low rCBV values.
• To reduce permeability induced effects on
rCBV include mathematical calculation of
PERMEABILITY or K2 maps.
MR PERFUSION in STROKE
• DWI & PWI together are very
effective in detection of early
ischemia.
• The mismatch between PW &
DW represents potentially
salvageable tissue(PENUMBRA).
• Small mismatch has a good
outcome.
MR PERFUSION in brain TUMORs
• MR perfusion can be useful in-
1. Grading tumors like gliomas
2. In guiding biopsies
3. Differentiating between therapy induced necrosis & recurrent /residual
tumors.
OTHER clinical uses: CNS vasculitis
GHOSTS /MOTION ARTIFACTS
• Ghosts are replica of something in the image.
• Ghosts are produced by body part moving
along a gradient during pulse sequence
resulting into phase mismapping.
AXIS :almost always along PHASE encoding
gradient.
CORRECTION :
1. Phase encoding axis swap
2. Saturation band
3. Respiratory compensation
4. ECG gating for cardiac motion
ALIASING /WRAPAROUND
• In aliasing, anatomy that exists outside FOV
appears within the image & on the opposite side.
• When FOV is smaller than the anatomy being
imaged , aliasing occurs.
AXIS :can occur along any axis-frequency ,phase,
slice selection gradient.
CORRECTION:
1. Frequency wrap :low pass filters.
2. Phase wrap : increasing FOV along phase
encoding gradient.
CHEMICAL SHIFT related Artifacts :
Because of different chemical environment protons in water & fat
precess at different frequencies.
TRUNCATION ARTIFACTS (edge ,
Gibbs’ & ringing artifacts )
• Truncation artifacts produce low intensity
band running through high intensity area.
• The artifacts caused by under sampling of
data so that interfaces of high & low signal
are incorrectly presented on the image.
AXIS : Phase encoding
CORRECTION :
Increase the number of phase encoding steps.
Ex- 256x256 matrix instead of 256 x 128.
MAGNETIC SUSCEPTIBILITY ARTIFACTS
• Some tissues magnetize to different
degree than other , resulting into
differences in precessional frequency
& phase.
• This causes dephasing at the interface
of these tissues & signal loss.
AXIS : frequency & phase encoding.
CORRECTION :
1. Use of SE sequence
2. Remove all metals
GOOD effects of Magnetic
Susceptibility Artifacts:
1. Used to diagnose haemorrhage ,
hemosiderin deposition &
calcification.
2. Forms the basis of post-contrast
T2* weighted MR PERFUSION studies.
3. Used to quantify myocardial &
liver iron overload.
ZIPPER ARTIFACTS
• Is a line with alternating bright &
dark pixels propagating along
frequency encoding gradient.
• Caused by stimulated echo that
have missed phase encoding.
CORRECTION :
Site of the leak should be located
& corrected.
Straight LINES
• Regularly spaced straight lines
through MR image is caused by
spike in K-space (bad data point
in K-space)
• Spike can be result from loose
electrical connectivity &
breakdown of interconnections
in RF coils.
SHADING ARTIFACTS
• In shading artifacts , image has
uneven contrast with loss of signal
intensity in one part of image.
• Uneven excitation of the nuclei due
to RF pulses applied at flip angle
other than 90 & 180 degree ,
abnormal loading of the
coil,inhomogeneity of the magnetic
field.
CORRECTION :
1. Load the coil correctly
2. Shimming to reduce magnetic field
inhomogeneity.
CLINICAL importance of OTHER MR
SEQUENCES:
 T1 WEIGHTED IMAGES :
Subacute haemorrhage
Fat containing structures
Anatomical details
 T2 WEIGHTED IMAGES:
Edema
Demyelination
Infarction
Chronic haemorrhage
 STIR :
Bone marrow imaging
Orbital imaging
SI joint imaging
 FLAIR :
Peri-lesional edema
Brain infarction
Sub-arachnoid haemorrhage
Syrinx /cysts in spinal cord
PD weighted images:
Detection of joint & muscle diseases &
injuries.
Well differentiation of GM & WM in brain.
MR DIFFUSION PERFUSION & ARTIFACTS.pptx

MR DIFFUSION PERFUSION & ARTIFACTS.pptx

  • 1.
    MR DIFFUSION , PERFUSIONand ARTIFACTS DR. YASNA KIBRIA MD RESIDENT ,PHASE-A Department of RADIOLOGY and IMAGING BSMMU
  • 2.
    DIFFUSION • Diffusion meansrandom movement of the water protons. • The process by which water protons diffuse randomly in the space is called BROWNIAN MOTION. • The difference in the mobility of water molecules between tissues gives the contrast in DWI and helps to characterize tissues and pathology.
  • 5.
    ISOTROPIC DIFFUSION • Possibilityof water protons moving in any one particular direction is equal to the probability that it will move in any other direction. • Isotropy= uniformity in all direction . • Isotropic diffusion forms the basis for routine DWI.
  • 6.
    ANISOTROPIC DIFFUSION • Inanisotropic diffusion , water molecules have preferred direction of movement. • Water protons move more easily in some direction than other. • Anisotropic diffusion forms the basis for DTI or Tactography.
  • 8.
    HOW do weacquire DWIs? • The “stejskal-Tanner pulsed gradient spin echo sequence “ –was the first experimental sequence described for acquisition of DWI. • It is a T2-w spin echo sequence with diffusion gradients applied before and after the 180 degree pulse.
  • 16.
    THE b VALUE •The b value indicates the magnitude of diffusion weighting provided by the diffusion gradient. It also indicates sensitivity of the sequence to the diffusion. • Expressed in second/mm2. • The b value increases with diffusion gradient strength, duration and time between application of the two gradients. • As the b value increases the signal from water molecule reduces. • At high b value(b=1000) only tissues with very high T2 relaxation time or those with restricted diffusion will have high signal.
  • 28.
    DIFFUSION TRACE • Isotropicdiffusion is the basis of DWI. • However, there are some anisotropy of water molecules in the tissues . • To reduce this anisotropy ,the image with higher b value like b=1000 is acquired in three directions along X,Y,Z axes. • Diffusion changes along all 3 axes are then averaged out to get a “TRACE “ diffusion image.
  • 31.
    CLINICAL APPLICATIONS OFDWI NEUROIMAGING applications : 1. Stroke 2. Epidermoid vs arachnoid cyst 3. Abscess vs simple cystic lesion 4. DWI in brain tumors DWI in BODY IMAGING: • Relatively new • Lower b value is used • Mainly focused on tumor imaging & assessing treatment response • Staging of the tumors & lymphomas
  • 38.
    DIFFUSION TENSOR IMAGING •DTI is based on the anisotropic diffusion of water molecules. • Tensor Is the mathematical formalism used to model anisotropic diffusion.
  • 39.
    TECHNIQUE OF DTI: • MR scanner axes X ,Y, Z are never perfectly parallel to white matter tracts at every point in the image. • In DTI, images are acquired in at least 6 , usually 12-24 directions instead of 3 in the usual.
  • 41.
    • Various mapsused to indicate orientation of fibres : FA ( Fractional Anisotropy) RA (Regional Anisotropy ) VA (Volume ratio )
  • 42.
    USES • Diffusion Tensormeasures the magnitude of the ADC in preferred direction of water and also perpendicular to the direction. • The resultant image show white matter tracts very well • Hence, this technique is also called as TRACTOGRAPHY.
  • 43.
    CLINICAL applications • assessthe deformation of white matter by tumors - deviation, infiltration, destruction of white matter • delineate the anatomy of immature brains • pre-surgical planning • Alzheimer disease - detection of early disease • schizophrenia
  • 44.
    • Basic colorscan tell the observer how the fibers are oriented in a 3D coordinate system, this is termed an "anisotropic map". The software could encode the colors in this way: • Red indicates directions in the X axis: right to left or left to right. • Green indicates directions in the Y axis: posterior to anterior or from anterior to posterior. • Blue indicates directions in the Z axis: foot- to-head direction or vice versa.
  • 47.
    MR PERFUSION • PERFUSION: Refers to the passage of blood from an arterial supply to venous drainage through the microcirculation. Perfusion is necessary for the nutritive supply to the tissues & for clearance of products of metabolism. It can be affected by various diseases.so measuring changes in perfusion can help in diagnosis of certain diseases.
  • 49.
    PRINCIPLES • Paramagnetic substancelike Gadolinium causes shortening of both T1 & T2. • T1 shortening results into increased signal intensity. • T2 shortening results into signal drop or blackening. • Gd based contrast agent passes through microvasculature in high concentration decrease in signal in surrounding tissues from magnetic susceptibility induced shortening of T2* relaxation time. • This signal drop is proportional to the perfusion. • More the number of microvasculature/small vessels per voxel-more will be the signal drop.
  • 50.
    Technique of MRPERFUSION with exogenous contrast agent (DSC ): • A dose of 0.1 mmol/kg of Gd based CONTRAST AGENT is injected intravenously using power injector at the rate of 5 ml/sec . • Fast T2* weighted EPI sequence is run to catch first pass of the contrast through microcirculation. • This sequence typically acquire 15-20 slices covering entire brain in 1-2 seconds. • From raw data images various color maps are constructed using software. • These maps include : 1. rCBV: relative Cerebral Blood Volume 2. CBF:Cerebral Blood Flow 3. TTP: Time to Peak 4. MTT: Mean Transit Time
  • 52.
    Routine contrast enhancement Perfusion imaging 1.Sequence T1 weighted imaging T2* weighted EPI sequence 2. Signal change Increase in signal intensity Drop in signal intensity 3. Mechanism Gd causes reduction in T1 relaxation time Gd causes reduction in T2 or T2* relaxation time & magnetic susceptibility 4. Detects Break in the BBB leading to leakage of Gd Gd in the microvasculature (capillaries). Thus gives information about number of small vessels (vascularity ) & perfusion of the tissue.
  • 53.
    PERMEABILITY OR LEAKINESS •Increased permeability or leakiness because of break in BBB results in accumulation of Gd based contrast in extravascular space. • T1 enhancing effects of this extravascular Gd may predominate to counteract the T2 signal lowering effect of intravascular Gd, resulting in falsely low rCBV values. • To reduce permeability induced effects on rCBV include mathematical calculation of PERMEABILITY or K2 maps.
  • 56.
    MR PERFUSION inSTROKE • DWI & PWI together are very effective in detection of early ischemia. • The mismatch between PW & DW represents potentially salvageable tissue(PENUMBRA). • Small mismatch has a good outcome.
  • 58.
    MR PERFUSION inbrain TUMORs • MR perfusion can be useful in- 1. Grading tumors like gliomas 2. In guiding biopsies 3. Differentiating between therapy induced necrosis & recurrent /residual tumors. OTHER clinical uses: CNS vasculitis
  • 62.
    GHOSTS /MOTION ARTIFACTS •Ghosts are replica of something in the image. • Ghosts are produced by body part moving along a gradient during pulse sequence resulting into phase mismapping. AXIS :almost always along PHASE encoding gradient. CORRECTION : 1. Phase encoding axis swap 2. Saturation band 3. Respiratory compensation 4. ECG gating for cardiac motion
  • 63.
    ALIASING /WRAPAROUND • Inaliasing, anatomy that exists outside FOV appears within the image & on the opposite side. • When FOV is smaller than the anatomy being imaged , aliasing occurs. AXIS :can occur along any axis-frequency ,phase, slice selection gradient. CORRECTION: 1. Frequency wrap :low pass filters. 2. Phase wrap : increasing FOV along phase encoding gradient.
  • 64.
    CHEMICAL SHIFT relatedArtifacts : Because of different chemical environment protons in water & fat precess at different frequencies.
  • 65.
    TRUNCATION ARTIFACTS (edge, Gibbs’ & ringing artifacts ) • Truncation artifacts produce low intensity band running through high intensity area. • The artifacts caused by under sampling of data so that interfaces of high & low signal are incorrectly presented on the image. AXIS : Phase encoding CORRECTION : Increase the number of phase encoding steps. Ex- 256x256 matrix instead of 256 x 128.
  • 66.
    MAGNETIC SUSCEPTIBILITY ARTIFACTS •Some tissues magnetize to different degree than other , resulting into differences in precessional frequency & phase. • This causes dephasing at the interface of these tissues & signal loss. AXIS : frequency & phase encoding. CORRECTION : 1. Use of SE sequence 2. Remove all metals
  • 67.
    GOOD effects ofMagnetic Susceptibility Artifacts: 1. Used to diagnose haemorrhage , hemosiderin deposition & calcification. 2. Forms the basis of post-contrast T2* weighted MR PERFUSION studies. 3. Used to quantify myocardial & liver iron overload.
  • 68.
    ZIPPER ARTIFACTS • Isa line with alternating bright & dark pixels propagating along frequency encoding gradient. • Caused by stimulated echo that have missed phase encoding. CORRECTION : Site of the leak should be located & corrected.
  • 69.
    Straight LINES • Regularlyspaced straight lines through MR image is caused by spike in K-space (bad data point in K-space) • Spike can be result from loose electrical connectivity & breakdown of interconnections in RF coils.
  • 70.
    SHADING ARTIFACTS • Inshading artifacts , image has uneven contrast with loss of signal intensity in one part of image. • Uneven excitation of the nuclei due to RF pulses applied at flip angle other than 90 & 180 degree , abnormal loading of the coil,inhomogeneity of the magnetic field. CORRECTION : 1. Load the coil correctly 2. Shimming to reduce magnetic field inhomogeneity.
  • 71.
    CLINICAL importance ofOTHER MR SEQUENCES:  T1 WEIGHTED IMAGES : Subacute haemorrhage Fat containing structures Anatomical details  T2 WEIGHTED IMAGES: Edema Demyelination Infarction Chronic haemorrhage  STIR : Bone marrow imaging Orbital imaging SI joint imaging  FLAIR : Peri-lesional edema Brain infarction Sub-arachnoid haemorrhage Syrinx /cysts in spinal cord PD weighted images: Detection of joint & muscle diseases & injuries. Well differentiation of GM & WM in brain.