Downloaded 5,992 times
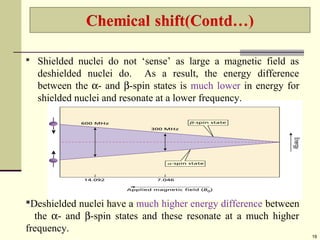
![ The relative energy of resonance of a particular nucleus resulting
from its local environment is called chemical shift.
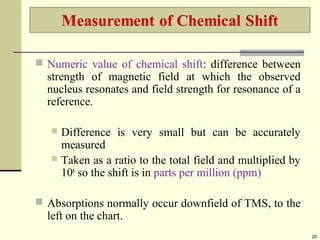
NMR spectra show applied field strength increasing from left to
right.
Left part is downfield, the right is upfield.
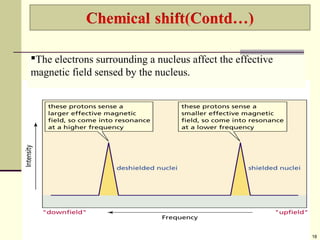
Nuclei that absorb on upfield side are strongly shielded where
nuclei that absorb on downfield side is weakly shielded.
Chart calibrated versus a reference point, set as 0, tetramethylsilane
[TMS].
17](https://image.slidesharecdn.com/resonancespectroscopy-150224122016-conversion-gate01/85/Nuclear-Magnetic-Resonance-Spectroscopy-17-320.jpg)
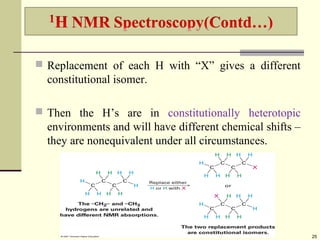


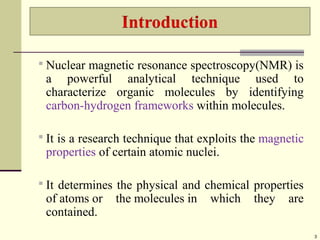
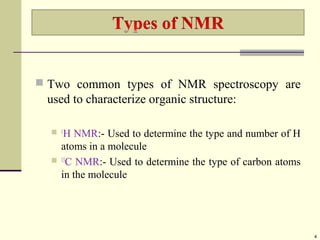
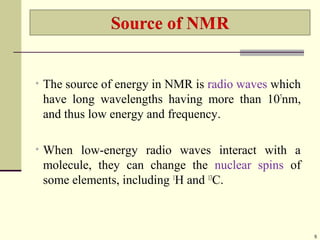
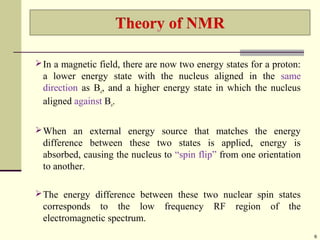
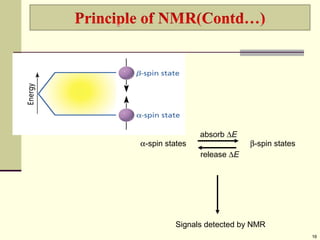
Nuclear Magnetic Resonance Spectroscopy is a technique used to characterize organic molecules by identifying carbon-hydrogen frameworks. It exploits the magnetic properties of atomic nuclei when subjected to radio waves and magnetic fields. There are two main types of NMR spectroscopy: 1H NMR determines the number and type of hydrogen atoms, and 13C NMR determines the type of carbon atoms. When nuclei are placed in a magnetic field, their spins can be aligned with or against the field, producing detectable signals. Chemical shifts in these signals provide information about the molecular structure and atomic environment of the nuclei.