Downloaded 467 times

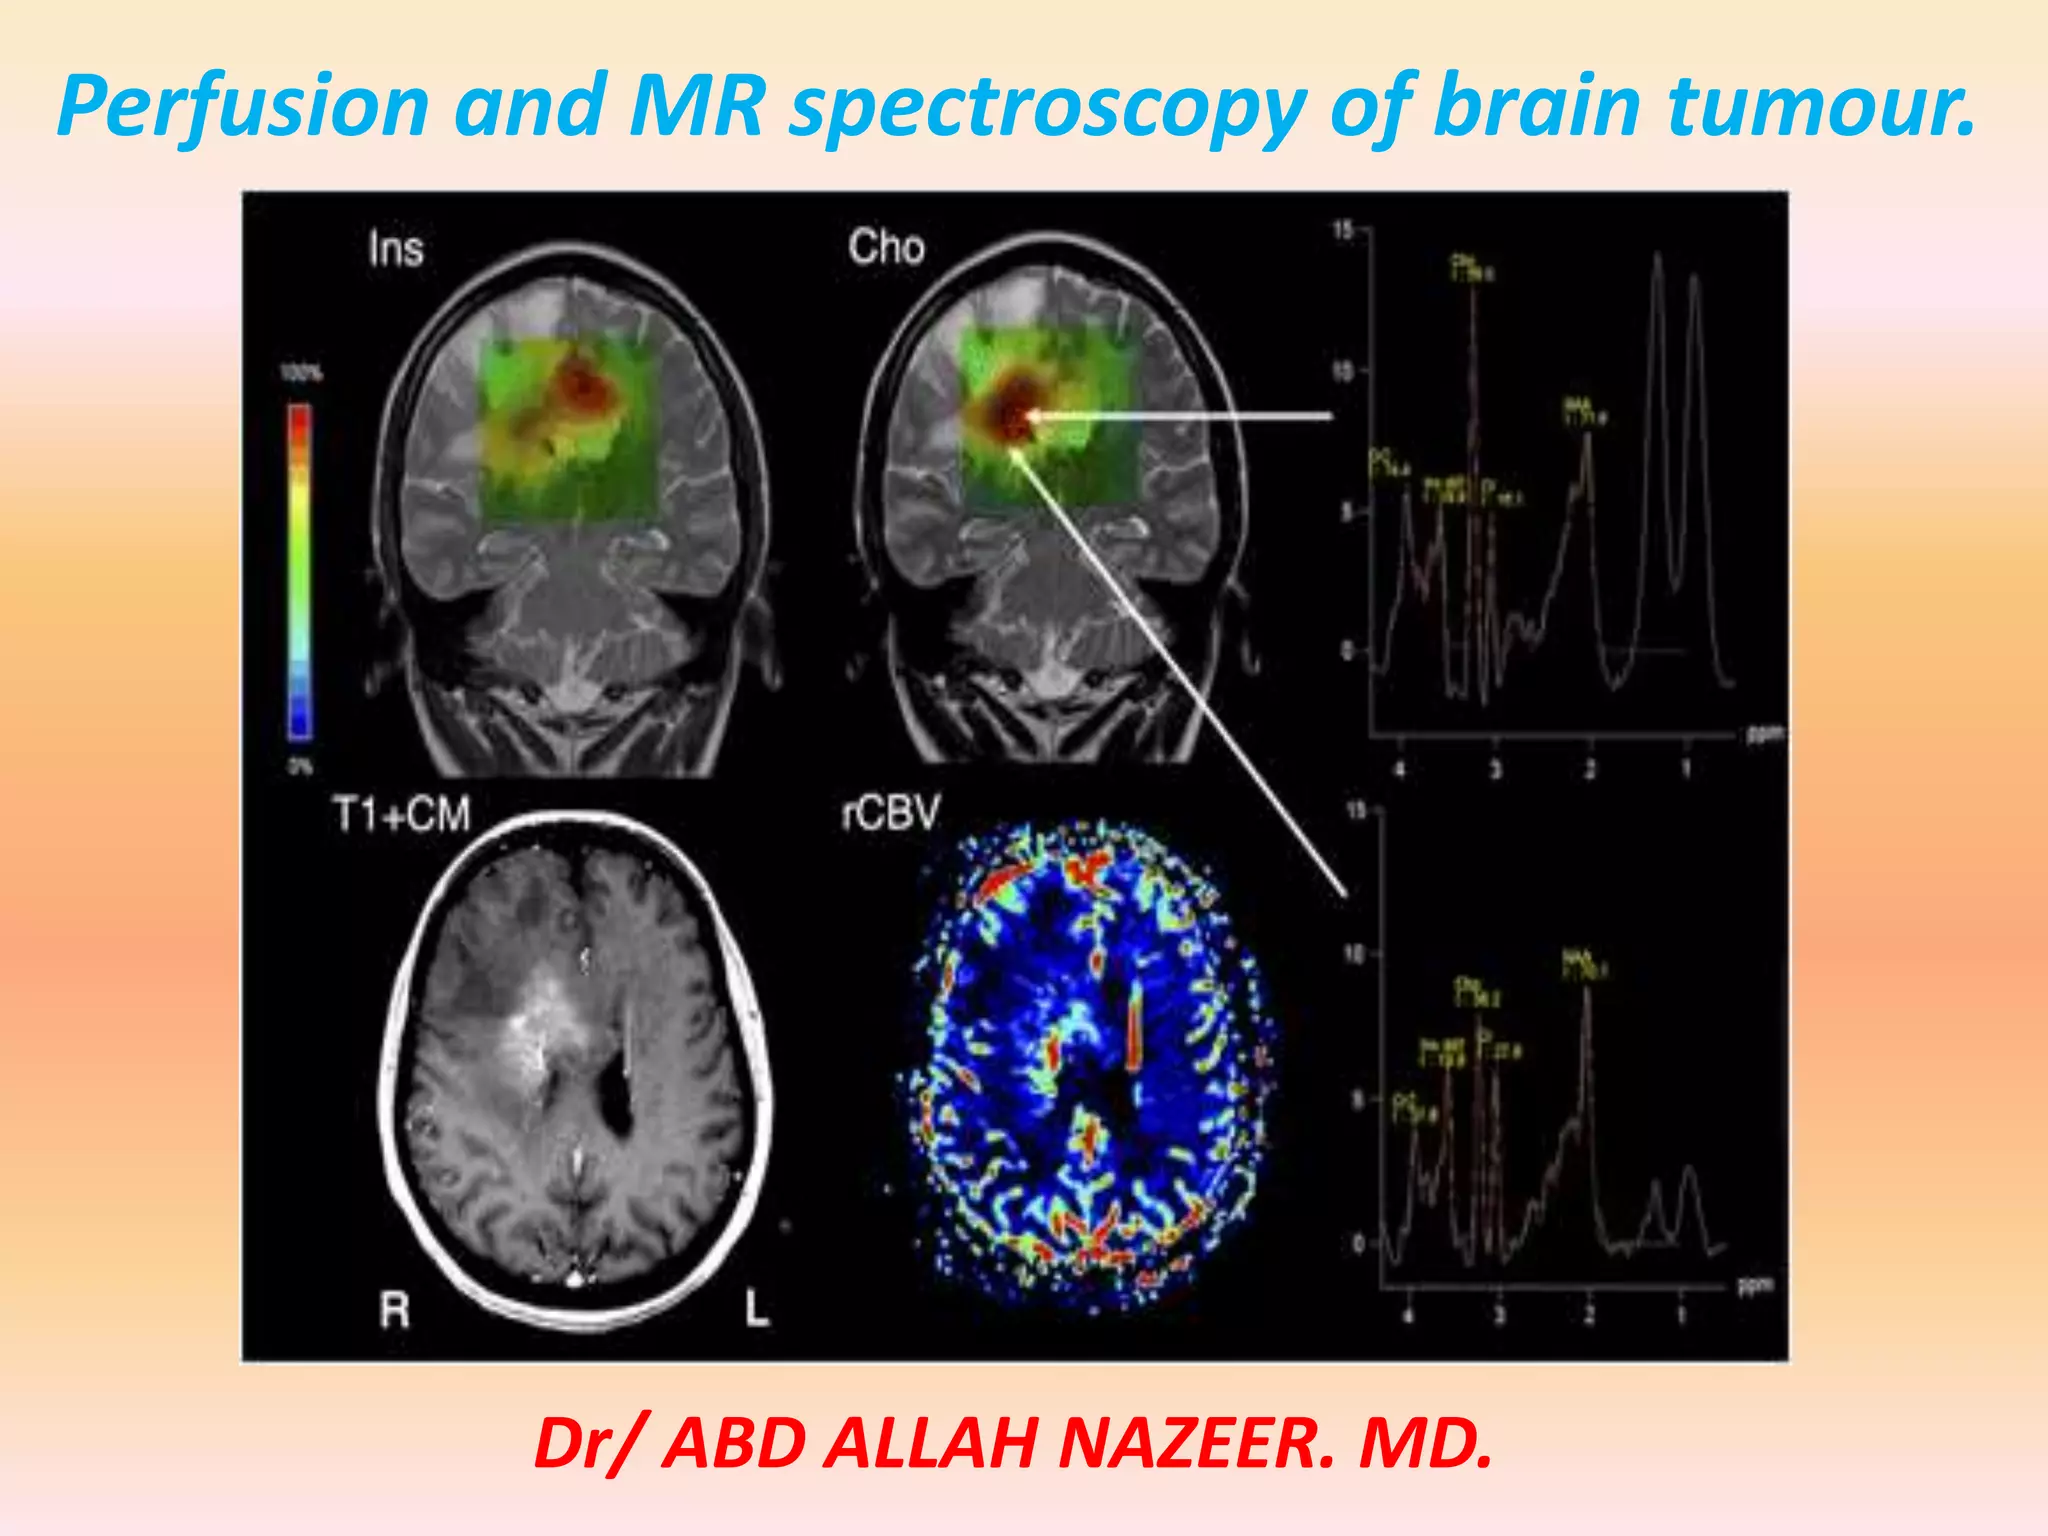
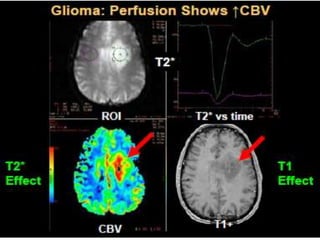
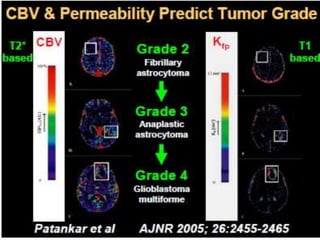
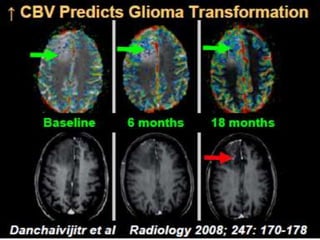
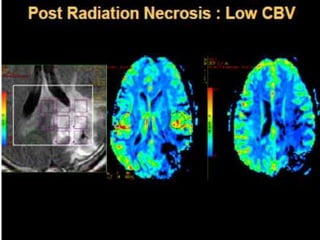
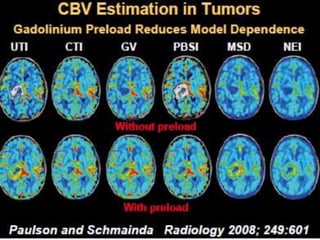
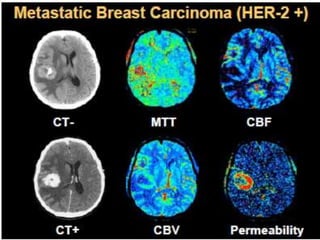
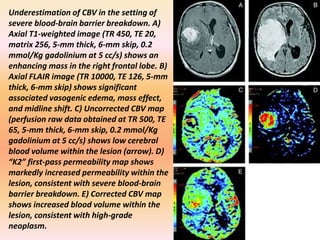
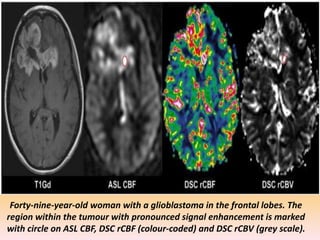
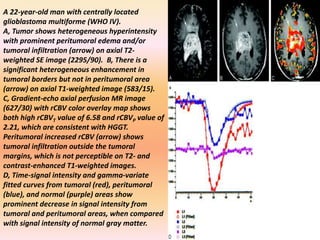
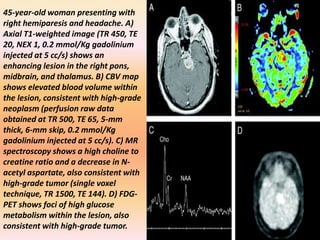
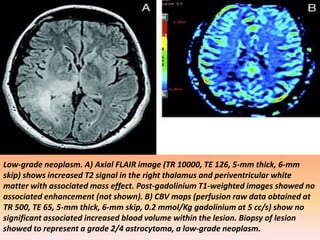
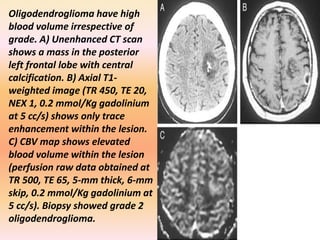
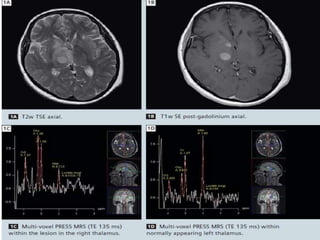
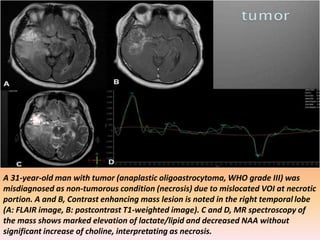
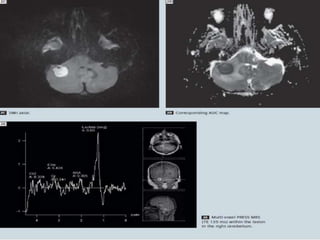
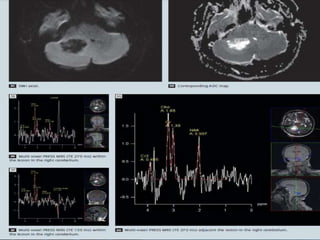
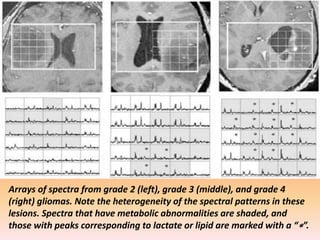


The document discusses the use of perfusion MRI and MR spectroscopy in evaluating brain tumors. It states that perfusion MRI can help estimate tumor grade, guide biopsy to aggressive portions, and better delineate tumor margins compared to conventional MRI. MR spectroscopy can detect metabolic alterations to help characterize tumors and differentiate them from other conditions like abscesses. Together, perfusion MRI and MR spectroscopy provide physiological and metabolic information complementary to anatomical MRI for diagnosing and monitoring brain tumors.


