Downloaded 147 times
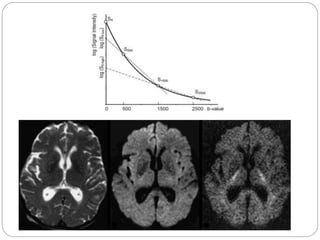
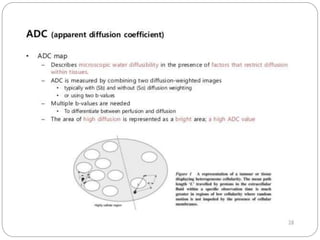
![ADC: Apparent Diffusion Coefficient
ADC is measure of diffusion
Calculated mathematically from b-value=0 and
higher b-value images
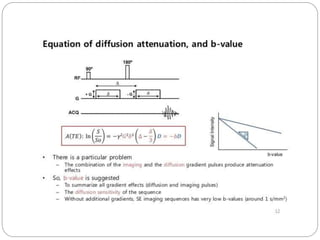
Signal attenuation of a tissue with increasing
value plotted on graph with relative signal
intensity on y-axis and b-value of x-axis
Resultant slope of line is ADC
Done on pixel by pixel basis by computer
To user it is available as ADC map
ADC is independent of ‘B’
Reduced ADC is ‘restricted diffusion’ [bright area]
on DWI
While on same area will be dark on ADC map
ADC value from map for AOI measured in](https://image.slidesharecdn.com/2-170801061033/85/Magnetic-Resonance-Diffusion-15-320.jpg)
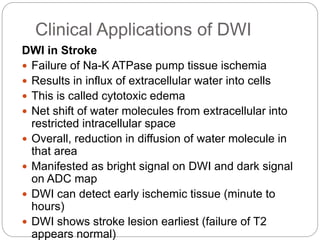
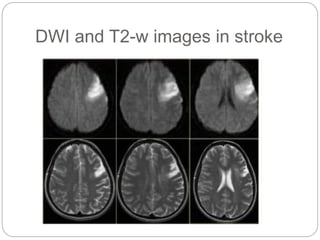
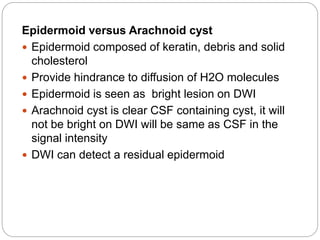
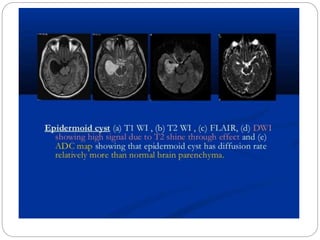


This document provides an overview of diffusion weighted imaging (DWI) and its clinical applications. It defines diffusion and how DWI is acquired using Stejskal-Tanner pulsed gradient spin echo sequences. Key terms like b-value and apparent diffusion coefficient are explained. Clinical uses of DWI include detecting acute strokes and differentiating lesions. Body DWI using DWIBS is also discussed. Diffusion tensor imaging is introduced as a technique for visualizing white matter tract orientation using tractography maps.


