MAGNETIC RESONANCE
SPECTROSCOPY
(MRS)
DR .Anurag Kumar Singh
 Introduction
 Physics
 Interpretation
 Indications
 Cases
 Summary
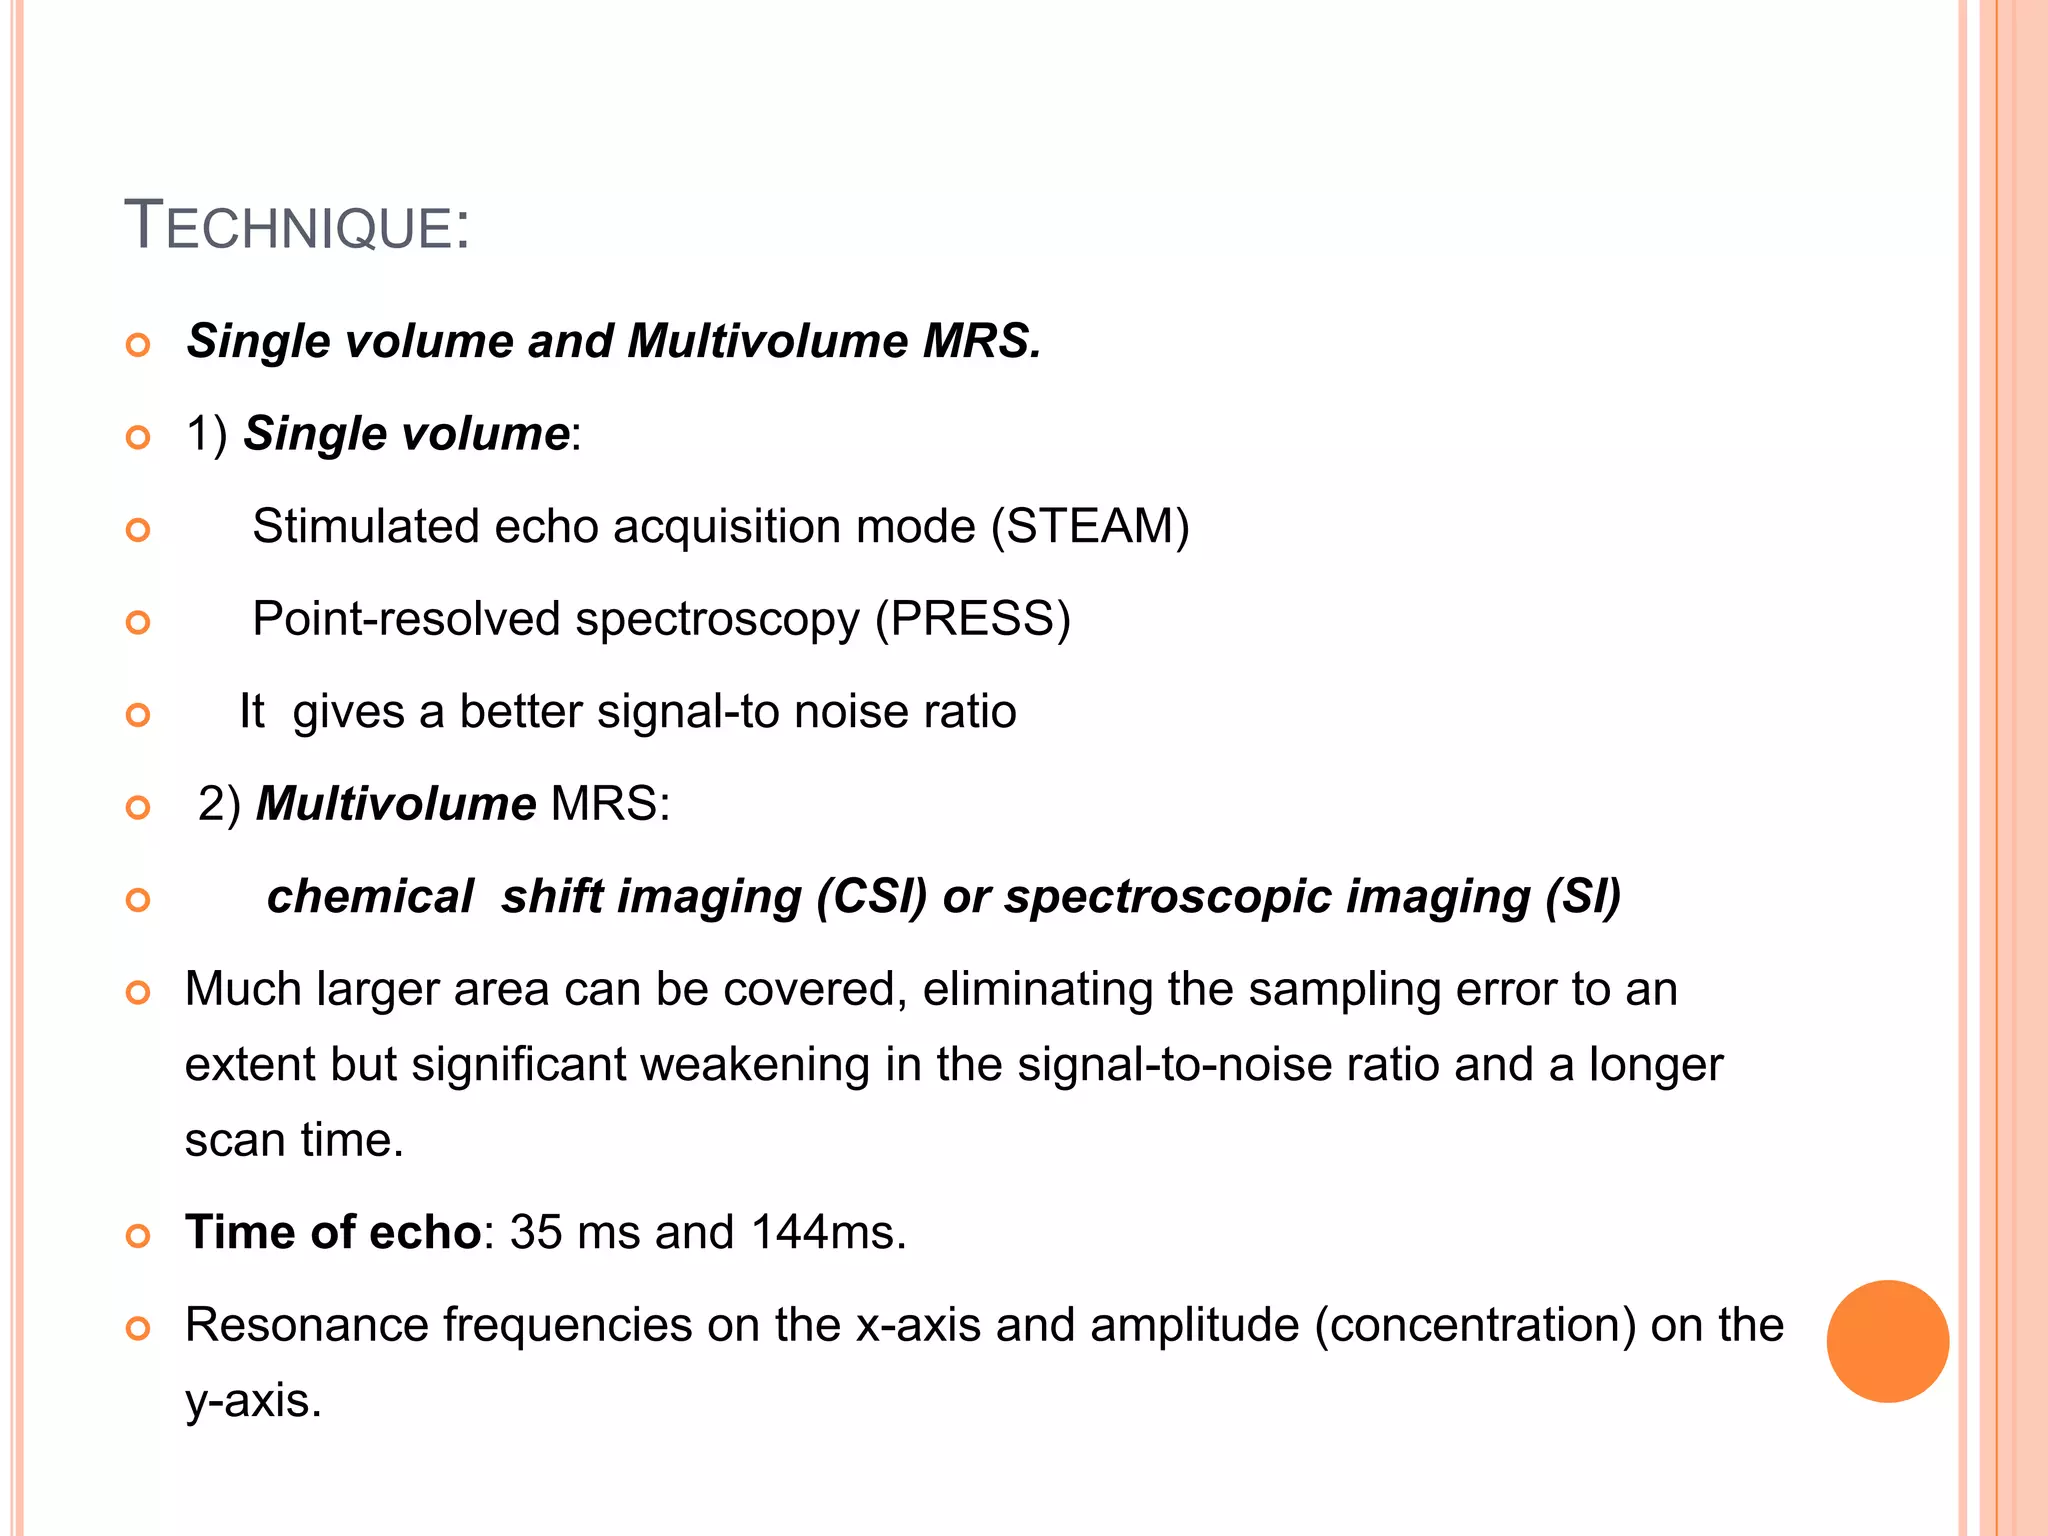
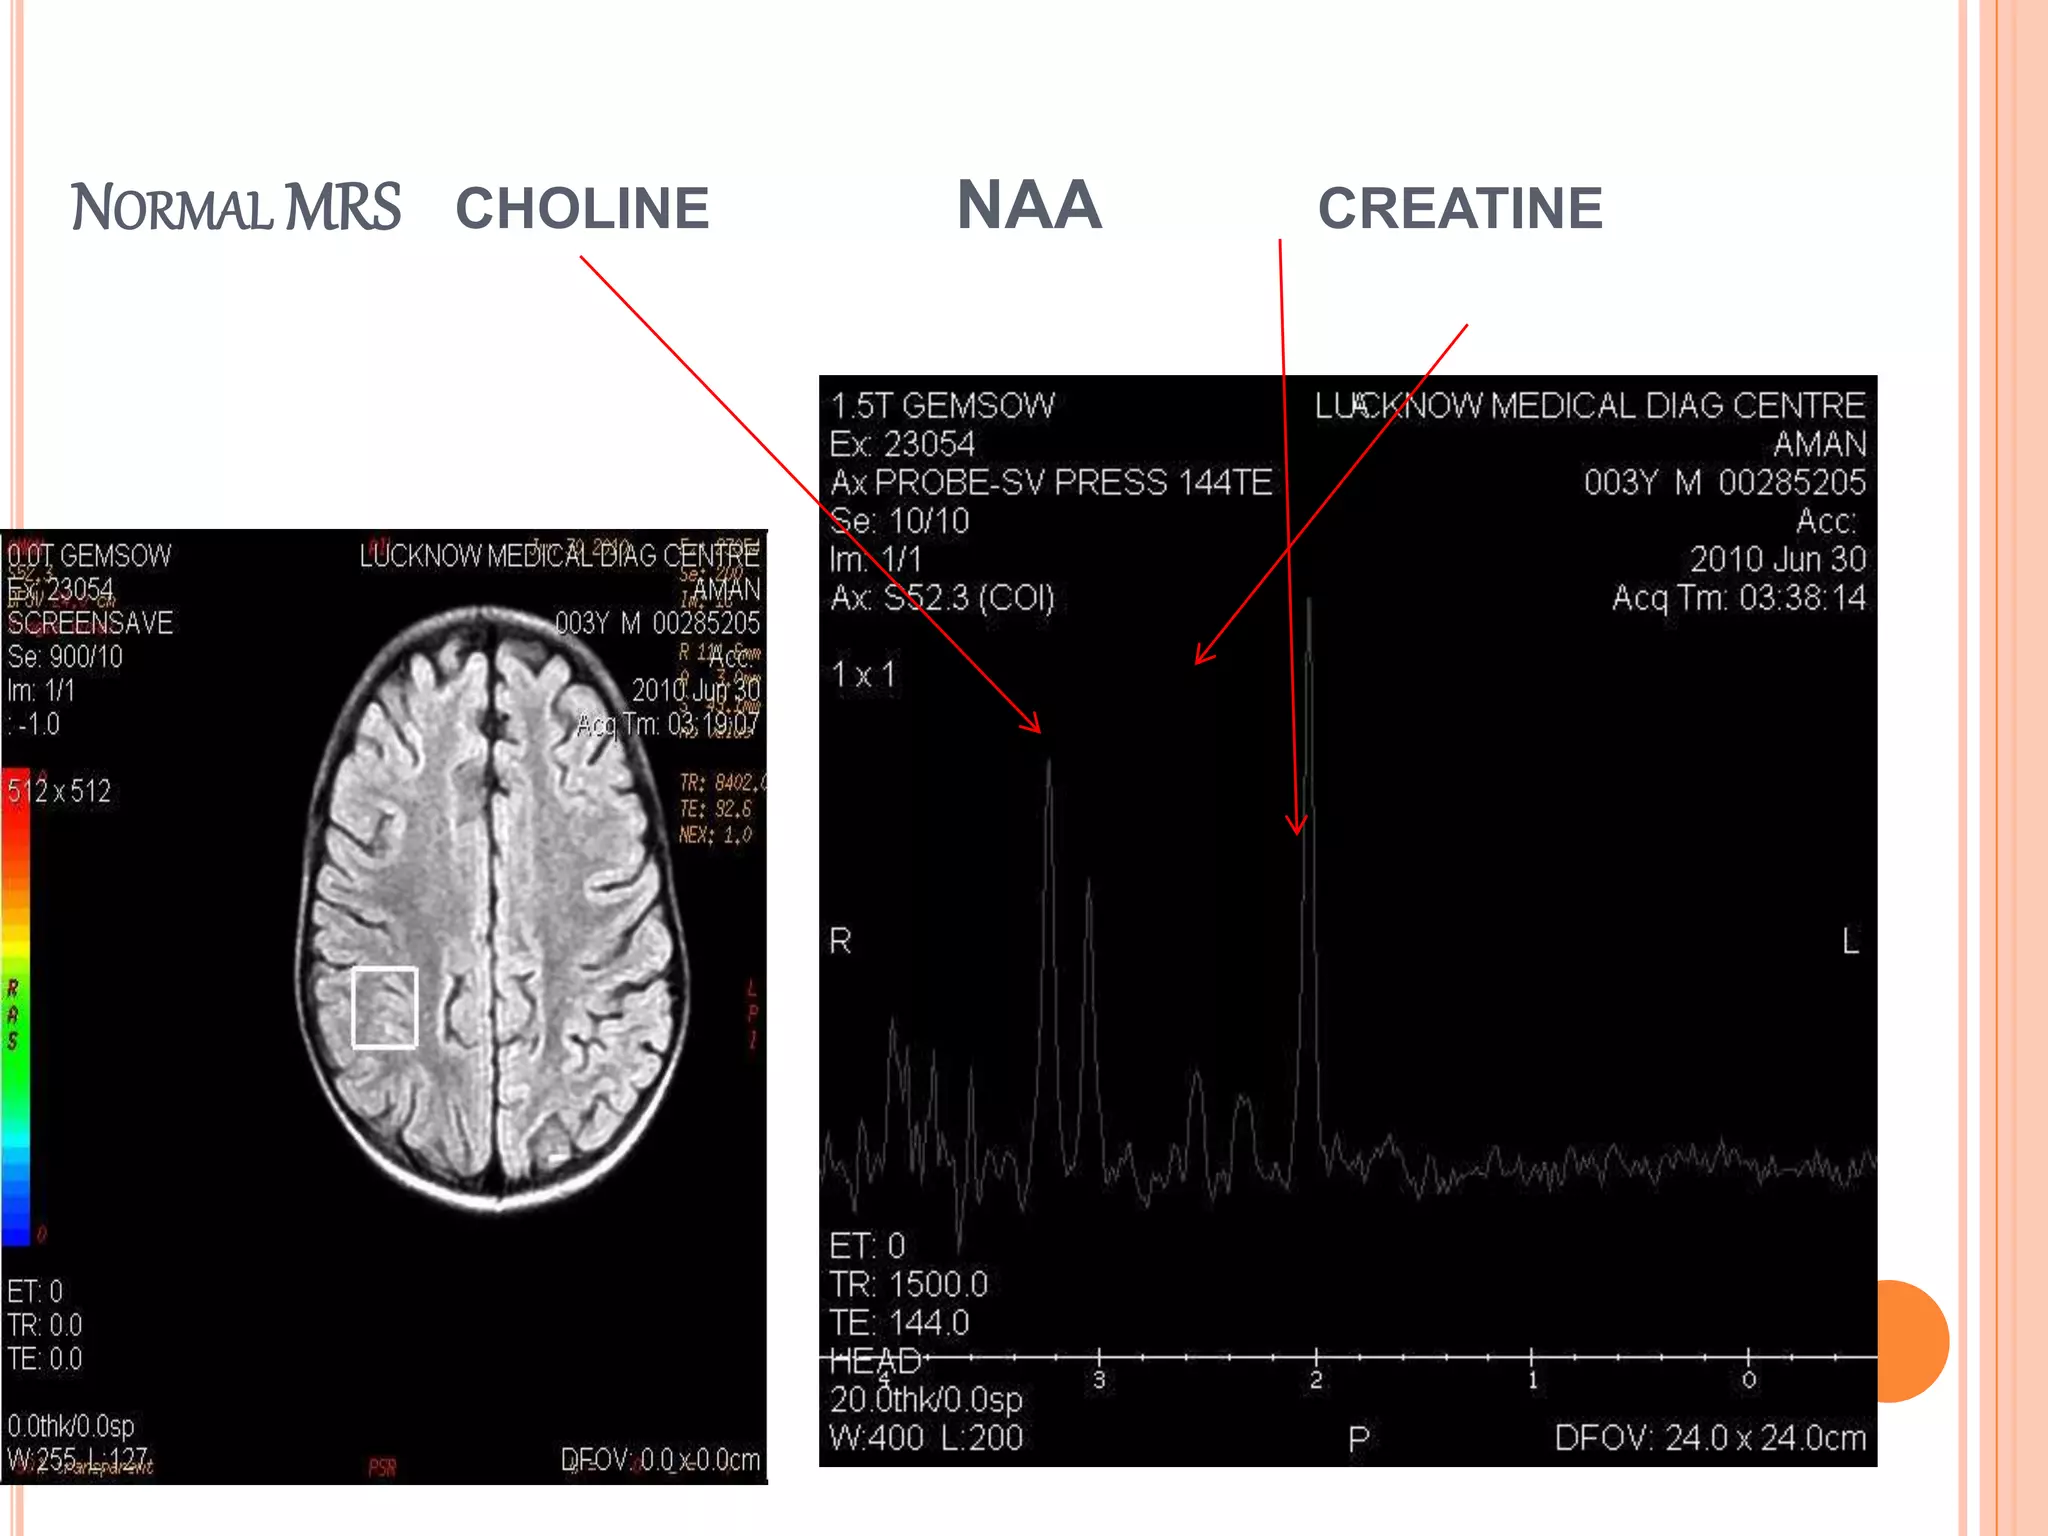
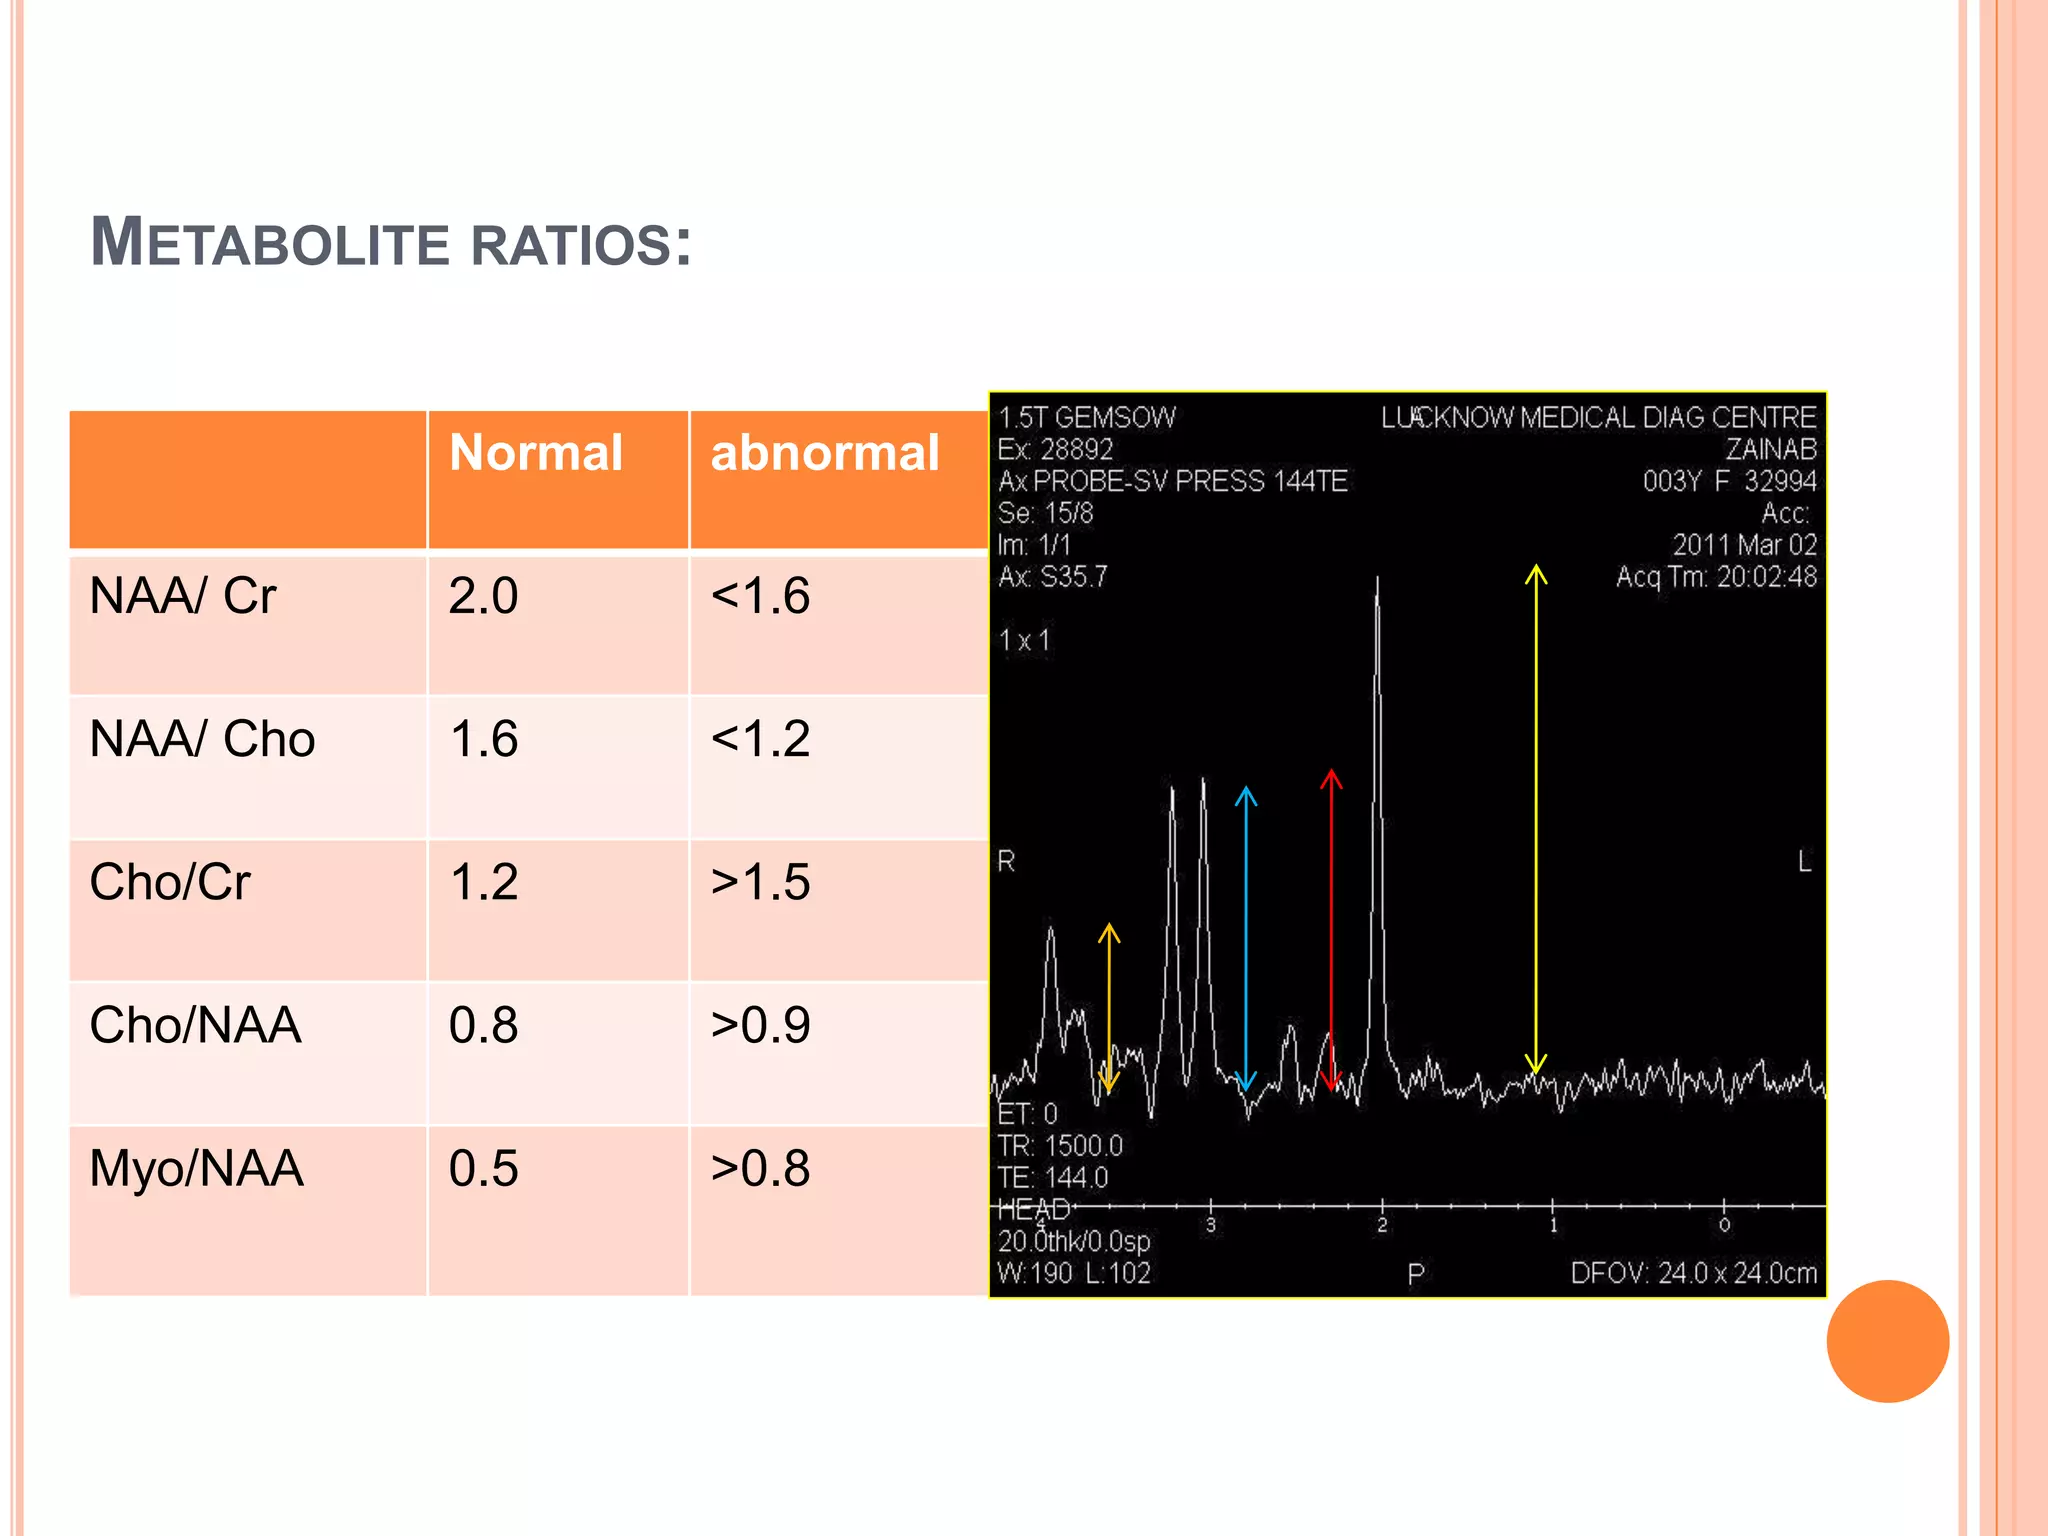
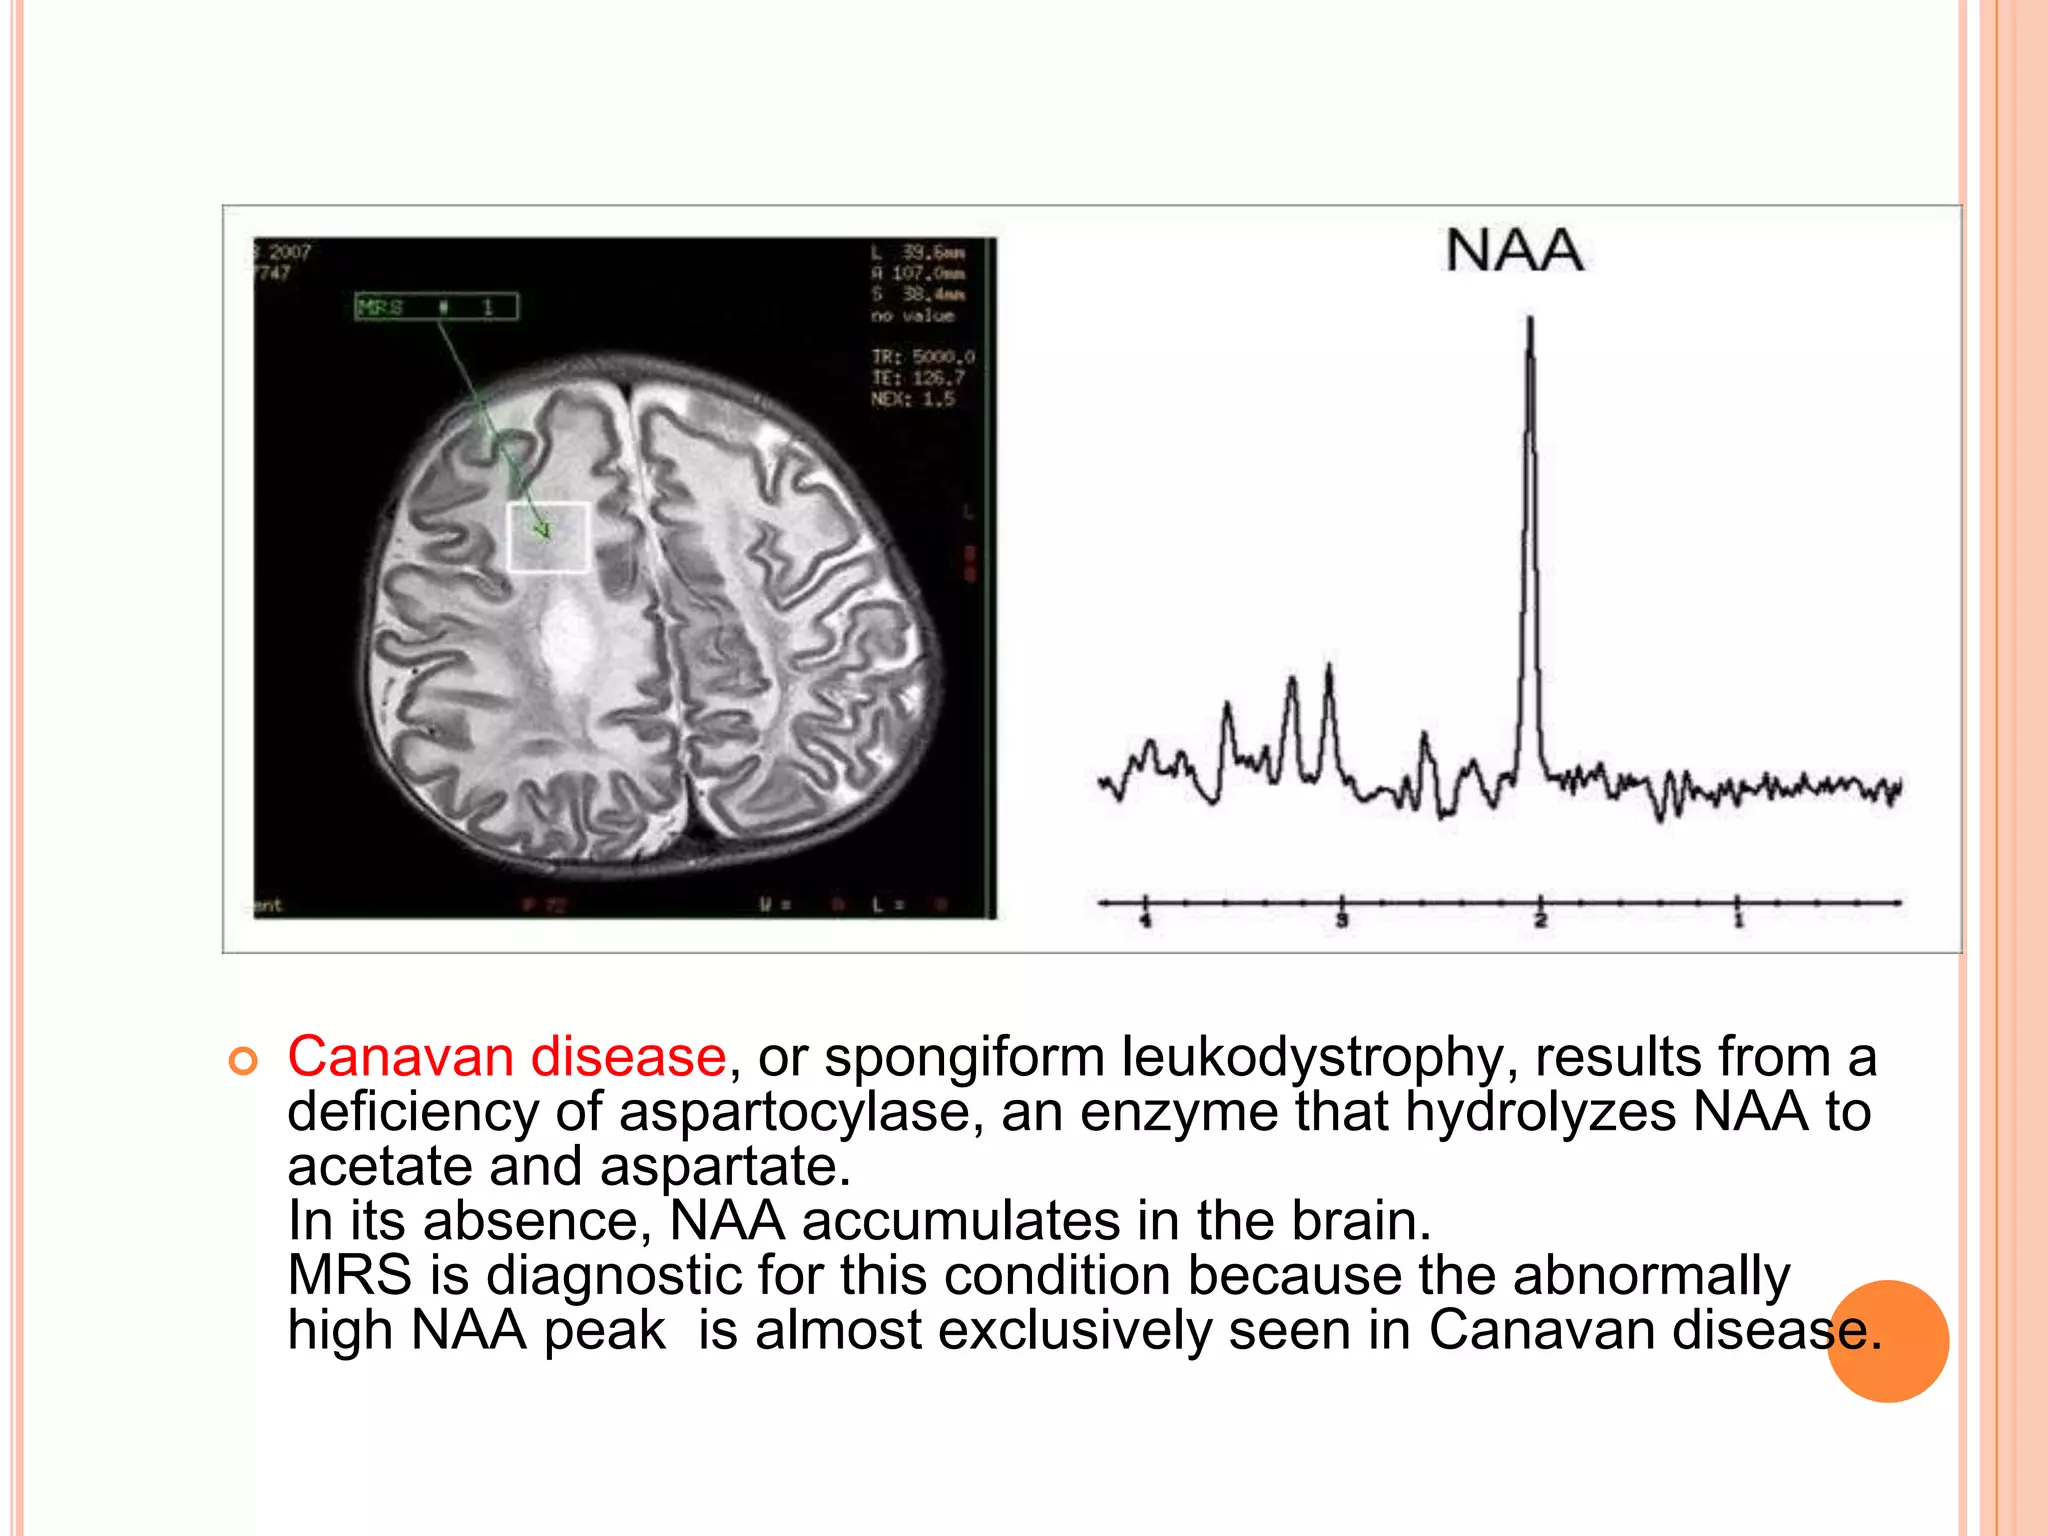
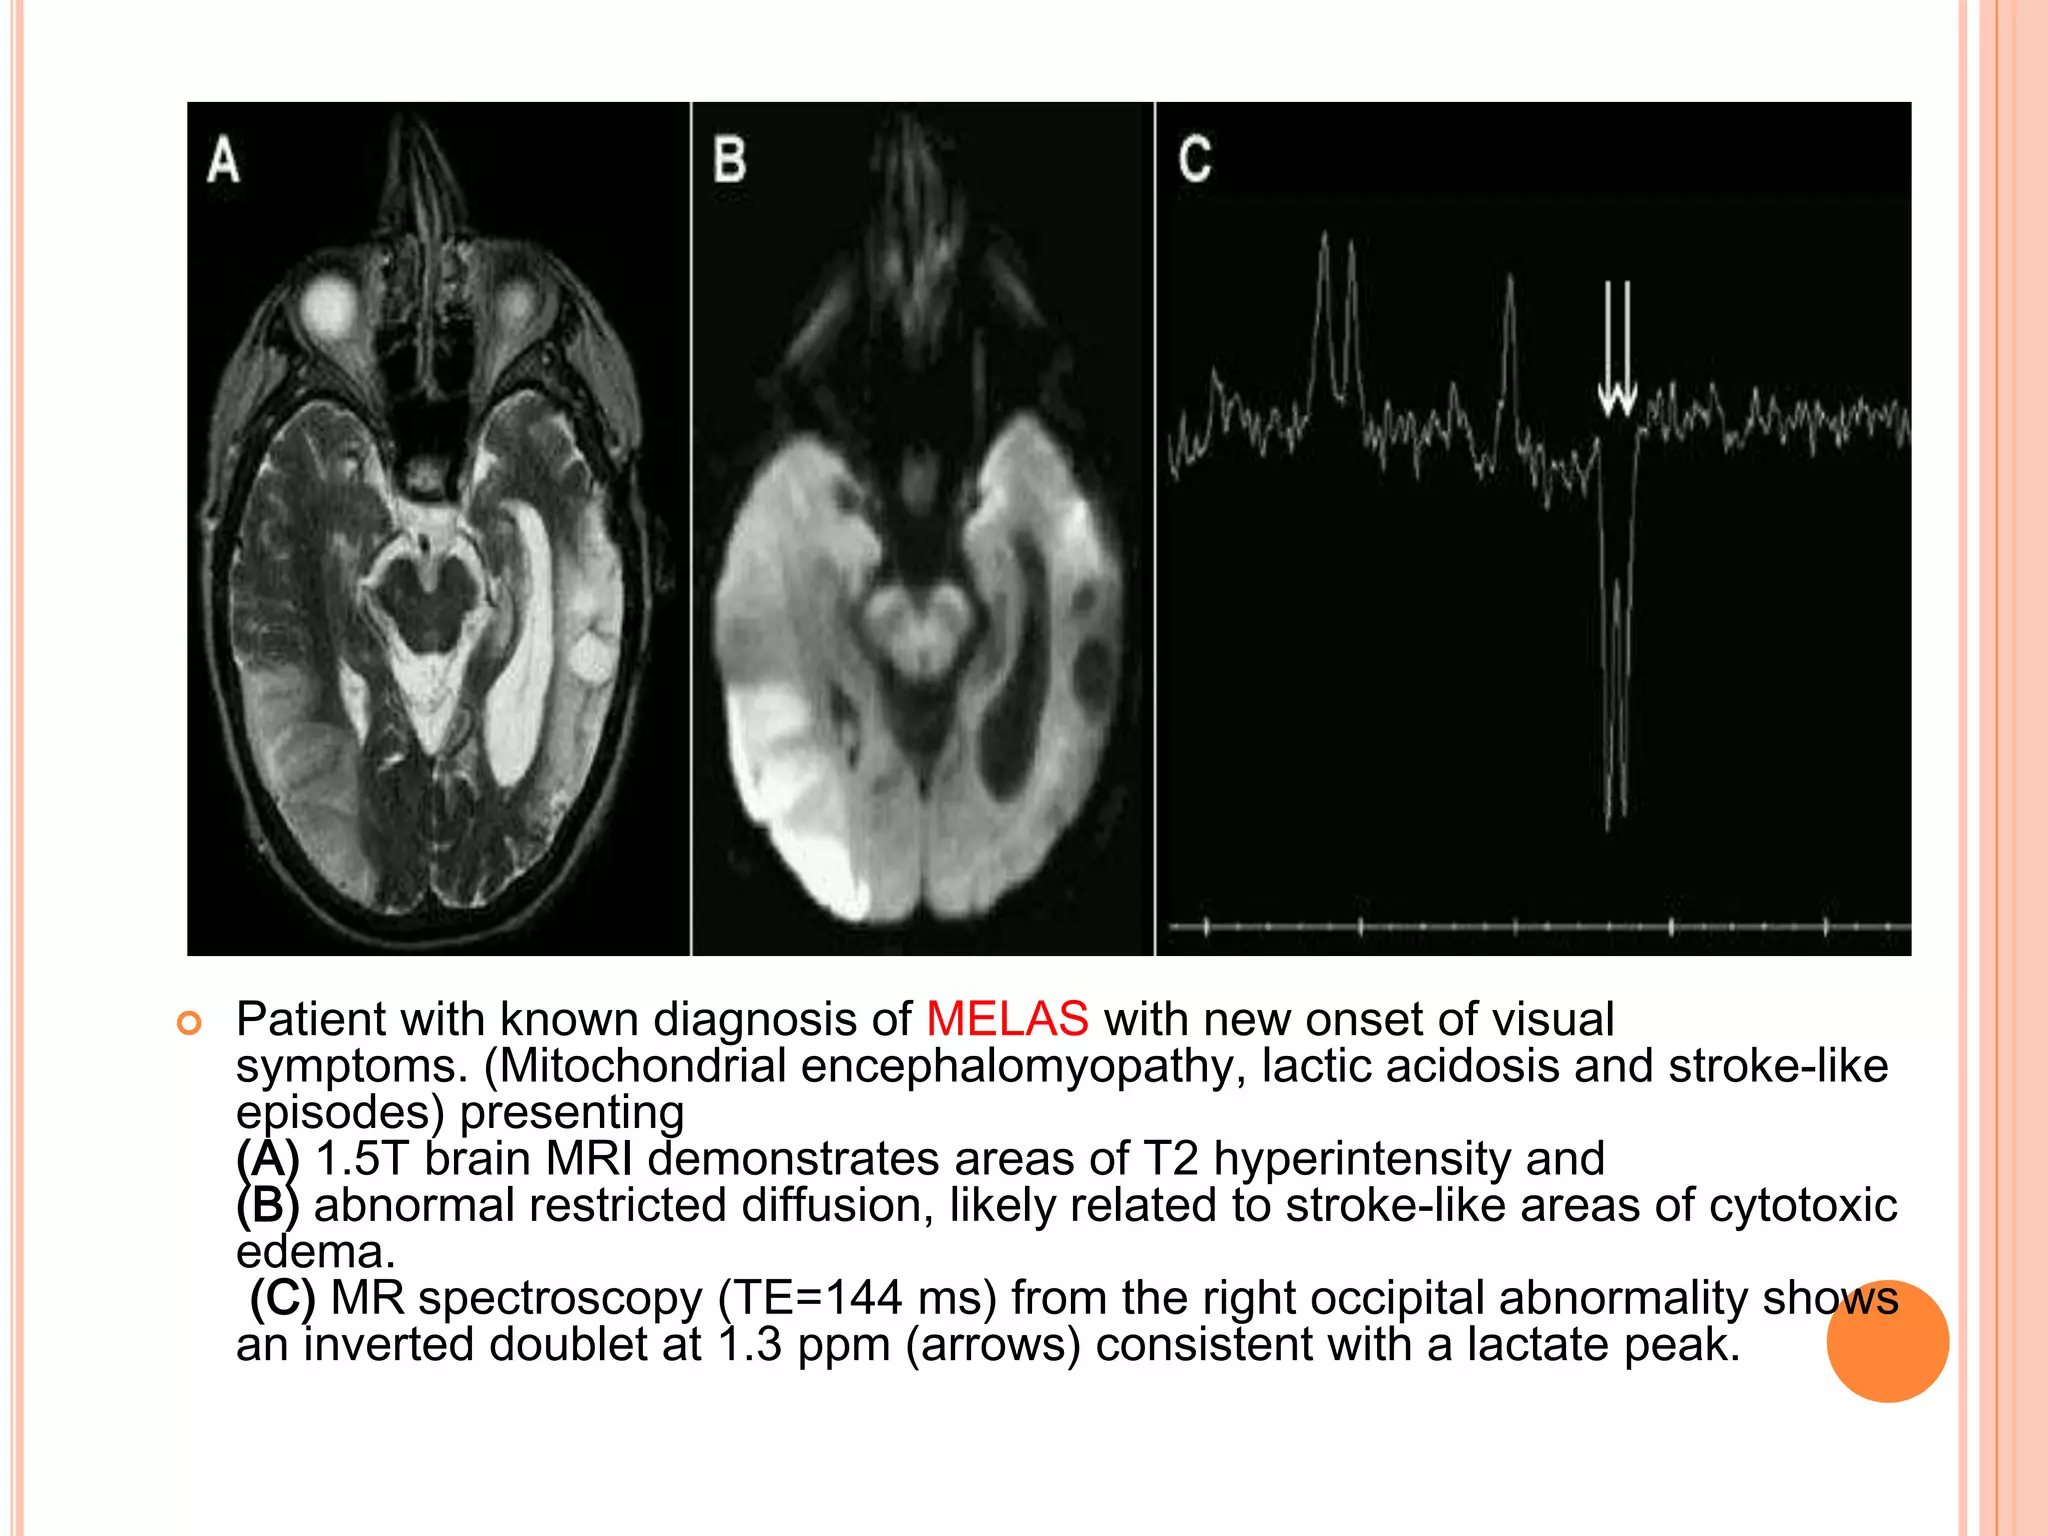
 Magnetic resonance spectroscopy (MRS) is a means of
noninvasive physiologic imaging of the brain that measures
relative levels of various tissue metabolites
 Purcell and Bloch (1952) first detected NMR signals from
magnetic dipoles of nuclei when placed in an external
magnetic field.
 Initial in vivo brain spectroscopy studies were done in the
early 1980s.
 Today MRS-in particular, IH MRS-has become a valuable
physiologic imaging tool with wide clinical applicability.
PRINCIPLES:
 The radiation produced by any substance is dependent on its atomic
composition.
 Spectroscopy is the determination of this chemical composition of a
substance by observing the spectrum of electromagnetic energy
emerging from or through it.
 NMR is based on the principle that some nuclei have associated
magnetic spin properties that allow them to behave like small magnet.
 In the presence of an externally applied magnetic field, the magnetic
nuclei interact with that field and distribute themselves to different energy
levels.
 These energy states correspond to the proton nuclear spins, either
aligned in the direction of (low-energy spin state) or against the applied
magnetic field (high-energy spin state).
 If energy is applied to the system in the form of a radiofrequency
(RF) pulse that exactly matches the energy between both states. a
condition of resonance occurs.
 Chemical elements having different atomic numbers such as
hydrogen ('H) and phosphorus (31P) resonate at different Larmor
RFs.
MRS TECHNIQUES
STEAM (Stimulated Echo
Acquisition Mode)
PRESS (Point Resolved
Spectroscopy)
Short TE can be used to
detect glutamate,
glutamine, myoinositol
Not possible
Chemical shift selective
pulse used to suppress
water signal can be given
throughout volume
localisation phase
Can be given only at
preparation phase
Factor of 2 loss in signal
intensity
Factor of 2 gain in signal
intensity
Susceptible to motion Not affected by motion
Single Volume MRS
Multivolume MRS- multiple adjacent volume over a large region of interest
can be assessed in a single measurement. Acquisition time is 6-12 min.
TECHNIQUE:
 Single volume and Multivolume MRS.
 1) Single volume:
 Stimulated echo acquisition mode (STEAM)
 Point-resolved spectroscopy (PRESS)
 It gives a better signal-to noise ratio
 2) Multivolume MRS:
 chemical shift imaging (CSI) or spectroscopic imaging (SI)
 Much larger area can be covered, eliminating the sampling error to an
extent but significant weakening in the signal-to-noise ratio and a longer
scan time.
 Time of echo: 35 ms and 144ms.
 Resonance frequencies on the x-axis and amplitude (concentration) on the
y-axis.
NORMAL MRS CHOLINE NAA CREATINE
 MRS of white matter in a normal brain. (A) Long TE spectra have
less baseline distortion and are easy to process and analyze but
show fewer metabolites than short TE spectra. Also, the lactate
peaks are inverted, which makes them easier to differentiate them
from lipids.
(B) Short TE demonstrates peaks attributable to more metabolites,
including lipids, glutamine and glutamate, and myo-inositol
MULTI VOXEL MRS
OBSERVABLE METABOLITES
Metabolite Location
ppm
Normal function Increased
Lipids 0.9 & 1.3 Cell membrane
component
Hypoxia, trauma, high grade
neoplasia.
Lactate 1.3
TE=272
(upright)
TE=136
(inverted)
Denotes anaerobic
glycolysis
Hypoxia, stroke, necrosis,
mitochondrial diseases,
neoplasia, seizure
Alanine 1.5 Amino acid Meningioma
Acetate 1.9 Anabolic precursor Abscess ,
Neoplasia,
PRINCIPLE METABOLITES
Metabolite Location
ppm
Normal
function
Increased Decreased
NAA 2 Nonspecific
neuronal
marker
(Reference for
chemical shift)
Canavan’s
disease
Neuronal loss,
stroke, dementia,
AD, hypoxia,
neoplasia,
abscess
Glutamate ,
glutamine,
GABA
2.1- 2.4
Neurotransmitt
er
Hypoxia, HE Hyponatremia
Succinate 2.4 Part of TCA
cycle
Brain abscess
Creatine 3.03 Cell energy
marker
(Reference for
metabolite
ratio)
Trauma,
hyperosmolar
state
Stroke, hypoxia,
neoplasia
Metabolite Location
ppm
Normal
function
Increased Decreased
Choline 3.2 Marker of cell
memb turnover
Neoplasia,
demyelination
(MS)
Hypomyelinatio
n
Myoinositol 3.5 & 4 Astrocyte
marker
AD
Demyelinating
diseases
METABOLITE RATIOS:
Normal abnormal
NAA/ Cr 2.0 <1.6
NAA/ Cho 1.6 <1.2
Cho/Cr 1.2 >1.5
Cho/NAA 0.8 >0.9
Myo/NAA 0.5 >0.8
MRS
Dec NAA/Cr
Inc acetate,
succinate,
amino acid,
lactate
Neuodegener
ative
Alzheimer
Dec
NAA/Cr
Dec NAA/
Cho
Inc
Myo/NAA
Slightly inc Cho/ Cr
Cho/NAA
Normal Myo/NAA
± lipid/lactate
Inc Cho/Cr
Myo/NAA
Cho/NAA
Dec NAA/Cr
± lipid/lactate
Malignancy
Demyelinating
disease Pyogenic
abscess
CLINICAL APPLICATIONS OF MRS:
 Class A MRS Applications: Useful in Individual Patients
1) MRS of brain masses:
 Distinguish neoplastic from non neoplastic masses
 Primary from metastatic masses.
 Tumor recurrence vs radiation necrosis
 Prognostication of the disease
 Mark region for stereotactic biopsy.
 Monitoring response to treatment.
 Research tool
2) MRS of Inborn Errors of Metabolism
Include the leukodystrophies, mitochondrial disorders, and enzyme defects that
cause an absence or accumulation of metabolites
CLASS B MRS APPLICATIONS: OCCASIONALLY USEFUL IN INDIVIDUAL PATIENTS
1) Ischemia, Hypoxia, and Related Brain Injuries
 Ischemic stroke
 Hypoxic ischemic encephalopathy.
2)Epilepsy
Class C Applications: Useful Primarily in Groups of Patients (Research)
 HIV disease and the brain
 Neurodegenerative disorders
 Amyotrophic lateral sclerosis
 Multiple sclerosis
 Hepatic encephalopathy
 Psychiatric disorders
A 50 yr M with fever, headache and Lt hemiparesis
B, Axial T2-weighted image showing ring
lesion with surrounding hyperintensity and
mass effect.
C, Axial contrast-enhanced T1W image
shows a ring-shaped cystic lesion and
surrounding edema.
D, DWI shows marked hyperintensity in
the cavity and slight iso- to hypointensity
surrounding the edema.
E, ADC map reveals hypointensity in the
cavity, representing restricted diffusion,
and hyperintense areas surrounding the
edema.
DDx- ?abscess, ?tumor
F ,G. MRS from the abscess cavity show
peaks of acetate (Ac), alanine (Ala),
lactate (Lac), and amino acids (AA). At a
TE of 135 (G), the phase reversal
resonances are well depicted at 1.5, 1.3,
and 0.9 ppm, which confirms the
assignment to alanine, lactate, and amino
acids, respectively.
Dx- Pyogenic abscess
A 67 YR M WITH POSTERIOR FOSSA SOL
B. Axial T2WI showing hyperintense mass
lesion in Rt cerebellum. Box in the center of
the lesion represents the 1H-MRS volume of
interest.
C, Axial contrast-enhanced T1W image shows
a ring-enhanced lesion in the right cerebellum.
D, DWI shows markedly low signal intensity in
the necrotic part of the tumor.
E, ADC map reveals high signal intensity in the
necrotic part of the tumor that is similar to that
of CSF, reflecting marked diffusion.
DDX- ?tumor
F ,G. MRS from the necrotic center of the
tumor show a lactate (Lac) peak at 1.3 ppm
that is inverted at a TE of 135. No amino acid
or lipid peaks seen
Dx- tumor
Biopsy revealed metastasis from primary lung
adenocarcinoma
 Serial magnetic resonance spectroscopic data from a 25-year-old lady
who was under 6-monthly imaging follow-up for a low-grade glioma. A.
Voxel (open square) is situated in the bulk of the tumour, which is
appreciated as an ill-defined area of T2-weighted hyperintensity within
the cingulate gyrus of the right frontal lobe. B. Initial spectra at
presentation demonstrates abnormal Cho/NAA area ratio of 1.4. Note
the absence of lactate at 1.33ppm. C. Spectroscopy 6-months later
demonstrates deterioration in the Cho/NAA area ratio (now 2.21) and
the new presence of an inverted lactate peak
A 48 Y F WITH HEADACHE AND LEFT HEMIPARESIS
A, Coronal contrast-enhanced T1-weighted
MR image shows a large right temporal
mass with rich contrast uptake with
extensive midline shift.
B, Spectrum of the lesion shows increased
Cho/Cr ratio and an absence of NAA.
There is an alanine (Ala) doublet at 1.45
ppm and lipid (lip) signals at 0.8 to 1.2 ppm
Dx- Meningioma
A 27 Y M WITH MULTIPLE NODULAR LESIONS IN BRAIN
A.T1WE at midbrain level shows
nothing remarkable
B. Contrast enhanced T1 W image
revealed multiple small nodular
areas of enhancement
predominantly located at gray
white junction.
DDx- ?Multiple tuberculoma,
?Multiple NCC
C. MR spectroscopy (A; TE = 35ms).
peaks A and B at 0.9 and 1.33
ppm, respectively, represent
typical long-chain lipids
(lipid/lactate). NAA and Cr are
barely detectable. A small Cho
peak, C, is seen to resonate at
3.2 ppm. (B; TE = 144ms) Long
TE MRS depicts persistence of
predominant lipid peak at 1.33
ppm.
Dx- Multiple tuberculoma
A 14 Y M WITH REFRACTORY CPS PLANNED FOR SURGERY
•Conventional MRI
revealed no apparent
abnormality.
•MRS of Left anterior
hippocampus showed
smaller NAA peak (33%
less) compared to Right
indicating a left temporal
seizure focus
LeftRight
 MRS in hippocampal sclerosis
Short TE (35msec) spectra at 3T obtained in the left and right hippocampal
formation from a patient with right HS using single-voxel technique.
The decreased NAA signal and the increased mI at the affected region (A) are
shown when compared with the contralateral normal hippocampal formation
FUC OF A 48YR F WITH PROVEN GLIOBLASTOMA MULTIFORME
TREATED WITH SURGERY, EXTERNAL BEAM RADIATION AND
INTERSTITIAL BRACHYTHERAPY.
A, Axial T1-weighted MR image
reveals enhancement of a right
frontal lobe/insular lesion that has
both solid and cavitary components.
The spectroscopy voxel includes
the medial margin of enhancement.
DDx- ?Recurrent tumor,
?Radiation necrosis
B, MR spectrum shows a prominent
lipid/lactate peak with minimal
residual Cho and Cr; NAA is
absent.
Dx -radiation necrosis
Diagnosis was confirmed at
resection. This patient had
subsequent follow-up spectroscopy
studies at 1, 3, and 4 months that
were unchanged (not shown).
Lip
Lac
NAACho Cr
76 YRS MALE PRESENTED WITH RECENT MEMORY LOSS
•T1W image shows reduction in
the volume of the hippocampus.
•Proton MRS in hippocampal
region shows
MI peak, decreased NAA and
elevated MI/Cr ratio
•Dx - Alzheimer’s Disease
 Canavan disease, or spongiform leukodystrophy, results from a
deficiency of aspartocylase, an enzyme that hydrolyzes NAA to
acetate and aspartate.
In its absence, NAA accumulates in the brain.
MRS is diagnostic for this condition because the abnormally
high NAA peak is almost exclusively seen in Canavan disease.
 Patient with known diagnosis of MELAS with new onset of visual
symptoms. (Mitochondrial encephalomyopathy, lactic acidosis and stroke-like
episodes) presenting
(A) 1.5T brain MRI demonstrates areas of T2 hyperintensity and
(B) abnormal restricted diffusion, likely related to stroke-like areas of cytotoxic
edema.
(C) MR spectroscopy (TE=144 ms) from the right occipital abnormality shows
an inverted doublet at 1.3 ppm (arrows) consistent with a lactate peak.
MRS IN OTHER CONDITIONS
 Ischemic stroke- appearance of lactate peak
within minutes of ischemia. In chronic phase NAA
is suppressed
 AIDS dementia- increased MI and Gln detected.
MRS may help in detection of subclinical disease,
opportunistic infections and monitoring ART
 Multiple sclerosis- Increased Cho due to active
demylination. Lipid and Lac may also rise.
Presence of MI suggests severe demylination
FUNCTIONAL MRS
 It is a promising new technique still in
research phase
 Fast spectroscopic imaging technique is
used to detect transient rise in metabolites
during language or visual tasks
 Increase in Lac and Cr have been noted in
left temporal lobe during language task
 May complement fMRI and PET
7 MONTH INFANT WITH DELAYED MILESTONES & SPASTICITY
 T 1W– diffuse hypointensity
of supratentorial white
matter.
 T2W -diffuse hyperintensity
of supratentorial white
matter
 MRS show markedly
raised NAA peak as
compared to control
subject.
 Dx – Canavan’s disease.
5 YRS CHILD WITH SEIZURES & 2 STROKE LIKE EPISODES
 A – T 2 W- hyperintense left
occipital region.
 B- MRS obtained from rt & lt
occipital cortices.
-inverted doublet lactate peak
from rt occipital cortex at 1.3
ppm
-reduced all peaks from old lt
lesion.
 Dx – MELAS
ALZHEIMER’S DISEASE
•T1W image shows reduction in the volume
of the hippocampus of the patient with AD
•Proton MRS in hippocampal region shows
MI peak,decreased NAA and elevated MI/Cr ratio
PATIENT WITH REFRACTORY CPS PLANNED FOR SURGERY
•Conventional MRI revealed
no apparent abnormality.
•MRS of Left anterior
hippocampus showed
smaller NAA peak (33% less)
compared to Right indicating
a left temporal seizure focus
LeftRight
LOCALISED 1H-MR SPECTROSCOPY FOR METABOLIC CHARACTERISATION
OF DIFFUSE AND FOCAL BRAIN LESIONS IN PATIENTS INFECTED WITH HIV
I L SIMONEA ET AL
 A significant decrease in NAA/Cr and NAA/Cho ratios were found in all HIV diagnostic
groups in comparison with neurological controls (p<0.003),
 The NAA/Cr ratio was significantly lower in PML and lymphomas than in HIV
encephalopathies (p<0.02) and toxoplasmosis (p<0.05).
 HIV encephalopathies, lymphomas, and toxoplasmosis showed a significant increase
in the Cho/Cr ratio in comparison with neurological controls (p<0.03)
 The presence of a lipid signal was more frequent in lymphomas (71%) than in
other HIV groups
CONCLUSION 1H-MRS shows a high sensitivity in detecting brain involvement in HIV
related diseases, but a poor specificity in differential diagnosis of HIV brain lesions.
OTHER CONDITIONS:
 Hepatic encephalopathy: increased glutamate,
decreased myoinositol
 Phenylketonuria: increased Phenylalanine peak at
7.3ppm
 Parkinson’s disease
 Motor neuron disease
 Psychiatric disease
 Proton magnetic resonance spectroscopy of the brain is useful whenever biochemical
or metabolic assessment may be necessary, such as in differential diagnosis of focal
brain lesions (neoplastic and non-neoplastic diseases)
 Diagnosis , grading of tumors and response to treatment
 NAA marker of neuronal viability
 Tumors – increased Cho/Cr, Cho/NAA, lipid lactate, decreased NAA/Cr
 Abscess: increased Cho/Cr, lactate, acetate, succinate peaks
 Demyelinating disease: slightly increased Cho/Cr, Cho/NAA, lipid , decreased NAA/Cr
 It is non invasive, radiation free, time saving, cost effective, very sensitive and specific
 The MR spectra do not come labeled with
diagnoses. They require interpretation and should
always be correlated with the MR images before
making a final diagnosis
 Proton magnetic resonance spectroscopy of the brain is useful
whenever biochemical or metabolic assessment may be necessary,
such as in differential diagnosis of focal brain lesions (neoplastic and
non-neoplastic diseases);
 brain lesions in patients with acquired immunodeficiency syndrome;
 Diagnosis of dementiaand other degenerative diseases;
 follow-up radiation therapy for patients with brain neoplasms;
 demyelinating diseases such as multiple sclerosis and
leukodystrophy;
 diagnosis and prognosis of brain ischemic and traumatic lesions
 assessment of epilepsy;
 biochemical alterations in hepatic encephalopathies;
 and neuropediatric affections such as brain tumors,
 inborn errors of metabolism and hypoxic encephalopathy.
 There are two methods of proton magnetic resonance spectroscopy:
single voxel and
 multivoxel, with or without spectroscopic imaging.
 Single voxel proton magnetic resonance spectroscopy provides a
rapid biochemical
 profile of a localized volume within a region of interest that may be
determined, especially in brain studies.
 Spectroscopic imaging provides biochemical information about
multiple, small and contiguous volumes focalized on a particular
region of interest that may allow the mapping of metabolic tissue
distribution. By using this method, the data obtained may be
manipulated by computer and superimposed on the image of an
abnormality, thereby illustrating the distribution of such metabolites
within that area.
 Short echo times are indicated for the study of
metabolic and diffuse diseases. By using long echo
times (more than 135 milliseconds), smaller
numbers of metabolites are detected, but with
better definition of peaks, thereby facilitating
graphic analysis. Long echo times are more used in
focal brain lesions.
 Quantitation of taurine (Tau) concentrations with
proton magnetic resonance spectroscopy improves
the differentiation of primitive neuroectodermal
tumors (PNET) from other common brain tumors in
pediatric patients as taurine concentration was
significantly elevated in PNETs compared to other
tumors
 Interpretation of the spectroscopic curve
 The spectrum represents radiofrequency signals
emitted from the proton nuclei of the different
metabolites into the region of interest. Specific
metabolites always appear at the same
frequencies, expressed as parts per million, and are
represented on the horizontal axis of the graph. The
vertical axis shows the heights of the metabolite
peaks, represented on an arbitrary intensity scale
EFFECT OF TE ON THE PEAKS
__________
TE 35ms
___________
___________
TE 144ms
__________
 Normal spectral data obtained at intermediate echo-time by single-
voxel 1H magnetic resonance spectroscopy of the cerebellar vermis
using a point-resolved spectroscopic sequence . X-axis, labelled in
parts per million (ppm). The amplitude of the resonances is measured
on the Y-axis using an arbitrary scale. The most prominent peak is N-
acetyl aspartate at 2.02ppm. Following from right to left: creatine (Cr)
at 3.02 (and 3.9) and choline (Cho) at 3.2
CASE 9- CANAVAN’S DISEASE
 Serial magnetic resonance imaging and spin-echo spectra recorded at
an echo time of 135 ms from an acute multiple sclerosis plaque. T2-
FLAIR images show an initial progressive lesion size increase followed
by a decrease over 1 year of follow up. 1H-MRS during the acute stage
shows the presence of Lac, a slight decrease in NAA, and an increase in
Cho. The longitudinal study demonstrates Lac disappearance at 3
months, persistent low levels of NAA, a progressive Cho increase during
the first weeks followed by partial recovery, and relatively stable Cr at all
time points.
THANK
YOU

Magnetic resonance spectroscopy

  • 1.
  • 2.
     Introduction  Physics Interpretation  Indications  Cases  Summary
  • 3.
     Magnetic resonancespectroscopy (MRS) is a means of noninvasive physiologic imaging of the brain that measures relative levels of various tissue metabolites  Purcell and Bloch (1952) first detected NMR signals from magnetic dipoles of nuclei when placed in an external magnetic field.  Initial in vivo brain spectroscopy studies were done in the early 1980s.  Today MRS-in particular, IH MRS-has become a valuable physiologic imaging tool with wide clinical applicability.
  • 4.
    PRINCIPLES:  The radiationproduced by any substance is dependent on its atomic composition.  Spectroscopy is the determination of this chemical composition of a substance by observing the spectrum of electromagnetic energy emerging from or through it.  NMR is based on the principle that some nuclei have associated magnetic spin properties that allow them to behave like small magnet.  In the presence of an externally applied magnetic field, the magnetic nuclei interact with that field and distribute themselves to different energy levels.  These energy states correspond to the proton nuclear spins, either aligned in the direction of (low-energy spin state) or against the applied magnetic field (high-energy spin state).
  • 5.
     If energyis applied to the system in the form of a radiofrequency (RF) pulse that exactly matches the energy between both states. a condition of resonance occurs.  Chemical elements having different atomic numbers such as hydrogen ('H) and phosphorus (31P) resonate at different Larmor RFs.
  • 6.
    MRS TECHNIQUES STEAM (StimulatedEcho Acquisition Mode) PRESS (Point Resolved Spectroscopy) Short TE can be used to detect glutamate, glutamine, myoinositol Not possible Chemical shift selective pulse used to suppress water signal can be given throughout volume localisation phase Can be given only at preparation phase Factor of 2 loss in signal intensity Factor of 2 gain in signal intensity Susceptible to motion Not affected by motion Single Volume MRS Multivolume MRS- multiple adjacent volume over a large region of interest can be assessed in a single measurement. Acquisition time is 6-12 min.
  • 7.
    TECHNIQUE:  Single volumeand Multivolume MRS.  1) Single volume:  Stimulated echo acquisition mode (STEAM)  Point-resolved spectroscopy (PRESS)  It gives a better signal-to noise ratio  2) Multivolume MRS:  chemical shift imaging (CSI) or spectroscopic imaging (SI)  Much larger area can be covered, eliminating the sampling error to an extent but significant weakening in the signal-to-noise ratio and a longer scan time.  Time of echo: 35 ms and 144ms.  Resonance frequencies on the x-axis and amplitude (concentration) on the y-axis.
  • 8.
    NORMAL MRS CHOLINENAA CREATINE
  • 9.
     MRS ofwhite matter in a normal brain. (A) Long TE spectra have less baseline distortion and are easy to process and analyze but show fewer metabolites than short TE spectra. Also, the lactate peaks are inverted, which makes them easier to differentiate them from lipids. (B) Short TE demonstrates peaks attributable to more metabolites, including lipids, glutamine and glutamate, and myo-inositol
  • 10.
  • 11.
    OBSERVABLE METABOLITES Metabolite Location ppm Normalfunction Increased Lipids 0.9 & 1.3 Cell membrane component Hypoxia, trauma, high grade neoplasia. Lactate 1.3 TE=272 (upright) TE=136 (inverted) Denotes anaerobic glycolysis Hypoxia, stroke, necrosis, mitochondrial diseases, neoplasia, seizure Alanine 1.5 Amino acid Meningioma Acetate 1.9 Anabolic precursor Abscess , Neoplasia,
  • 12.
    PRINCIPLE METABOLITES Metabolite Location ppm Normal function IncreasedDecreased NAA 2 Nonspecific neuronal marker (Reference for chemical shift) Canavan’s disease Neuronal loss, stroke, dementia, AD, hypoxia, neoplasia, abscess Glutamate , glutamine, GABA 2.1- 2.4 Neurotransmitt er Hypoxia, HE Hyponatremia Succinate 2.4 Part of TCA cycle Brain abscess Creatine 3.03 Cell energy marker (Reference for metabolite ratio) Trauma, hyperosmolar state Stroke, hypoxia, neoplasia
  • 13.
    Metabolite Location ppm Normal function Increased Decreased Choline3.2 Marker of cell memb turnover Neoplasia, demyelination (MS) Hypomyelinatio n Myoinositol 3.5 & 4 Astrocyte marker AD Demyelinating diseases
  • 14.
    METABOLITE RATIOS: Normal abnormal NAA/Cr 2.0 <1.6 NAA/ Cho 1.6 <1.2 Cho/Cr 1.2 >1.5 Cho/NAA 0.8 >0.9 Myo/NAA 0.5 >0.8
  • 15.
    MRS Dec NAA/Cr Inc acetate, succinate, aminoacid, lactate Neuodegener ative Alzheimer Dec NAA/Cr Dec NAA/ Cho Inc Myo/NAA Slightly inc Cho/ Cr Cho/NAA Normal Myo/NAA ± lipid/lactate Inc Cho/Cr Myo/NAA Cho/NAA Dec NAA/Cr ± lipid/lactate Malignancy Demyelinating disease Pyogenic abscess
  • 16.
    CLINICAL APPLICATIONS OFMRS:  Class A MRS Applications: Useful in Individual Patients 1) MRS of brain masses:  Distinguish neoplastic from non neoplastic masses  Primary from metastatic masses.  Tumor recurrence vs radiation necrosis  Prognostication of the disease  Mark region for stereotactic biopsy.  Monitoring response to treatment.  Research tool 2) MRS of Inborn Errors of Metabolism Include the leukodystrophies, mitochondrial disorders, and enzyme defects that cause an absence or accumulation of metabolites
  • 17.
    CLASS B MRSAPPLICATIONS: OCCASIONALLY USEFUL IN INDIVIDUAL PATIENTS 1) Ischemia, Hypoxia, and Related Brain Injuries  Ischemic stroke  Hypoxic ischemic encephalopathy. 2)Epilepsy Class C Applications: Useful Primarily in Groups of Patients (Research)  HIV disease and the brain  Neurodegenerative disorders  Amyotrophic lateral sclerosis  Multiple sclerosis  Hepatic encephalopathy  Psychiatric disorders
  • 18.
    A 50 yrM with fever, headache and Lt hemiparesis B, Axial T2-weighted image showing ring lesion with surrounding hyperintensity and mass effect. C, Axial contrast-enhanced T1W image shows a ring-shaped cystic lesion and surrounding edema. D, DWI shows marked hyperintensity in the cavity and slight iso- to hypointensity surrounding the edema. E, ADC map reveals hypointensity in the cavity, representing restricted diffusion, and hyperintense areas surrounding the edema. DDx- ?abscess, ?tumor F ,G. MRS from the abscess cavity show peaks of acetate (Ac), alanine (Ala), lactate (Lac), and amino acids (AA). At a TE of 135 (G), the phase reversal resonances are well depicted at 1.5, 1.3, and 0.9 ppm, which confirms the assignment to alanine, lactate, and amino acids, respectively. Dx- Pyogenic abscess
  • 19.
    A 67 YRM WITH POSTERIOR FOSSA SOL B. Axial T2WI showing hyperintense mass lesion in Rt cerebellum. Box in the center of the lesion represents the 1H-MRS volume of interest. C, Axial contrast-enhanced T1W image shows a ring-enhanced lesion in the right cerebellum. D, DWI shows markedly low signal intensity in the necrotic part of the tumor. E, ADC map reveals high signal intensity in the necrotic part of the tumor that is similar to that of CSF, reflecting marked diffusion. DDX- ?tumor F ,G. MRS from the necrotic center of the tumor show a lactate (Lac) peak at 1.3 ppm that is inverted at a TE of 135. No amino acid or lipid peaks seen Dx- tumor Biopsy revealed metastasis from primary lung adenocarcinoma
  • 20.
     Serial magneticresonance spectroscopic data from a 25-year-old lady who was under 6-monthly imaging follow-up for a low-grade glioma. A. Voxel (open square) is situated in the bulk of the tumour, which is appreciated as an ill-defined area of T2-weighted hyperintensity within the cingulate gyrus of the right frontal lobe. B. Initial spectra at presentation demonstrates abnormal Cho/NAA area ratio of 1.4. Note the absence of lactate at 1.33ppm. C. Spectroscopy 6-months later demonstrates deterioration in the Cho/NAA area ratio (now 2.21) and the new presence of an inverted lactate peak
  • 21.
    A 48 YF WITH HEADACHE AND LEFT HEMIPARESIS A, Coronal contrast-enhanced T1-weighted MR image shows a large right temporal mass with rich contrast uptake with extensive midline shift. B, Spectrum of the lesion shows increased Cho/Cr ratio and an absence of NAA. There is an alanine (Ala) doublet at 1.45 ppm and lipid (lip) signals at 0.8 to 1.2 ppm Dx- Meningioma
  • 22.
    A 27 YM WITH MULTIPLE NODULAR LESIONS IN BRAIN A.T1WE at midbrain level shows nothing remarkable B. Contrast enhanced T1 W image revealed multiple small nodular areas of enhancement predominantly located at gray white junction. DDx- ?Multiple tuberculoma, ?Multiple NCC C. MR spectroscopy (A; TE = 35ms). peaks A and B at 0.9 and 1.33 ppm, respectively, represent typical long-chain lipids (lipid/lactate). NAA and Cr are barely detectable. A small Cho peak, C, is seen to resonate at 3.2 ppm. (B; TE = 144ms) Long TE MRS depicts persistence of predominant lipid peak at 1.33 ppm. Dx- Multiple tuberculoma
  • 24.
    A 14 YM WITH REFRACTORY CPS PLANNED FOR SURGERY •Conventional MRI revealed no apparent abnormality. •MRS of Left anterior hippocampus showed smaller NAA peak (33% less) compared to Right indicating a left temporal seizure focus LeftRight
  • 25.
     MRS inhippocampal sclerosis Short TE (35msec) spectra at 3T obtained in the left and right hippocampal formation from a patient with right HS using single-voxel technique. The decreased NAA signal and the increased mI at the affected region (A) are shown when compared with the contralateral normal hippocampal formation
  • 26.
    FUC OF A48YR F WITH PROVEN GLIOBLASTOMA MULTIFORME TREATED WITH SURGERY, EXTERNAL BEAM RADIATION AND INTERSTITIAL BRACHYTHERAPY. A, Axial T1-weighted MR image reveals enhancement of a right frontal lobe/insular lesion that has both solid and cavitary components. The spectroscopy voxel includes the medial margin of enhancement. DDx- ?Recurrent tumor, ?Radiation necrosis B, MR spectrum shows a prominent lipid/lactate peak with minimal residual Cho and Cr; NAA is absent. Dx -radiation necrosis Diagnosis was confirmed at resection. This patient had subsequent follow-up spectroscopy studies at 1, 3, and 4 months that were unchanged (not shown). Lip Lac NAACho Cr
  • 27.
    76 YRS MALEPRESENTED WITH RECENT MEMORY LOSS •T1W image shows reduction in the volume of the hippocampus. •Proton MRS in hippocampal region shows MI peak, decreased NAA and elevated MI/Cr ratio •Dx - Alzheimer’s Disease
  • 28.
     Canavan disease,or spongiform leukodystrophy, results from a deficiency of aspartocylase, an enzyme that hydrolyzes NAA to acetate and aspartate. In its absence, NAA accumulates in the brain. MRS is diagnostic for this condition because the abnormally high NAA peak is almost exclusively seen in Canavan disease.
  • 29.
     Patient withknown diagnosis of MELAS with new onset of visual symptoms. (Mitochondrial encephalomyopathy, lactic acidosis and stroke-like episodes) presenting (A) 1.5T brain MRI demonstrates areas of T2 hyperintensity and (B) abnormal restricted diffusion, likely related to stroke-like areas of cytotoxic edema. (C) MR spectroscopy (TE=144 ms) from the right occipital abnormality shows an inverted doublet at 1.3 ppm (arrows) consistent with a lactate peak.
  • 30.
    MRS IN OTHERCONDITIONS  Ischemic stroke- appearance of lactate peak within minutes of ischemia. In chronic phase NAA is suppressed  AIDS dementia- increased MI and Gln detected. MRS may help in detection of subclinical disease, opportunistic infections and monitoring ART  Multiple sclerosis- Increased Cho due to active demylination. Lipid and Lac may also rise. Presence of MI suggests severe demylination
  • 31.
    FUNCTIONAL MRS  Itis a promising new technique still in research phase  Fast spectroscopic imaging technique is used to detect transient rise in metabolites during language or visual tasks  Increase in Lac and Cr have been noted in left temporal lobe during language task  May complement fMRI and PET
  • 32.
    7 MONTH INFANTWITH DELAYED MILESTONES & SPASTICITY  T 1W– diffuse hypointensity of supratentorial white matter.  T2W -diffuse hyperintensity of supratentorial white matter  MRS show markedly raised NAA peak as compared to control subject.  Dx – Canavan’s disease.
  • 33.
    5 YRS CHILDWITH SEIZURES & 2 STROKE LIKE EPISODES  A – T 2 W- hyperintense left occipital region.  B- MRS obtained from rt & lt occipital cortices. -inverted doublet lactate peak from rt occipital cortex at 1.3 ppm -reduced all peaks from old lt lesion.  Dx – MELAS
  • 34.
    ALZHEIMER’S DISEASE •T1W imageshows reduction in the volume of the hippocampus of the patient with AD •Proton MRS in hippocampal region shows MI peak,decreased NAA and elevated MI/Cr ratio
  • 35.
    PATIENT WITH REFRACTORYCPS PLANNED FOR SURGERY •Conventional MRI revealed no apparent abnormality. •MRS of Left anterior hippocampus showed smaller NAA peak (33% less) compared to Right indicating a left temporal seizure focus LeftRight
  • 36.
    LOCALISED 1H-MR SPECTROSCOPYFOR METABOLIC CHARACTERISATION OF DIFFUSE AND FOCAL BRAIN LESIONS IN PATIENTS INFECTED WITH HIV I L SIMONEA ET AL  A significant decrease in NAA/Cr and NAA/Cho ratios were found in all HIV diagnostic groups in comparison with neurological controls (p<0.003),  The NAA/Cr ratio was significantly lower in PML and lymphomas than in HIV encephalopathies (p<0.02) and toxoplasmosis (p<0.05).  HIV encephalopathies, lymphomas, and toxoplasmosis showed a significant increase in the Cho/Cr ratio in comparison with neurological controls (p<0.03)  The presence of a lipid signal was more frequent in lymphomas (71%) than in other HIV groups CONCLUSION 1H-MRS shows a high sensitivity in detecting brain involvement in HIV related diseases, but a poor specificity in differential diagnosis of HIV brain lesions.
  • 37.
    OTHER CONDITIONS:  Hepaticencephalopathy: increased glutamate, decreased myoinositol  Phenylketonuria: increased Phenylalanine peak at 7.3ppm  Parkinson’s disease  Motor neuron disease  Psychiatric disease
  • 38.
     Proton magneticresonance spectroscopy of the brain is useful whenever biochemical or metabolic assessment may be necessary, such as in differential diagnosis of focal brain lesions (neoplastic and non-neoplastic diseases)  Diagnosis , grading of tumors and response to treatment  NAA marker of neuronal viability  Tumors – increased Cho/Cr, Cho/NAA, lipid lactate, decreased NAA/Cr  Abscess: increased Cho/Cr, lactate, acetate, succinate peaks  Demyelinating disease: slightly increased Cho/Cr, Cho/NAA, lipid , decreased NAA/Cr  It is non invasive, radiation free, time saving, cost effective, very sensitive and specific
  • 39.
     The MRspectra do not come labeled with diagnoses. They require interpretation and should always be correlated with the MR images before making a final diagnosis
  • 40.
     Proton magneticresonance spectroscopy of the brain is useful whenever biochemical or metabolic assessment may be necessary, such as in differential diagnosis of focal brain lesions (neoplastic and non-neoplastic diseases);  brain lesions in patients with acquired immunodeficiency syndrome;  Diagnosis of dementiaand other degenerative diseases;  follow-up radiation therapy for patients with brain neoplasms;  demyelinating diseases such as multiple sclerosis and leukodystrophy;  diagnosis and prognosis of brain ischemic and traumatic lesions  assessment of epilepsy;  biochemical alterations in hepatic encephalopathies;  and neuropediatric affections such as brain tumors,  inborn errors of metabolism and hypoxic encephalopathy.
  • 41.
     There aretwo methods of proton magnetic resonance spectroscopy: single voxel and  multivoxel, with or without spectroscopic imaging.  Single voxel proton magnetic resonance spectroscopy provides a rapid biochemical  profile of a localized volume within a region of interest that may be determined, especially in brain studies.  Spectroscopic imaging provides biochemical information about multiple, small and contiguous volumes focalized on a particular region of interest that may allow the mapping of metabolic tissue distribution. By using this method, the data obtained may be manipulated by computer and superimposed on the image of an abnormality, thereby illustrating the distribution of such metabolites within that area.
  • 42.
     Short echotimes are indicated for the study of metabolic and diffuse diseases. By using long echo times (more than 135 milliseconds), smaller numbers of metabolites are detected, but with better definition of peaks, thereby facilitating graphic analysis. Long echo times are more used in focal brain lesions.  Quantitation of taurine (Tau) concentrations with proton magnetic resonance spectroscopy improves the differentiation of primitive neuroectodermal tumors (PNET) from other common brain tumors in pediatric patients as taurine concentration was significantly elevated in PNETs compared to other tumors
  • 43.
     Interpretation ofthe spectroscopic curve  The spectrum represents radiofrequency signals emitted from the proton nuclei of the different metabolites into the region of interest. Specific metabolites always appear at the same frequencies, expressed as parts per million, and are represented on the horizontal axis of the graph. The vertical axis shows the heights of the metabolite peaks, represented on an arbitrary intensity scale
  • 44.
    EFFECT OF TEON THE PEAKS __________ TE 35ms ___________ ___________ TE 144ms __________
  • 45.
     Normal spectraldata obtained at intermediate echo-time by single- voxel 1H magnetic resonance spectroscopy of the cerebellar vermis using a point-resolved spectroscopic sequence . X-axis, labelled in parts per million (ppm). The amplitude of the resonances is measured on the Y-axis using an arbitrary scale. The most prominent peak is N- acetyl aspartate at 2.02ppm. Following from right to left: creatine (Cr) at 3.02 (and 3.9) and choline (Cho) at 3.2
  • 46.
  • 47.
     Serial magneticresonance imaging and spin-echo spectra recorded at an echo time of 135 ms from an acute multiple sclerosis plaque. T2- FLAIR images show an initial progressive lesion size increase followed by a decrease over 1 year of follow up. 1H-MRS during the acute stage shows the presence of Lac, a slight decrease in NAA, and an increase in Cho. The longitudinal study demonstrates Lac disappearance at 3 months, persistent low levels of NAA, a progressive Cho increase during the first weeks followed by partial recovery, and relatively stable Cr at all time points.
  • 48.

Editor's Notes

  • #12 Lipid increase in high-grade gliomas, meningiomas, demyelination, necrotic foci, and inborn errors of metabolism
  • #13 NAA is the most prominent one in normal adult brain proton MRS and is used as a reference for determination of chemical shift and nonspecific neuronal marker. Normal absolute concentrations of NAA in the adult brain are generally in the range of 8 to 9 mmol/kg. NAA concentrations are decreased in many brain disorders, resulting in neuronal and axonal loss, such as in neurodegenerative diseases, stroke, brain tumors, epilepsy, and multiple sclerosis, but are increased in Canavan's disease Cr peak is an indirect indicator of brain intracellular energy stores, tends to be relatively constant in each tissue type in normal brain, mean absolute Cr concentration in normal adult brains of 7.49; reduced in all brain tumors, particularly malignant ones
  • #14 Cho reflects cell membrane synthesis and Degradation. Processes resulting in hypercellularity (e.g., primary brain neoplasms or gliosis) or myelin breakdown (demyelinating diseases) lead to locally increased Cho concentration, whereas hypomyelinating diseases result in decreased Cho levels. Mean absolute Cho concentration in normal adult brain tissue of 1.32 Ig3 MI is believed to be a glial marker because it is present primarily in glial cells and is absent in neurons; abnormally increased in patients with demyelinating diseases and in those with Alzheimer's disease Lac levels in normal brain tissue are absent or extremely low (C0.5 Mmol/L), they are essentially undetectable on normal spectra. Found in anaerobic glycolysis, which may be seen with brain neoplasms, infarcts, hypoxia, metabolic disorders or seizure and accumulate within cysts or foci of necrosis.