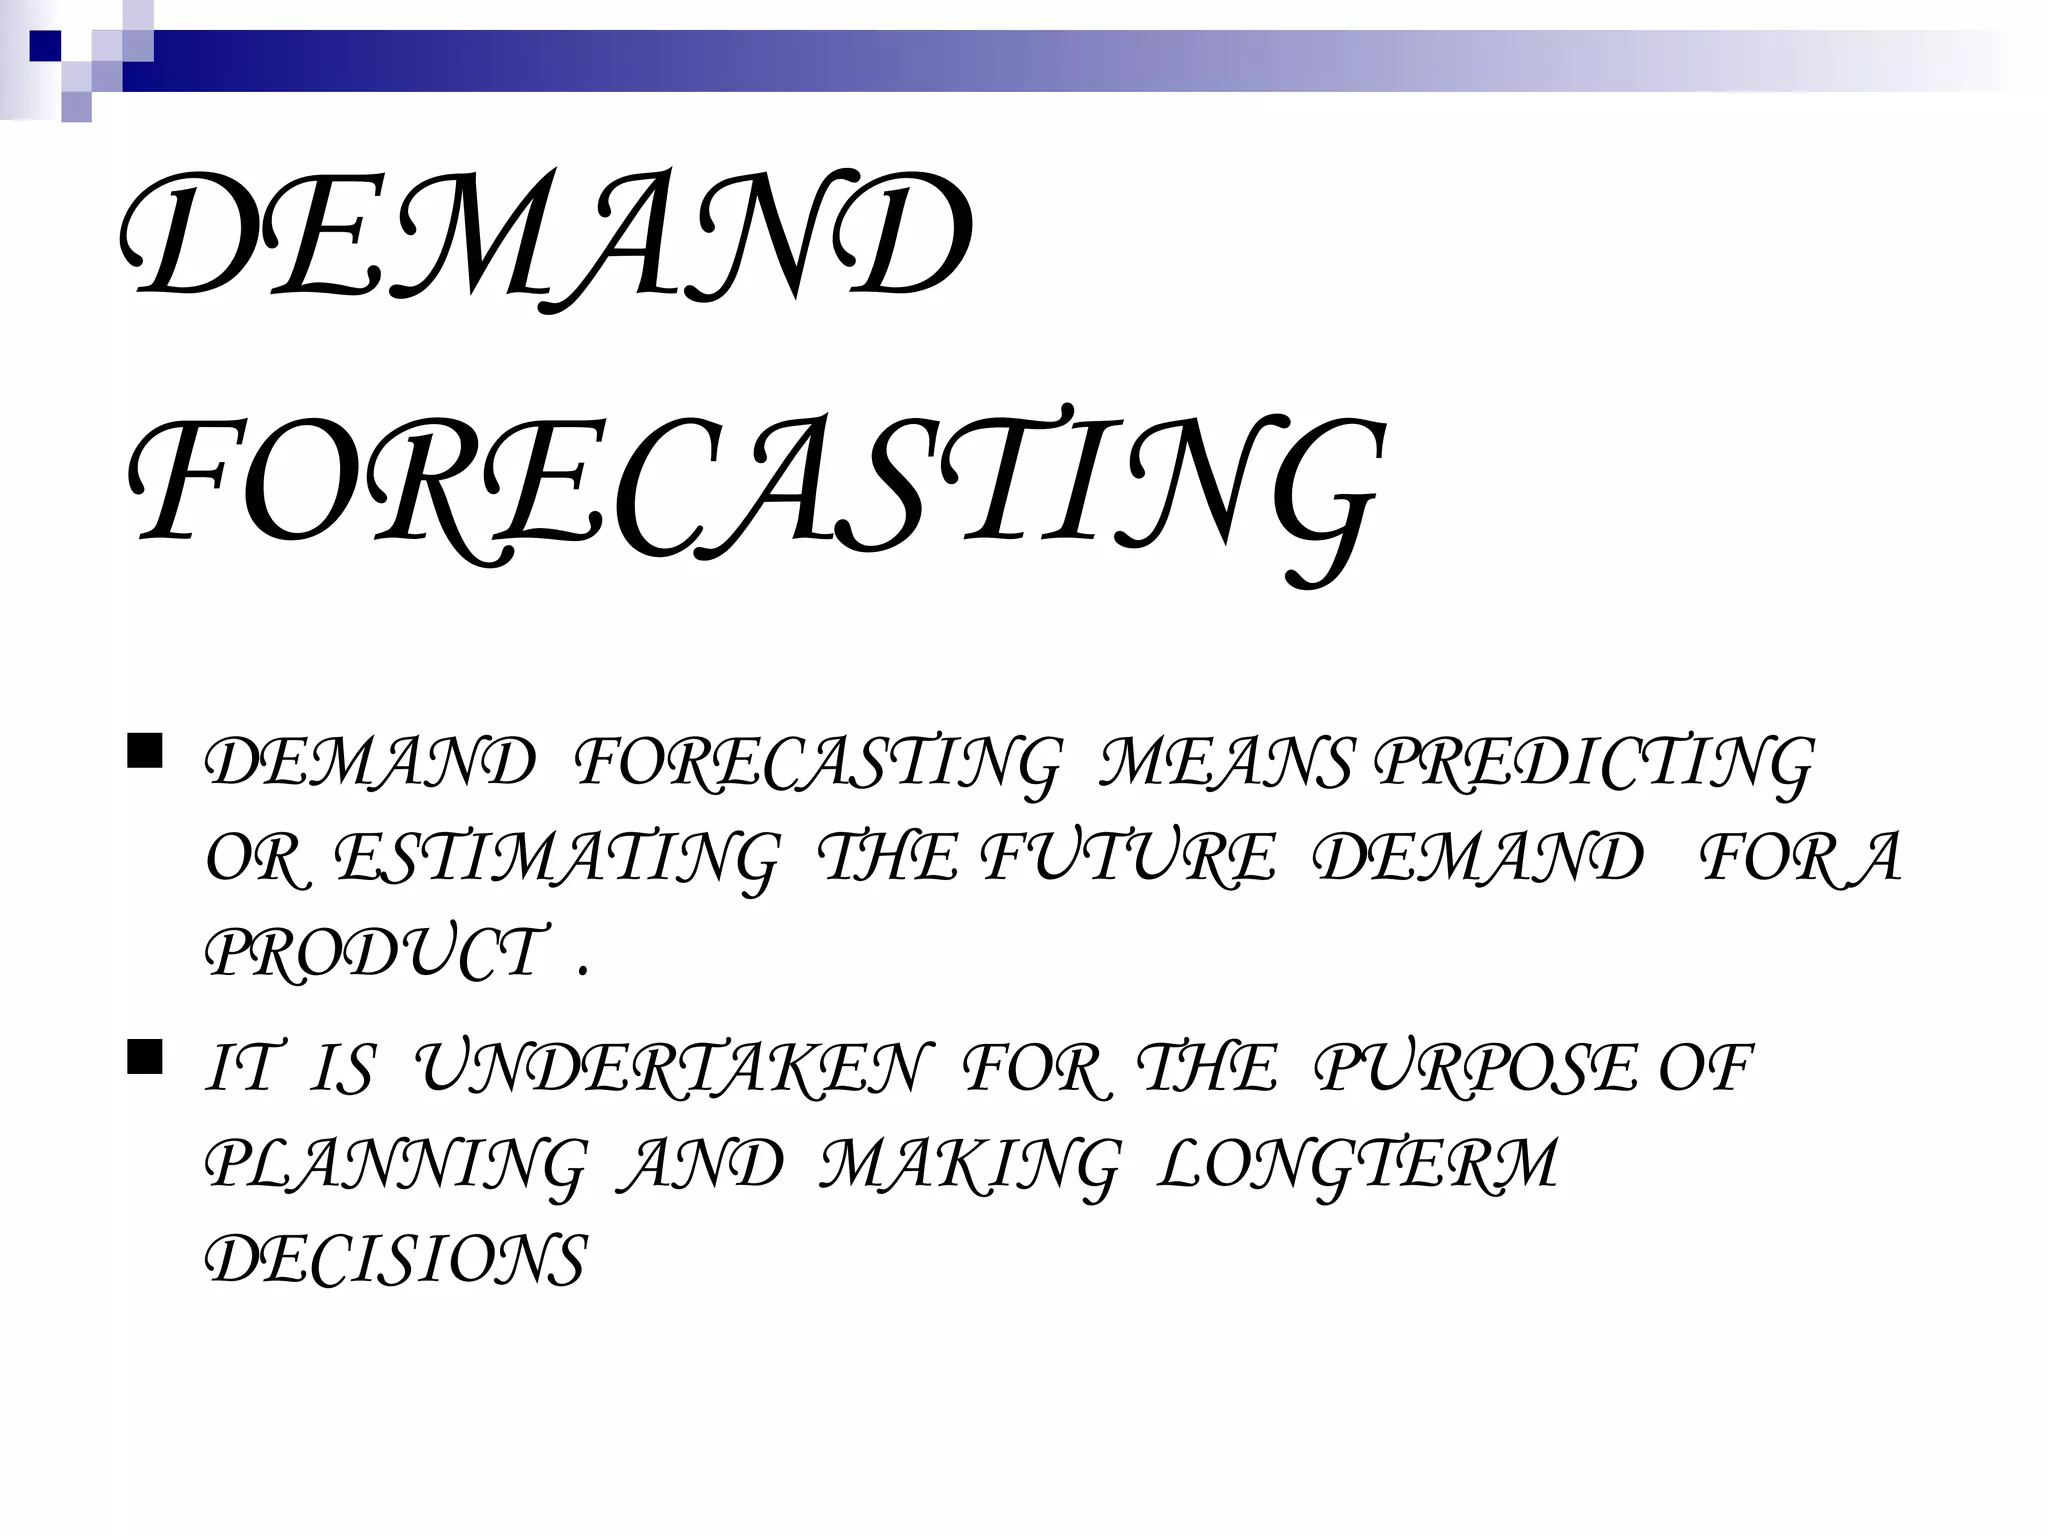
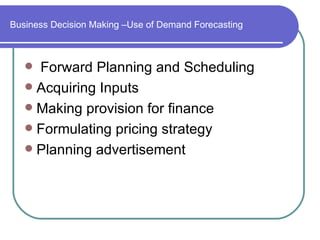
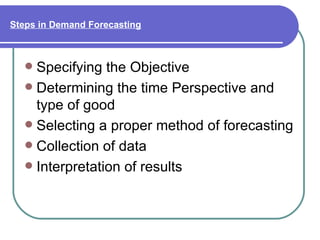
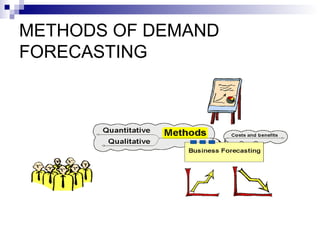
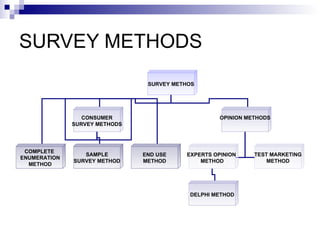
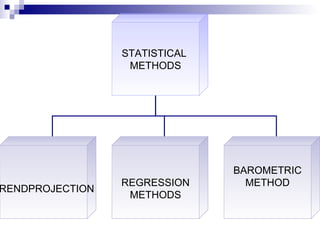
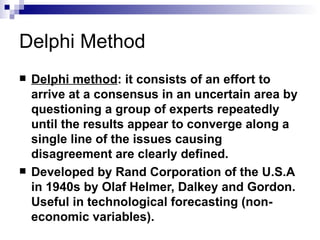
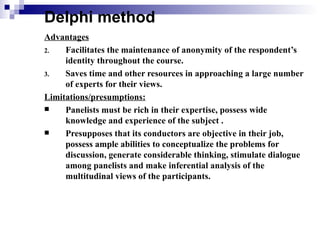
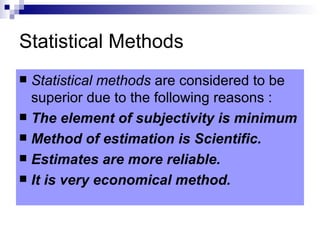
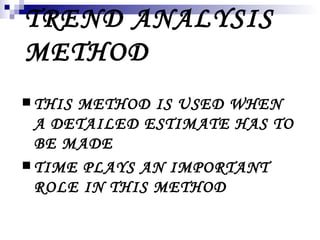
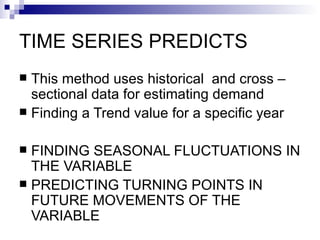
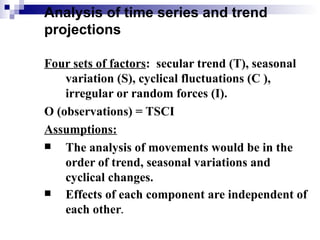
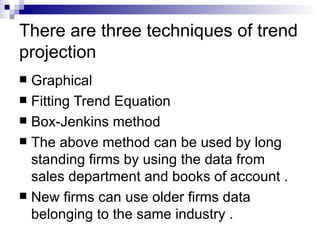
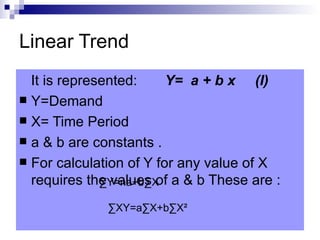
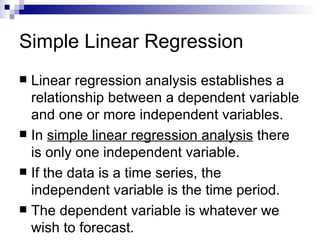
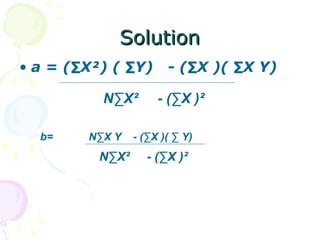
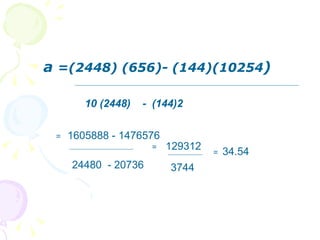
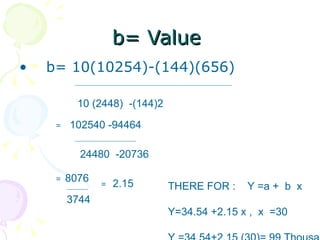
1. DEMAND
FORECASTING
DEMAND FORECASTING MEANS PREDICTING
OR ESTIMATING THE FUTURE DEMAND FOR A
PRODUCT .
IT IS UNDERTAKEN FOR THE PURPOSE OF
PLANNING AND MAKING LONGTERM
DECISIONS
2. Business Decision Making –Use of Demand Forecasting
Forward Planning and Scheduling
Acquiring Inputs
Making provision for finance
Formulating pricing strategy
Planning advertisement
3. Demand Forecasting
General considerations:
2. Factors involved in demand forecasting
3. Purposes of forecasting
4. Determinants of demand
5. Length of forecasts
6. Forecasting demand for new products
7. Criteria of a good forecasting method
8. Presentation of a forecast to the management
Methods of demand forecasting
Approach to forecasting
4. Steps in Demand Forecasting
Specifying the Objective
Determining the time Perspective and
type of good
Selecting a proper method of forecasting
Collection of data
Interpretation of results
5. Forecasting Horizons.
Short Term (0 to 3 months): for inventory
management and scheduling.
Medium Term (3 months to 2 years): for
production planning, purchasing, and
distribution.
Long Term (2 years and more): for
capacity planning, facility location, and
strategic planning.
6. Presentation of a forecast to the
Management
In presenting a forecast to the management, a managerial
economist should:
2. Make the forecast as easy for the management to understand as
possible.
3. Avoid using vague generalities.
4. Always pin-point the major assumptions and sources.
5. Give the possible margin of error.
6. Avoid making undue qualifications.
7. Omit details about methodology and calculations.
8. Make use of charts and graphs as much as possible for easy
comprehension.
7. Factors involved in Demand Forecasting
2. Undertaken at three levels:
b. Macro-level
c. Industry level eg., trade associations
d. Firm level
3. Should the forecast be general or specific (product-
wise)?
4. Problems or methods of forecasting for “new” vis-à-vis
“well established” products.
5. Classification of products – producer goods, consumer
durables, consumer goods, services.
6. Special factors peculiar to the product and the market –
risk and uncertainty. (eg., ladies’ dresses)
8. Criteria of a good forecasting method
1 . Simplicity and ease of
comprehension.
2. Accuracy – measured by
(a) degree of deviations
between forecasts and
actuals, and (b) the extent
of success in forecasting
directional changes.
3. Economy.
4. Availability.
5. Maintenance of
timeliness.
12. Techniques of Demand Forecasting-Survey Methods
Though statistical techniques are essential
in clarifying relationships and providing
techniques of analysis, they are not
substitutes for judgement. What is needed
is some common sense mean between pure
guessing and too much mathematics.
Consumer Survey
13. Delphi Method
Delphi method: it consists of an effort to
arrive at a consensus in an uncertain area by
questioning a group of experts repeatedly
until the results appear to converge along a
single line of the issues causing
disagreement are clearly defined.
Developed by Rand Corporation of the U.S.A
in 1940s by Olaf Helmer, Dalkey and Gordon.
Useful in technological forecasting (non-
economic variables).
14. Delphi method
Advantages
2. Facilitates the maintenance of anonymity of the respondent’s
identity throughout the course.
3. Saves time and other resources in approaching a large number
of experts for their views.
Limitations/presumptions:
Panelists must be rich in their expertise, possess wide
knowledge and experience of the subject .
Presupposes that its conductors are objective in their job,
possess ample abilities to conceptualize the problems for
discussion, generate considerable thinking, stimulate dialogue
among panelists and make inferential analysis of the
multitudinal views of the participants.
15. Statistical Methods
Statistical methods are considered to be
superior due to the following reasons :
The element of subjectivity is minimum
Method of estimation is Scientific.
Estimates are more reliable.
It is very economical method.
17. TIME SERIES PREDICTS
This method uses historical and cross –
sectional data for estimating demand
Finding a Trend value for a specific year
FINDING SEASONAL FLUCTUATIONS IN
THE VARIABLE
PREDICTING TURNING POINTS IN
FUTURE MOVEMENTS OF THE
VARIABLE
18. Analysis of time series and trend
projections
Four sets of factors: secular trend (T), seasonal
variation (S), cyclical fluctuations (C ),
irregular or random forces (I).
O (observations) = TSCI
Assumptions:
The analysis of movements would be in the
order of trend, seasonal variations and
cyclical changes.
Effects of each component are independent of
each other.
19. There are three techniques of trend
projection
Graphical
Fitting Trend Equation
Box-Jenkins method
The above method can be used by long
standing firms by using the data from
sales department and books of account .
New firms can use older firms data
belonging to the same industry .
20. Linear Trend
It is represented: Y= a + b x (I)
Y=Demand
X= Time Period
a & b are constants .
For calculation of Y for any value of X
requires the values of a & b These are :
∑Y=na+b∑X
∑XY=a∑X+b∑X²
21. Problem & Solution
The data relate to the sale of generator
sets of a company over the last five years
Year : 2003 2004 2005 2006 2007
sets : 120 130 150 140 160
Estimate the demand for generator sets in
the year 2012 if the present trend
continues
22. Year X Y x² Y² XY
2003 1 120 1 14400 120
2004 2 130 4 16900 260
2005 3 150 9 22500 450
2006 4 140 16 19600 560
2007 5 160 25 25600 800
Total 15 700 55 99000 2190
Substituting table values in equation ii & iii we get
∑Y=na+b∑X
700 = 5a +15b
∑XY=a∑X+b∑X²
2190 = 15a +55b
By multiplying equation iv by 3 and subtracting it from equation v we get
10b =90
b =9
23. Solution
Substitute this value in equation iv we have
700 =5a +15 b
700 = 5a +15 (9)
5a =565
a = 113
Trend equation Y=113 + 9x
For 2012 ,x will be 10
Y2012 = 113+9 x 10 =203 sets
24. Simple Linear Regression
Linear regression analysis establishes a
relationship between a dependent variable
and one or more independent variables.
In simple linear regression analysis there
is only one independent variable.
If the data is a time series, the
independent variable is the time period.
The dependent variable is whatever we
wish to forecast.
25. Simple Linear Regression
Regression Equation
This model is of the form:
Y = a + bX
Y = dependent variable
X = independent variable
a = y-axis intercept
b = slope of regression line
26. Simple Linear Regression
Once the a and b values are computed, a
future value of X can be entered into the
regression equation and a corresponding
value of Y (the forecast) can be
calculated.
27. Problem :
The data of a firm relating to sales and
advertisement is given below .If the
manager decides to spend Rs 30 mill in
the year 2005 what will be the prediction
for sales
31. b= Value
• b= 10(10254)-(144)(656)
10 (2448) -(144)2
= 102540 -94464
24480 -20736
= 8076 = 2.15 THERE FOR : Y =a + b x
3744
Y=34.54 +2.15 x , x =30