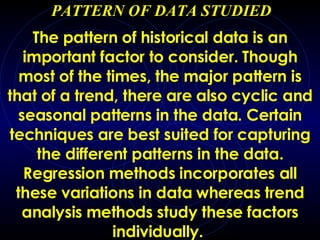
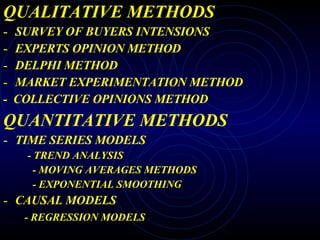
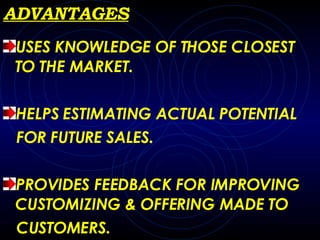
Demand Forecasting
SO  WHAT  “ IS ” DEMAND F ORECASTING?
Forecasting customer demand for products and services is a proactive process of determining  what products  are needed  where ,  when , and in  what quantities . Consequently, demand forecasting is a customer–focused activity.  Demand forecasting is also the foundation of a company’s entire logistics process. It supports other planning activities such as capacity planning, inventory planning, and even overall business planning.
Characteristics of demand 5 main characters of demand are- Average Demand tends to cluster around a specific level.  Trend Demand consistently increases or decreases over time.  Seasonality Demand shows peaks and valleys at consistent intervals. These intervals can be hours, days, weeks, months, years, or seasons.  Cyclicity Demand gradually increases and decreases over an extended period  of time, such as years. Business cycles (recession/expansion) product life cycles influence this component of demand.  Elasticity Degree of responsiveness of demand to a corresponding proportionate change in factors effecting it.
TYPES OF FORECASTS PASSIVE FORECASTS Where the factors being forecasted  are assumed to be constant over a period of time and changes are ignored. ACTIVE FORECASTS Where factors being forecasted are  taken as flexible and are subject  to changes.
Why Study forecasting? Reduces future uncertainties, helps study markets  that are dynamic, volatile and competitive  Allows operating levels to be set to respond to  demand variations Allows managers to plan personnel, operations of  purchasing & finance for better control over wastes  inefficiency and conflicts. Inventory Control-reduces reserves of slack resources to meet  uncertain demand Effective forecasting builds stability in operations. Setting Sales Targets, Pricing policies, establishing  controls and incentives
How? THE FORECAST Step 6 Monitor the forecast Step 5 Prepare the forecast Step 4 Gather and analyze data Step 3 Select a forecasting technique Step 2 Establish a time horizon  Step 1 Determine purpose of forecast
LEVELS OF FORECASTING AT FIRMS LEVEL AT INDUSTRY LEVEL AT TOTAL MARKET LEVEL
KEY FACTORS FOR SELECTING A RIGHT METHOD TIME PERIOD SHORT TERM 3-6 Months, Operating Decisions,  E.g- Production planning MEDIUM TERM 6 months-2 years, Tactical Decision E.g.- Employment changes LONG TERM Above 2 years, Strategic Decision E.g.- Research and Development
DATA REQUIREMENTS Techniques differ by virtue of how  much data is required to successfully employ the technique.  Judgmental techniques require little or no data whereas methods such as Time series analysis or Regression models require a large amount of past or historical data.
PURPOSE OF STUDY It means the extent of explanation required from the study.  Some techniques are based purely on the pattern of past data and may do quite well at forecasting, whereas many  a  times these are not useful by themselves since it is d ifficult to explain  the causal factors underlying the forecast.
PATTERN OF DATA STUDIED The pattern of historical data is an important factor to consider. Though most of the times, the major pattern is that of a trend, there are also cyclic and seasonal patterns in the data. Certain techniques are best suited for capturing the different patterns in the data. Regression methods incorporates all these variations in data whereas trend analysis methods study these factors individually.
SO ,WE KNOW WHAT IT’S ALL  ABOUT!!! NOW LETS ANALYSE THE  METHODS  OF DEMAND FORECASTING.
2 MAIN CATEGORIES MICROECONOMIC METHODS ( QUANTITATIVE) - involves the prediction of activity of particular firms, branded products, commodities, markets, and industries.  - are much more reliable than macroeconomic methods because the dimensionality of factors is lower and often can easily be incorporated into a model.  MACROECONOMIC METHODS (QUALITATIVE) -   involves the prediction of economic aggregates such as inflation, unemployment, GDP growth, short-term interest rates, and trade flows. - is very difficult because of the complex interdependencies in the overall economic factors
QUALITATIVE METHODS SURVEY OF BUYERS INTENSIONS EXPERTS OPINION METHOD DELPHI METHOD MARKET EXPERIMENTATION METHOD -  COLLECTIVE OPINIONS METHOD QUANTITATIVE METHODS TIME SERIES MODELS - TREND ANALYSIS - MOVING AVERAGES METHODS - EXPONENTIAL SMOOTHING CAUSAL MODELS - REGRESSION MODELS
BUYERS INTENSION SURVEY FEATURES EMPLOYS SAMPLE SURVEY TECHNIQUES FOR GATHERING DATA. DATA IS COLLECTED FROM END USERS OF GOODS - CONSUMER, PRODUCER,MIXED. DATA PORTRAYS BIASES AND PREFERENCES OF  CUSTOMERS. IDEAL FOR SHORT AND MEDIUM TERM DEMAND FORECASTING, IS COST EFFECTIVE AND RELIABLE.
ADVANTAGES HELPS IN APPROXIMATING FUTURE  REQUIREMENTS EVEN WITHOUT PAST DATA. ACCURATE METHOD AS BUYERS NEEDS AND WANTS ARE CLEARLY IDENTIFIED & CATERED TO. MOST EFFECTIVE WAY OF ASSESSING DEMAND FOR NEW FIRMS
LIMITATIONS People may not know what they are going to purchase They may report what they want to buy, but not what they are capable of buying Customers may not want to disclose real information Effects of derived demand may make forecasting difficult
EXPERTS OPINION METHOD FEATURES PANEL OF EXPERTS IN SAME FIELD WITH EXPERIENCE & WORKING KNOWLEDGE. COMBINES INPUT FROM KEY INFORMATION SOURCES. EXCHANGE OF IDEAS AND CLAIMS. FINAL DECISION IS BASED ON MAJORITY OR CONSENSUS, REACHED FROM EXPERT’S FORECASTS
ADVANTAGES CAN BE UNDERTAKEN EASILY WITHOUT THE USE OF ELABORATE STATISTICAL TOOLS. INCORPORATES A VARIETY OF  EXTENSIVE OPINIONS FROM EXPERT IN THE FIELD.
LIMITATIONS JUDGEMENTAL BIASES FOR EXAMPLE Availability heuristic Involves using vivid or accessible events as a basis for the judgment.   Law of small numbers People expect information obtained from a small sample to be typical of the larger population
COMPETATIVE BIASES Over reliance on personal opinions. Possibility of undue influence in certain cases. STATISTICAL INADEQUACY Lack of statistical and quantifiable data or figures to substantiate the forecasts made.
DELPHI METHOD PANEL OF EXPERTS IS SELECTED. ONE CO-ORDINATOR IS CHOSEN BY MEMBERS OF THE JURY ANONYMOUS FORECASTS ARE MADE BY EXPERTS BASED ON A COMMON QUESTIONNAIRE. CO-ORDINATOR RENDERS AN AVERAGE OF ALL FORECASTS MADE TO EACH OF THE MEMBERS.
3 CONSEQUENCES- DIVERSION, CONSENSUS OR NO AGREEMENT. 2 TO 3 CYCLES ARE UNDERTAKEN. CONVERGENCE AND DIVERSION IS ACCEPTABLE. FORECASTS ARE REVISED UNTIL  A CONSENSUS IS REACHED BY ALL.
ADVANTAGES ELIMINATES NEED FOR GROUP MEETINGS. ELIMINATES BIASES IN GROUP  MEETINGS PARTICIPANTS CAN CHANGE THEIR OPINIONS ANONYMOUSLY.
LIMITATIONS TIME CONSUMING -REACHING  A CONSENSUS TAKES A LOT OF TIME. PARTICIPANTS MAY DROP OUT.
MARKET EXPERIMENTATION INVOLVES ACTUAL EXPERIMENTS & SIMULATIONS. COUPONS  ARE ISSUED  TO FEW SELECT CUSTOMERS. SELECTED CUSTOMERS PURCHASE THE PRODUCTS. PROXIMITY WITH CONSUMERS MAKES  INFORMATION  COLLECTED RELIABLE. INFORMATION FROM INTERACTIONS BETWEEN SALES PERSONNEL & CUSTOMERS IS USED FOR FORECASTING. BEST USED IF SALES PERSONNEL ARE HIGHLY SPECIALISED AND WELL TRAINED.
ADVANTAGES USES KNOWLEDGE OF THOSE CLOSEST TO THE MARKET. HELPS ESTIMATING ACTUAL POTENTIAL FOR FUTURE SALES. PROVIDES FEEDBACK FOR IMPROVING CUSTOMIZING & OFFERING MADE TO  CUSTOMERS.
COLLECTIVE OPINIONS METHOD OPINIONS FROM MARKETING &  SALES SPECIALISTS ARE COMPILED. 2 TYPES OF TARGETS ESTIMATED- AMBITIOUS TARGETS. CONSERVATIVE TARGETS. COMBINES EXPERTISE OF HIGHER LEVEL MANAGEMENT & SALES EXECUTIVES.
LIMITATIONS POWER STRUGGLES MAY OCCUR  BETWEEN SPECIALISTS. CONSENSUS MAY NOT BE REACHED IN GOOD TIME. DIFFERENCES AND PREJUDICES IN OPINIONS MAY ALSO EXIST.
“ A RE YOU STILL THERE??”
THAT FINISHES THE QUALITATIVE METHODS.  NOW LETS LOOK AT THE “ QUANTITATIVE  METHODS”
TIME SERIES MODELS Past data is used to make future predictions . Known or Independent variables are  used for predicting Unknown or  dependent variables, using the trend equation- “ Predictive analysis” Based on trend equation, we find  ‘ Line of Best Fit’ and then it is  projected in a scatter diagram, dividing points equally on both sides TREND ANALYSIS
TREND EQUATION Y^ = a + bX + E Y^ = Estimated value of Y a = Constant or Intercept b = slope of trend line X = independent variable E = Error term
= EXPLAINED VARIATION 1  - = UNEXPLAINED  VARIATION Explained variation - means the extent to which the independent variable explains the relative change in the dependent variable. Higher the explained variation, lower the error value leading to accurate forecast
 
MOVING AVERAGE METHOD Data from a number of consecutive past periods is combined to provide forecast for coming periods.Higher the amount of previous data, better is the forecast. Since the averages are calculated on a moving basis, the seasonal and  cyclical variations are smoothened  out.
EXPONENTIAL SMOOTHING Used in cases where the variable  under forecast doesn’t follow a  trend. 2 Types- Simple and Weighted Simple smoothing- simple average of specific observation called order. Weighted smoothing- weights assigned  in decreasing order as one moves from current period observations to previous  observations.
The equation for exponential  smoothing follows a Geometric  Progression.Values may be written as- a, a (1-a), a(1-a)^2….. a(1-n) where,  a = value of weight assigned  to the observation a(1-a) = weight assigned to 1 period  previous observation a(1-a)^2 = weight assigned to 2  periods previous observation Sum of all weights always equals Unity.
CASUAL MODELS It is a statistical technique for  quantifying the relationship between  variables. In simple regression analysis,  there is one dependent variable (e.g.  sales) to be forecast and one independent  variable. The values of the independent  variable are typically those assumed to  "cause" or determine the values of the  dependent variable. REGRESSION MODEL
For example Assuming that the amount of advertising dollars spent on a product determines the amount of its sales, we could use regression analysis to quantify the precise nature of the relationship between advertising and sales. For forecasting purposes, knowing the quantified relationship between the variables allows us to provide forecasting estimates
STEPS IN REGRESSION ANALYSIS 1.Identification of variables influencing demand for product under estimation. 2.Collection of historical data on  variables. 3.Choosing an appropriate form of function 4.Estimation of the function.
REGRESSION EQUATION Y =  Where Y= value being forecasted = constant value = coefficients of regression = independent variable
HIGHER REVENUES SALES MAXIMIZATION REDUCED INVESTMENTS FOR SAFETY STOCKS IMPROVED PRODUCTION PLANNING EARLY RECOGNITION OF MARKET TRENDS BETTER MARKET POSITIONING  IMPROVED CUSTOMER SERVICE LEVELS BENEFITS OF EFFECTIVE DEMAND FORECASTING

Demand Forecasting

  • 1.
  • 2.
    SO WHAT “ IS ” DEMAND F ORECASTING?
  • 3.
    Forecasting customer demandfor products and services is a proactive process of determining what products are needed where , when , and in what quantities . Consequently, demand forecasting is a customer–focused activity. Demand forecasting is also the foundation of a company’s entire logistics process. It supports other planning activities such as capacity planning, inventory planning, and even overall business planning.
  • 4.
    Characteristics of demand5 main characters of demand are- Average Demand tends to cluster around a specific level. Trend Demand consistently increases or decreases over time. Seasonality Demand shows peaks and valleys at consistent intervals. These intervals can be hours, days, weeks, months, years, or seasons. Cyclicity Demand gradually increases and decreases over an extended period of time, such as years. Business cycles (recession/expansion) product life cycles influence this component of demand. Elasticity Degree of responsiveness of demand to a corresponding proportionate change in factors effecting it.
  • 5.
    TYPES OF FORECASTSPASSIVE FORECASTS Where the factors being forecasted are assumed to be constant over a period of time and changes are ignored. ACTIVE FORECASTS Where factors being forecasted are taken as flexible and are subject to changes.
  • 6.
    Why Study forecasting?Reduces future uncertainties, helps study markets that are dynamic, volatile and competitive Allows operating levels to be set to respond to demand variations Allows managers to plan personnel, operations of purchasing & finance for better control over wastes inefficiency and conflicts. Inventory Control-reduces reserves of slack resources to meet uncertain demand Effective forecasting builds stability in operations. Setting Sales Targets, Pricing policies, establishing controls and incentives
  • 7.
    How? THE FORECASTStep 6 Monitor the forecast Step 5 Prepare the forecast Step 4 Gather and analyze data Step 3 Select a forecasting technique Step 2 Establish a time horizon Step 1 Determine purpose of forecast
  • 8.
    LEVELS OF FORECASTINGAT FIRMS LEVEL AT INDUSTRY LEVEL AT TOTAL MARKET LEVEL
  • 9.
    KEY FACTORS FORSELECTING A RIGHT METHOD TIME PERIOD SHORT TERM 3-6 Months, Operating Decisions, E.g- Production planning MEDIUM TERM 6 months-2 years, Tactical Decision E.g.- Employment changes LONG TERM Above 2 years, Strategic Decision E.g.- Research and Development
  • 10.
    DATA REQUIREMENTS Techniquesdiffer by virtue of how much data is required to successfully employ the technique. Judgmental techniques require little or no data whereas methods such as Time series analysis or Regression models require a large amount of past or historical data.
  • 11.
    PURPOSE OF STUDYIt means the extent of explanation required from the study. Some techniques are based purely on the pattern of past data and may do quite well at forecasting, whereas many a times these are not useful by themselves since it is d ifficult to explain the causal factors underlying the forecast.
  • 12.
    PATTERN OF DATASTUDIED The pattern of historical data is an important factor to consider. Though most of the times, the major pattern is that of a trend, there are also cyclic and seasonal patterns in the data. Certain techniques are best suited for capturing the different patterns in the data. Regression methods incorporates all these variations in data whereas trend analysis methods study these factors individually.
  • 13.
    SO ,WE KNOWWHAT IT’S ALL ABOUT!!! NOW LETS ANALYSE THE METHODS OF DEMAND FORECASTING.
  • 14.
    2 MAIN CATEGORIESMICROECONOMIC METHODS ( QUANTITATIVE) - involves the prediction of activity of particular firms, branded products, commodities, markets, and industries. - are much more reliable than macroeconomic methods because the dimensionality of factors is lower and often can easily be incorporated into a model. MACROECONOMIC METHODS (QUALITATIVE) - involves the prediction of economic aggregates such as inflation, unemployment, GDP growth, short-term interest rates, and trade flows. - is very difficult because of the complex interdependencies in the overall economic factors
  • 15.
    QUALITATIVE METHODS SURVEYOF BUYERS INTENSIONS EXPERTS OPINION METHOD DELPHI METHOD MARKET EXPERIMENTATION METHOD - COLLECTIVE OPINIONS METHOD QUANTITATIVE METHODS TIME SERIES MODELS - TREND ANALYSIS - MOVING AVERAGES METHODS - EXPONENTIAL SMOOTHING CAUSAL MODELS - REGRESSION MODELS
  • 16.
    BUYERS INTENSION SURVEYFEATURES EMPLOYS SAMPLE SURVEY TECHNIQUES FOR GATHERING DATA. DATA IS COLLECTED FROM END USERS OF GOODS - CONSUMER, PRODUCER,MIXED. DATA PORTRAYS BIASES AND PREFERENCES OF CUSTOMERS. IDEAL FOR SHORT AND MEDIUM TERM DEMAND FORECASTING, IS COST EFFECTIVE AND RELIABLE.
  • 17.
    ADVANTAGES HELPS INAPPROXIMATING FUTURE REQUIREMENTS EVEN WITHOUT PAST DATA. ACCURATE METHOD AS BUYERS NEEDS AND WANTS ARE CLEARLY IDENTIFIED & CATERED TO. MOST EFFECTIVE WAY OF ASSESSING DEMAND FOR NEW FIRMS
  • 18.
    LIMITATIONS People maynot know what they are going to purchase They may report what they want to buy, but not what they are capable of buying Customers may not want to disclose real information Effects of derived demand may make forecasting difficult
  • 19.
    EXPERTS OPINION METHODFEATURES PANEL OF EXPERTS IN SAME FIELD WITH EXPERIENCE & WORKING KNOWLEDGE. COMBINES INPUT FROM KEY INFORMATION SOURCES. EXCHANGE OF IDEAS AND CLAIMS. FINAL DECISION IS BASED ON MAJORITY OR CONSENSUS, REACHED FROM EXPERT’S FORECASTS
  • 20.
    ADVANTAGES CAN BEUNDERTAKEN EASILY WITHOUT THE USE OF ELABORATE STATISTICAL TOOLS. INCORPORATES A VARIETY OF EXTENSIVE OPINIONS FROM EXPERT IN THE FIELD.
  • 21.
    LIMITATIONS JUDGEMENTAL BIASESFOR EXAMPLE Availability heuristic Involves using vivid or accessible events as a basis for the judgment. Law of small numbers People expect information obtained from a small sample to be typical of the larger population
  • 22.
    COMPETATIVE BIASES Overreliance on personal opinions. Possibility of undue influence in certain cases. STATISTICAL INADEQUACY Lack of statistical and quantifiable data or figures to substantiate the forecasts made.
  • 23.
    DELPHI METHOD PANELOF EXPERTS IS SELECTED. ONE CO-ORDINATOR IS CHOSEN BY MEMBERS OF THE JURY ANONYMOUS FORECASTS ARE MADE BY EXPERTS BASED ON A COMMON QUESTIONNAIRE. CO-ORDINATOR RENDERS AN AVERAGE OF ALL FORECASTS MADE TO EACH OF THE MEMBERS.
  • 24.
    3 CONSEQUENCES- DIVERSION,CONSENSUS OR NO AGREEMENT. 2 TO 3 CYCLES ARE UNDERTAKEN. CONVERGENCE AND DIVERSION IS ACCEPTABLE. FORECASTS ARE REVISED UNTIL A CONSENSUS IS REACHED BY ALL.
  • 25.
    ADVANTAGES ELIMINATES NEEDFOR GROUP MEETINGS. ELIMINATES BIASES IN GROUP MEETINGS PARTICIPANTS CAN CHANGE THEIR OPINIONS ANONYMOUSLY.
  • 26.
    LIMITATIONS TIME CONSUMING-REACHING A CONSENSUS TAKES A LOT OF TIME. PARTICIPANTS MAY DROP OUT.
  • 27.
    MARKET EXPERIMENTATION INVOLVESACTUAL EXPERIMENTS & SIMULATIONS. COUPONS ARE ISSUED TO FEW SELECT CUSTOMERS. SELECTED CUSTOMERS PURCHASE THE PRODUCTS. PROXIMITY WITH CONSUMERS MAKES INFORMATION COLLECTED RELIABLE. INFORMATION FROM INTERACTIONS BETWEEN SALES PERSONNEL & CUSTOMERS IS USED FOR FORECASTING. BEST USED IF SALES PERSONNEL ARE HIGHLY SPECIALISED AND WELL TRAINED.
  • 28.
    ADVANTAGES USES KNOWLEDGEOF THOSE CLOSEST TO THE MARKET. HELPS ESTIMATING ACTUAL POTENTIAL FOR FUTURE SALES. PROVIDES FEEDBACK FOR IMPROVING CUSTOMIZING & OFFERING MADE TO CUSTOMERS.
  • 29.
    COLLECTIVE OPINIONS METHODOPINIONS FROM MARKETING & SALES SPECIALISTS ARE COMPILED. 2 TYPES OF TARGETS ESTIMATED- AMBITIOUS TARGETS. CONSERVATIVE TARGETS. COMBINES EXPERTISE OF HIGHER LEVEL MANAGEMENT & SALES EXECUTIVES.
  • 30.
    LIMITATIONS POWER STRUGGLESMAY OCCUR BETWEEN SPECIALISTS. CONSENSUS MAY NOT BE REACHED IN GOOD TIME. DIFFERENCES AND PREJUDICES IN OPINIONS MAY ALSO EXIST.
  • 31.
    “ A REYOU STILL THERE??”
  • 32.
    THAT FINISHES THEQUALITATIVE METHODS. NOW LETS LOOK AT THE “ QUANTITATIVE METHODS”
  • 33.
    TIME SERIES MODELSPast data is used to make future predictions . Known or Independent variables are used for predicting Unknown or dependent variables, using the trend equation- “ Predictive analysis” Based on trend equation, we find ‘ Line of Best Fit’ and then it is projected in a scatter diagram, dividing points equally on both sides TREND ANALYSIS
  • 34.
    TREND EQUATION Y^= a + bX + E Y^ = Estimated value of Y a = Constant or Intercept b = slope of trend line X = independent variable E = Error term
  • 35.
    = EXPLAINED VARIATION1 - = UNEXPLAINED VARIATION Explained variation - means the extent to which the independent variable explains the relative change in the dependent variable. Higher the explained variation, lower the error value leading to accurate forecast
  • 36.
  • 37.
    MOVING AVERAGE METHODData from a number of consecutive past periods is combined to provide forecast for coming periods.Higher the amount of previous data, better is the forecast. Since the averages are calculated on a moving basis, the seasonal and cyclical variations are smoothened out.
  • 38.
    EXPONENTIAL SMOOTHING Usedin cases where the variable under forecast doesn’t follow a trend. 2 Types- Simple and Weighted Simple smoothing- simple average of specific observation called order. Weighted smoothing- weights assigned in decreasing order as one moves from current period observations to previous observations.
  • 39.
    The equation forexponential smoothing follows a Geometric Progression.Values may be written as- a, a (1-a), a(1-a)^2….. a(1-n) where, a = value of weight assigned to the observation a(1-a) = weight assigned to 1 period previous observation a(1-a)^2 = weight assigned to 2 periods previous observation Sum of all weights always equals Unity.
  • 40.
    CASUAL MODELS Itis a statistical technique for quantifying the relationship between variables. In simple regression analysis, there is one dependent variable (e.g. sales) to be forecast and one independent variable. The values of the independent variable are typically those assumed to "cause" or determine the values of the dependent variable. REGRESSION MODEL
  • 41.
    For example Assumingthat the amount of advertising dollars spent on a product determines the amount of its sales, we could use regression analysis to quantify the precise nature of the relationship between advertising and sales. For forecasting purposes, knowing the quantified relationship between the variables allows us to provide forecasting estimates
  • 42.
    STEPS IN REGRESSIONANALYSIS 1.Identification of variables influencing demand for product under estimation. 2.Collection of historical data on variables. 3.Choosing an appropriate form of function 4.Estimation of the function.
  • 43.
    REGRESSION EQUATION Y= Where Y= value being forecasted = constant value = coefficients of regression = independent variable
  • 44.
    HIGHER REVENUES SALESMAXIMIZATION REDUCED INVESTMENTS FOR SAFETY STOCKS IMPROVED PRODUCTION PLANNING EARLY RECOGNITION OF MARKET TRENDS BETTER MARKET POSITIONING IMPROVED CUSTOMER SERVICE LEVELS BENEFITS OF EFFECTIVE DEMAND FORECASTING