Downloaded 774 times

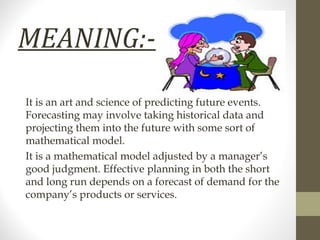
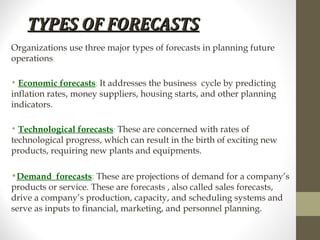


This document discusses various forecasting methods used in operations management. It begins by defining forecasting as predicting future events by taking historical data and projecting it using mathematical models adjusted by managerial judgment. There are three types of forecasts: economic, technological, and demand forecasts which project needs for a company's products. Accurate forecasting is important for human resources, capacity, and supply chain planning. The document then outlines quantitative time series and associative forecasting models as well as qualitative methods like Delphi, educated guesses, surveys, and analogy. It concludes by asking questions about forecasting definitions, accuracy, importance for operations, and long-range demand components.