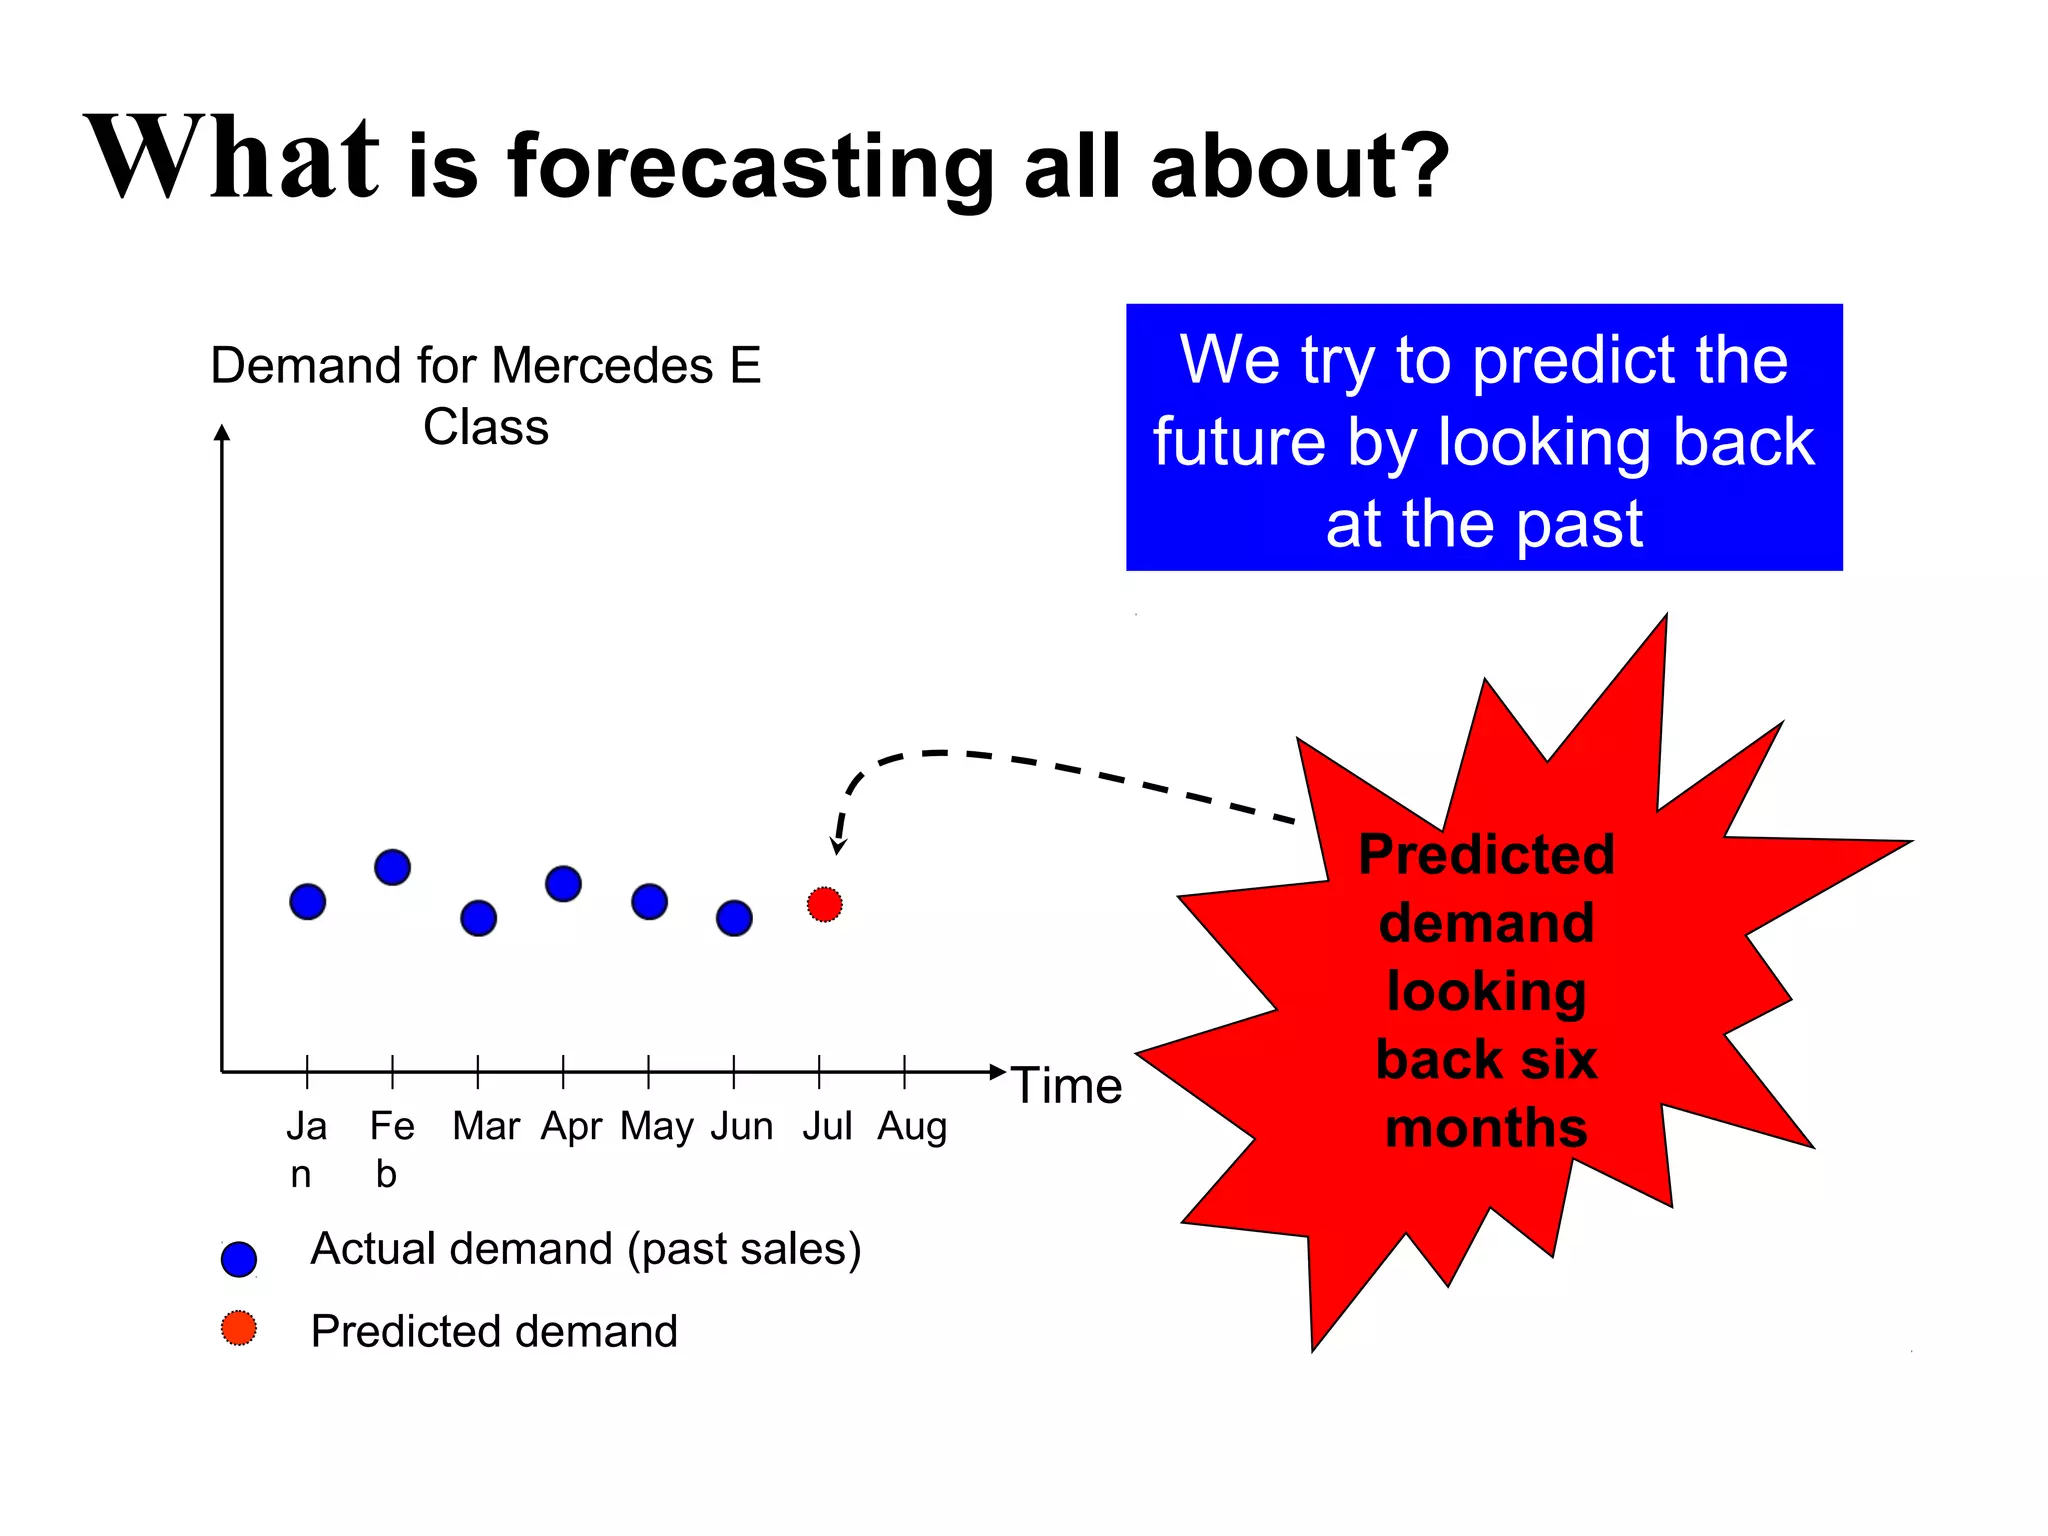
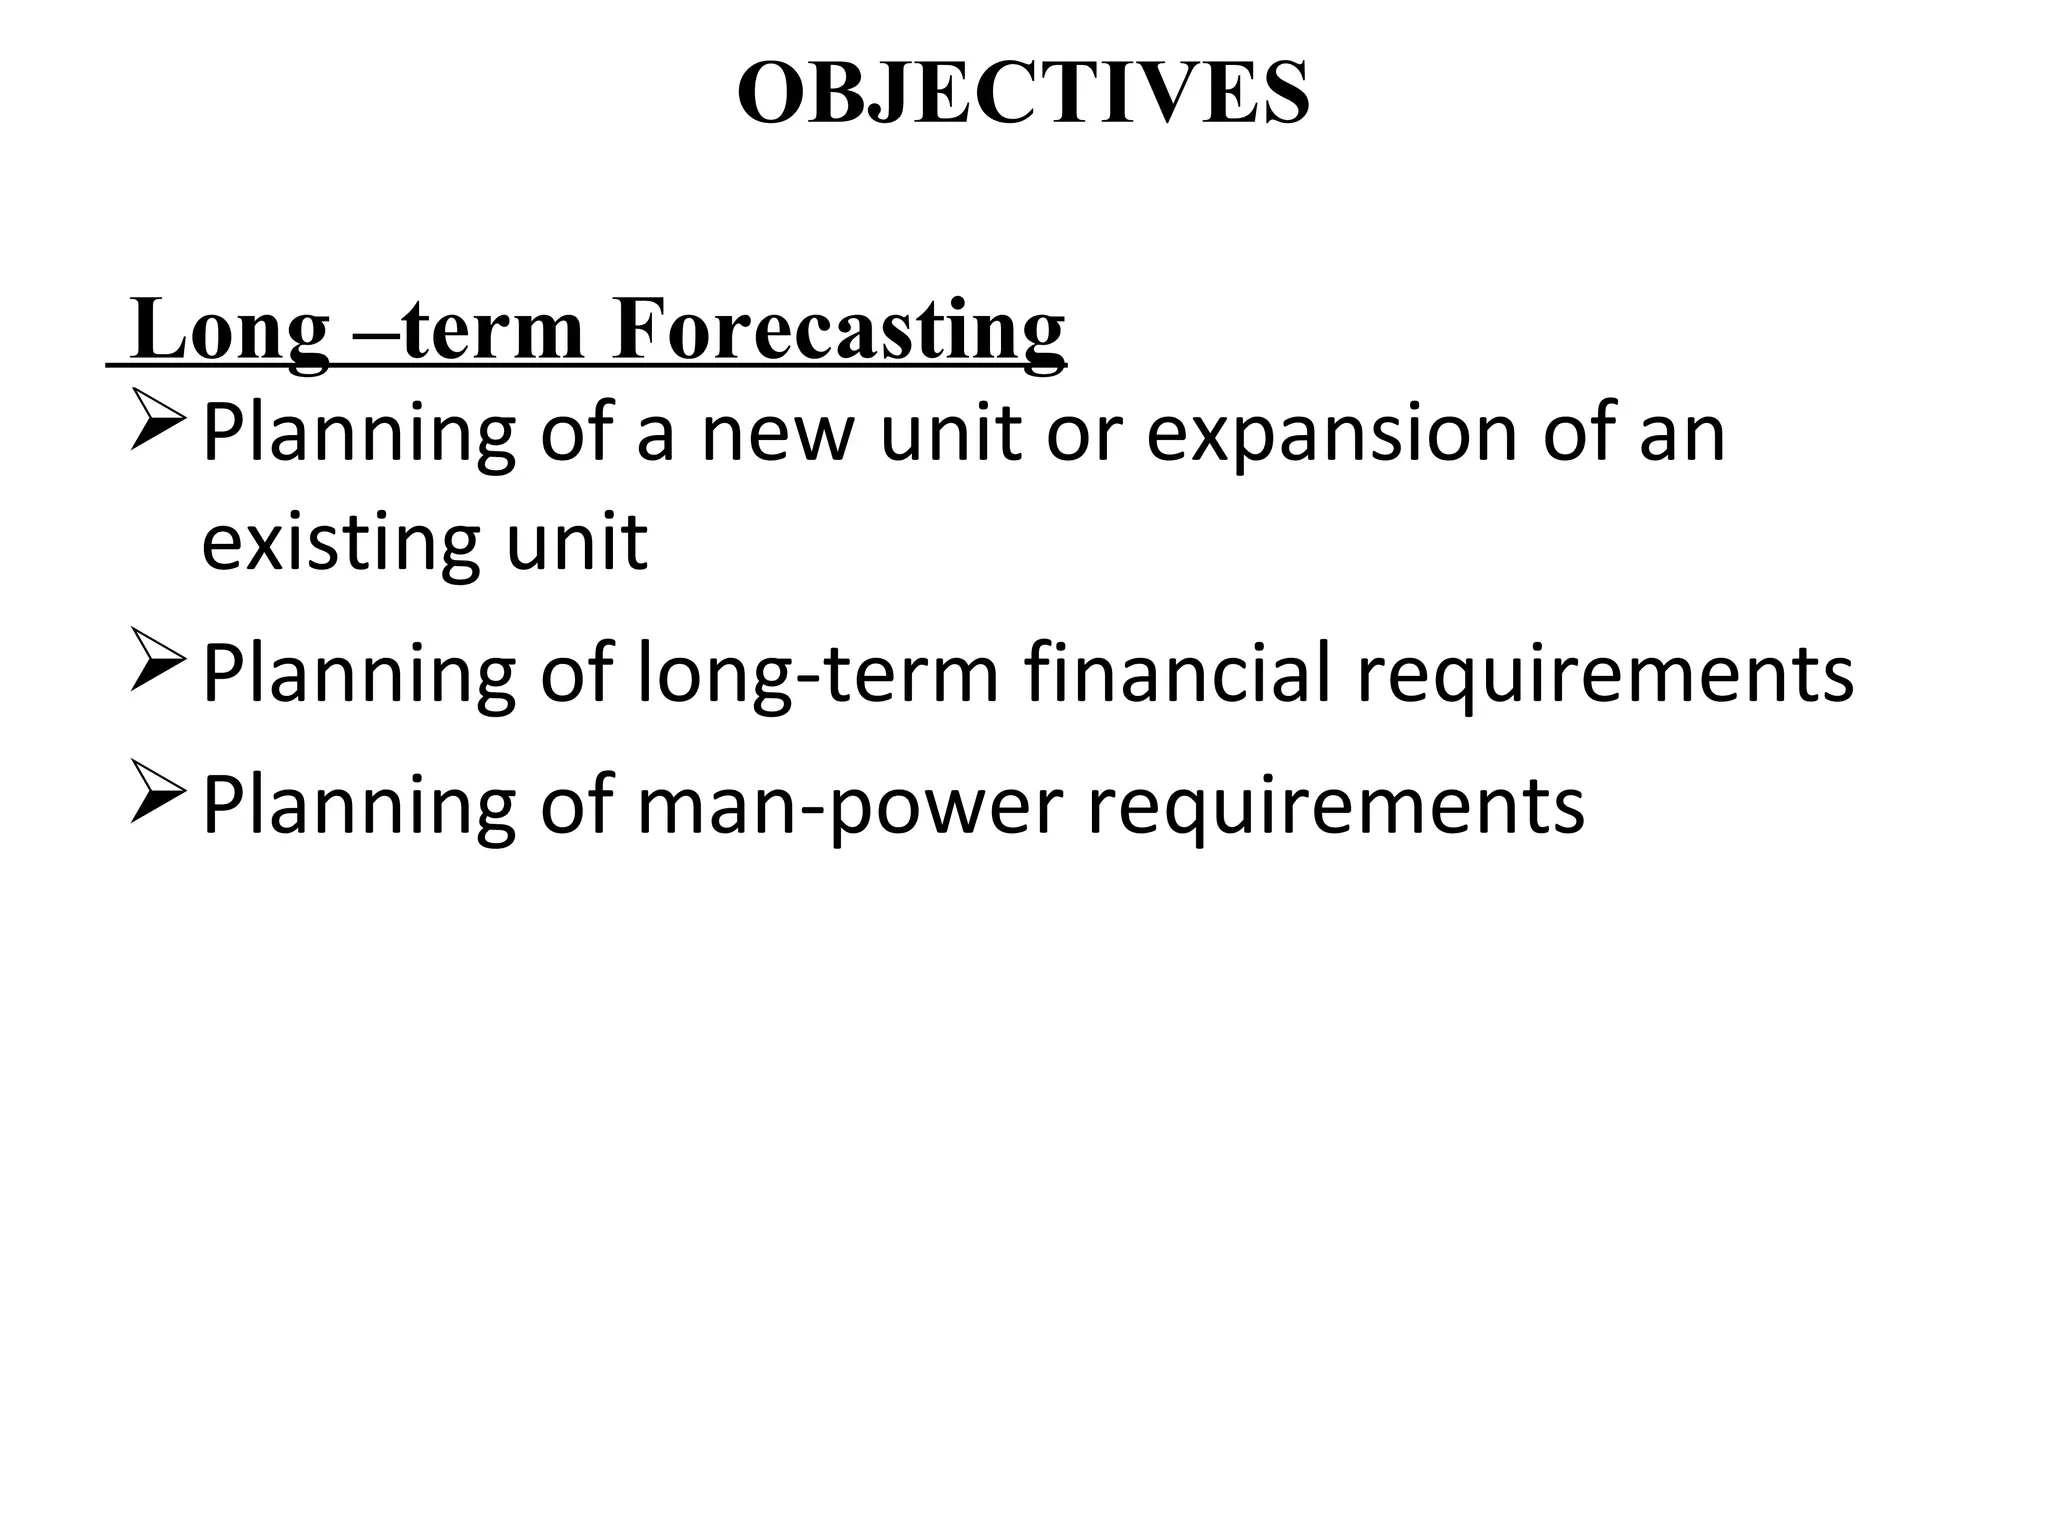
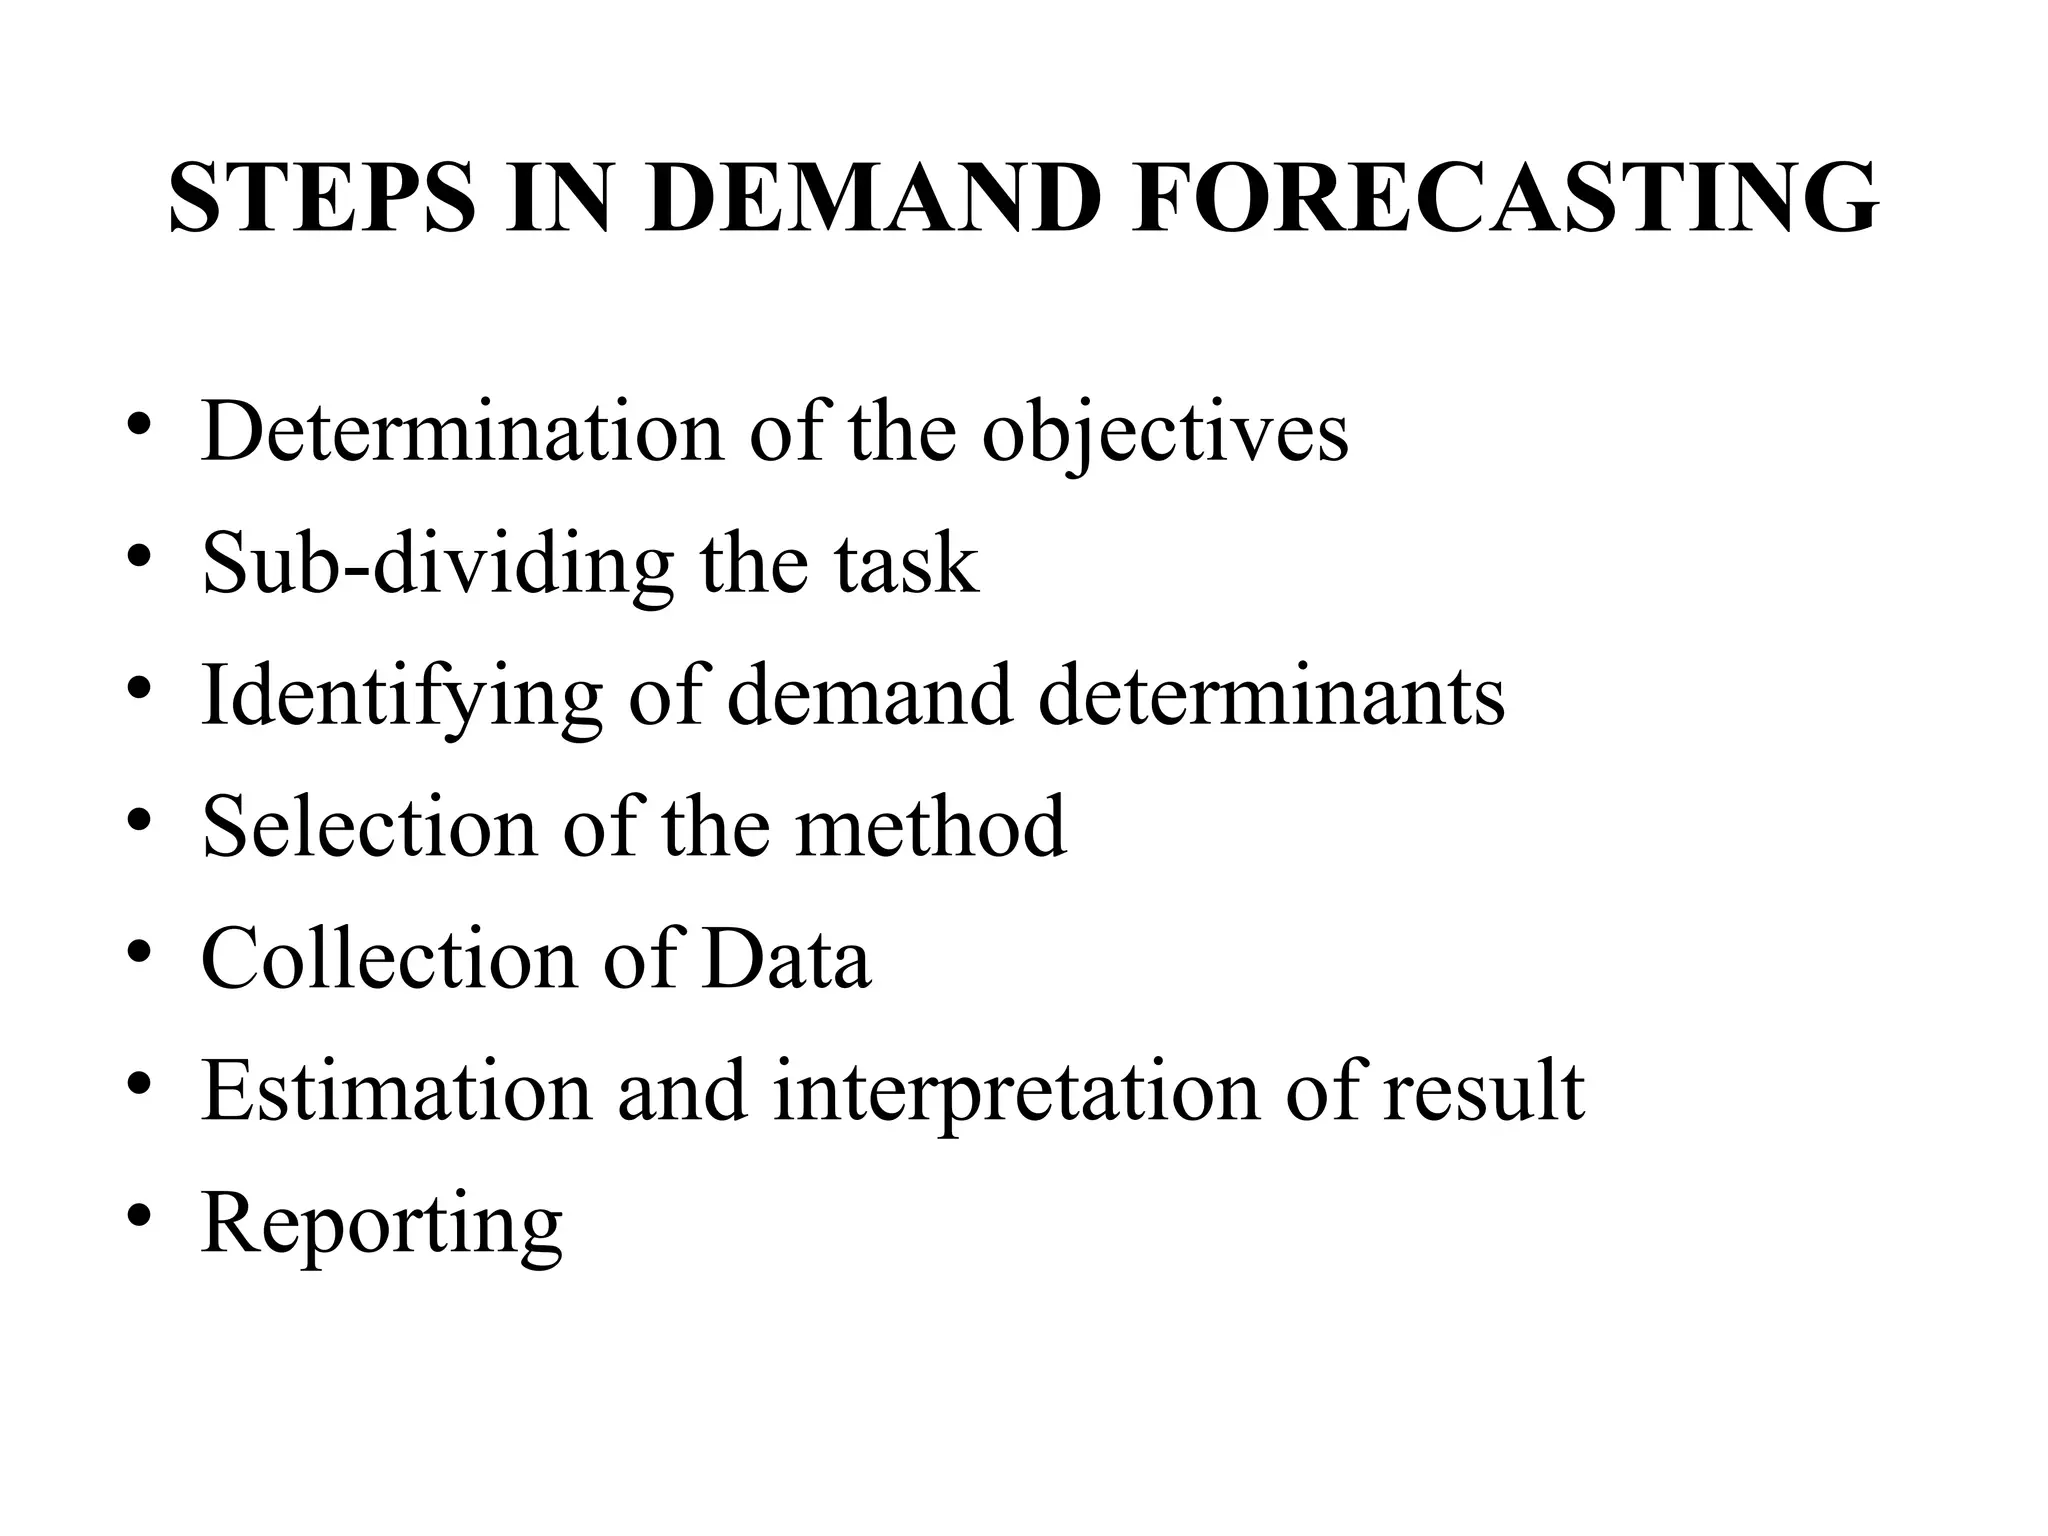
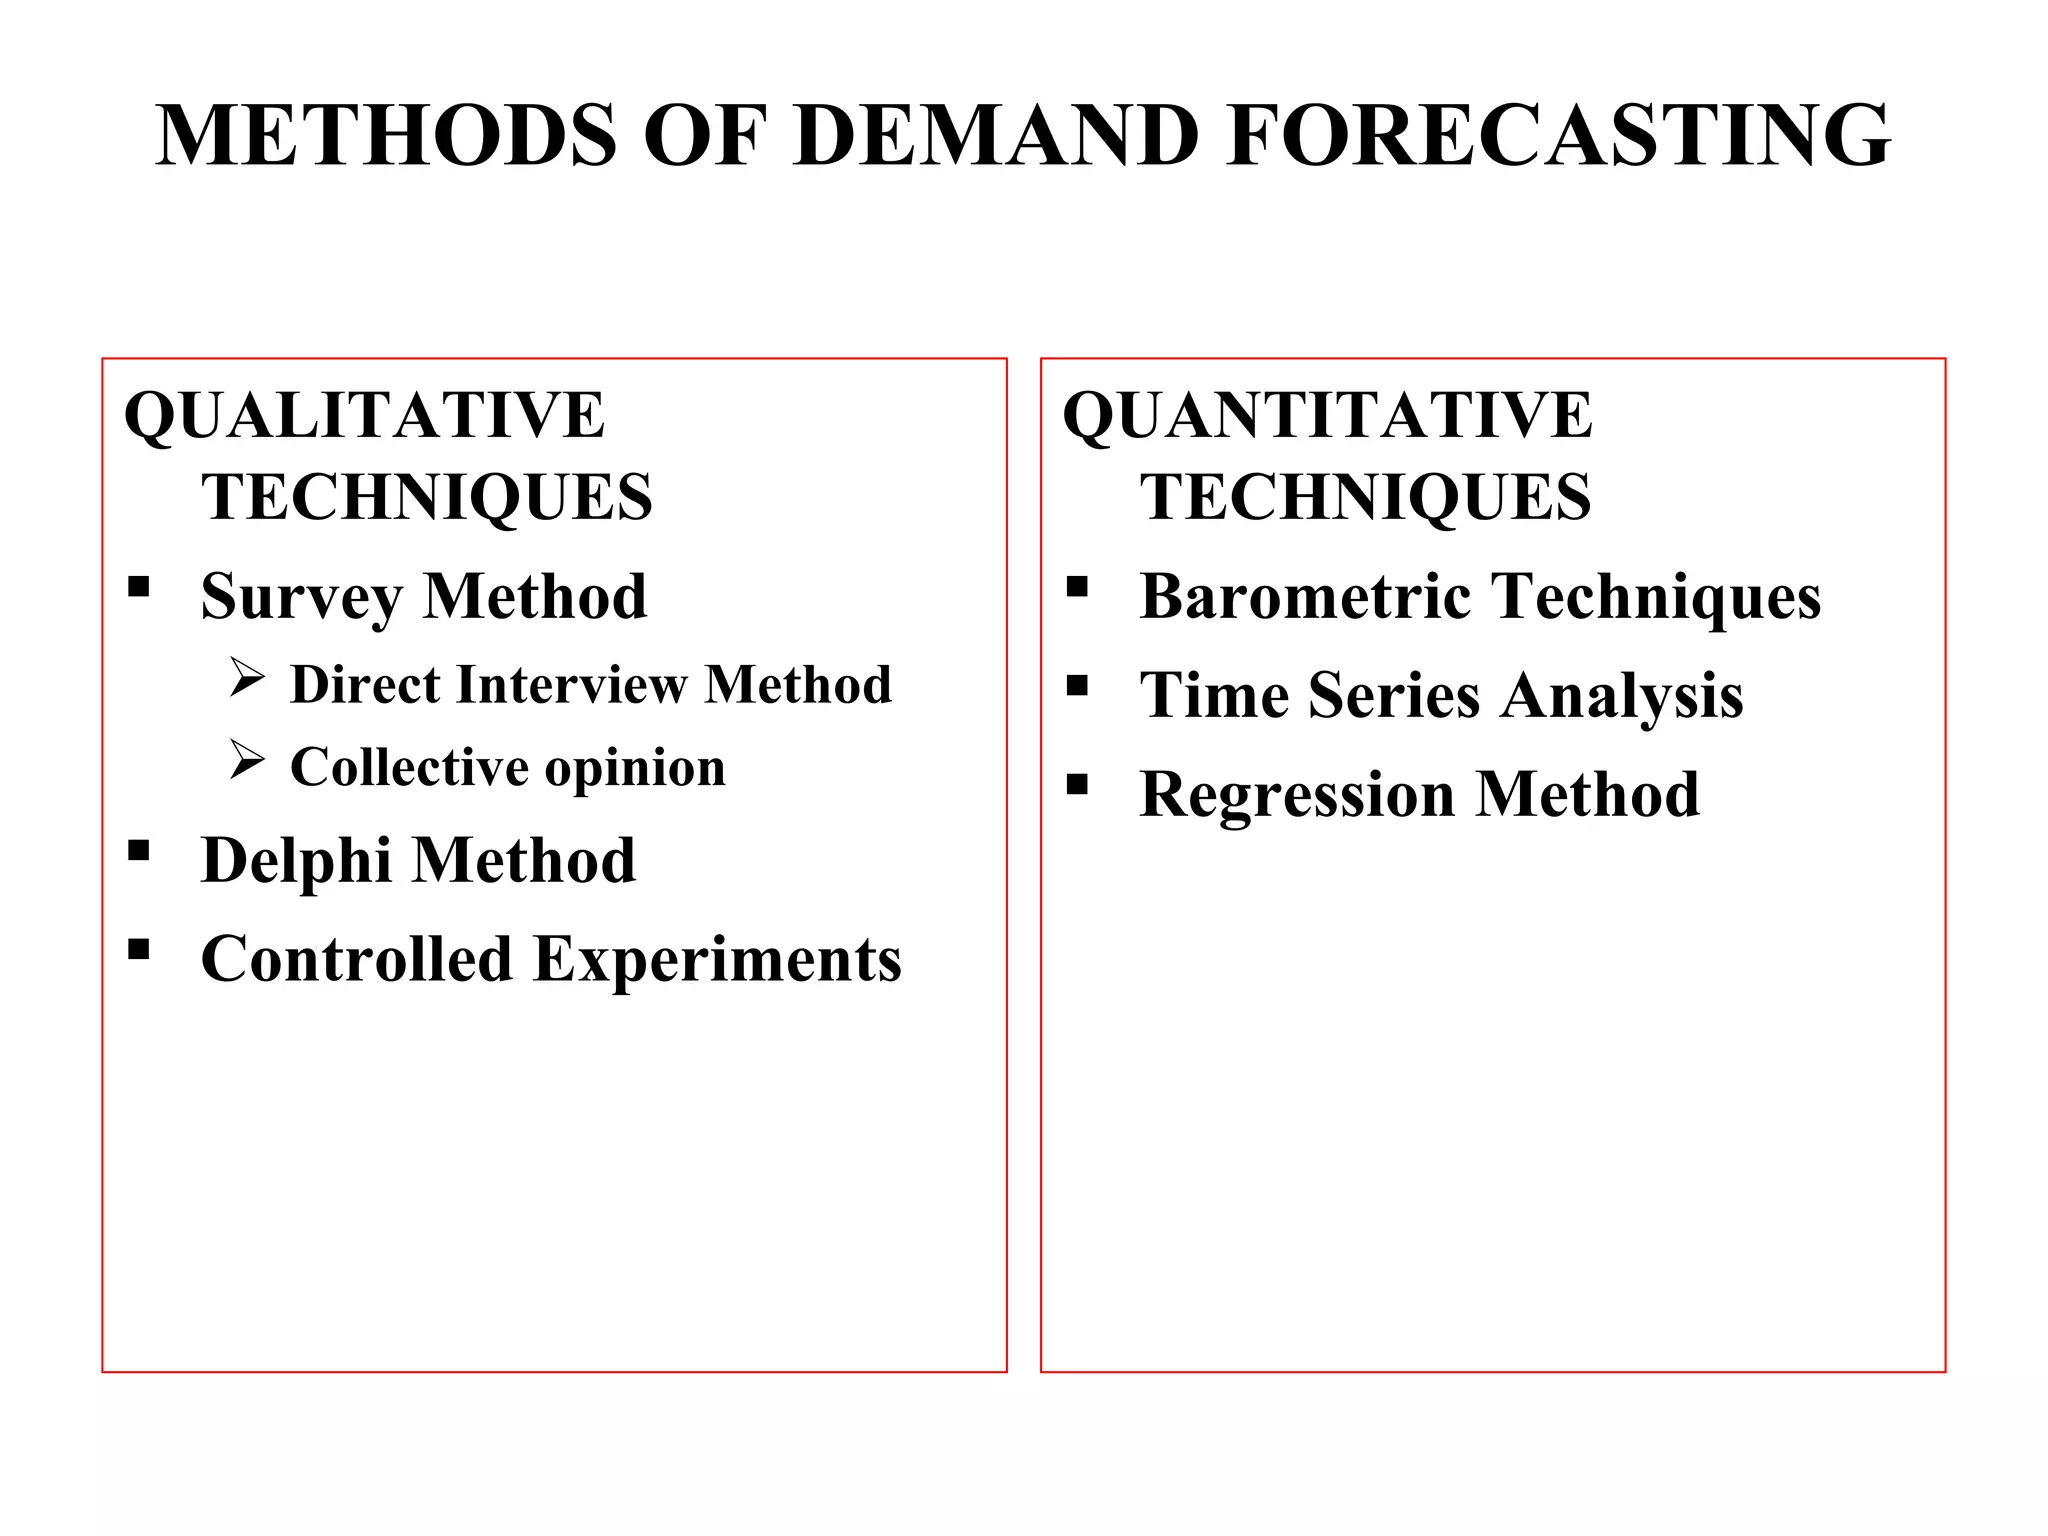
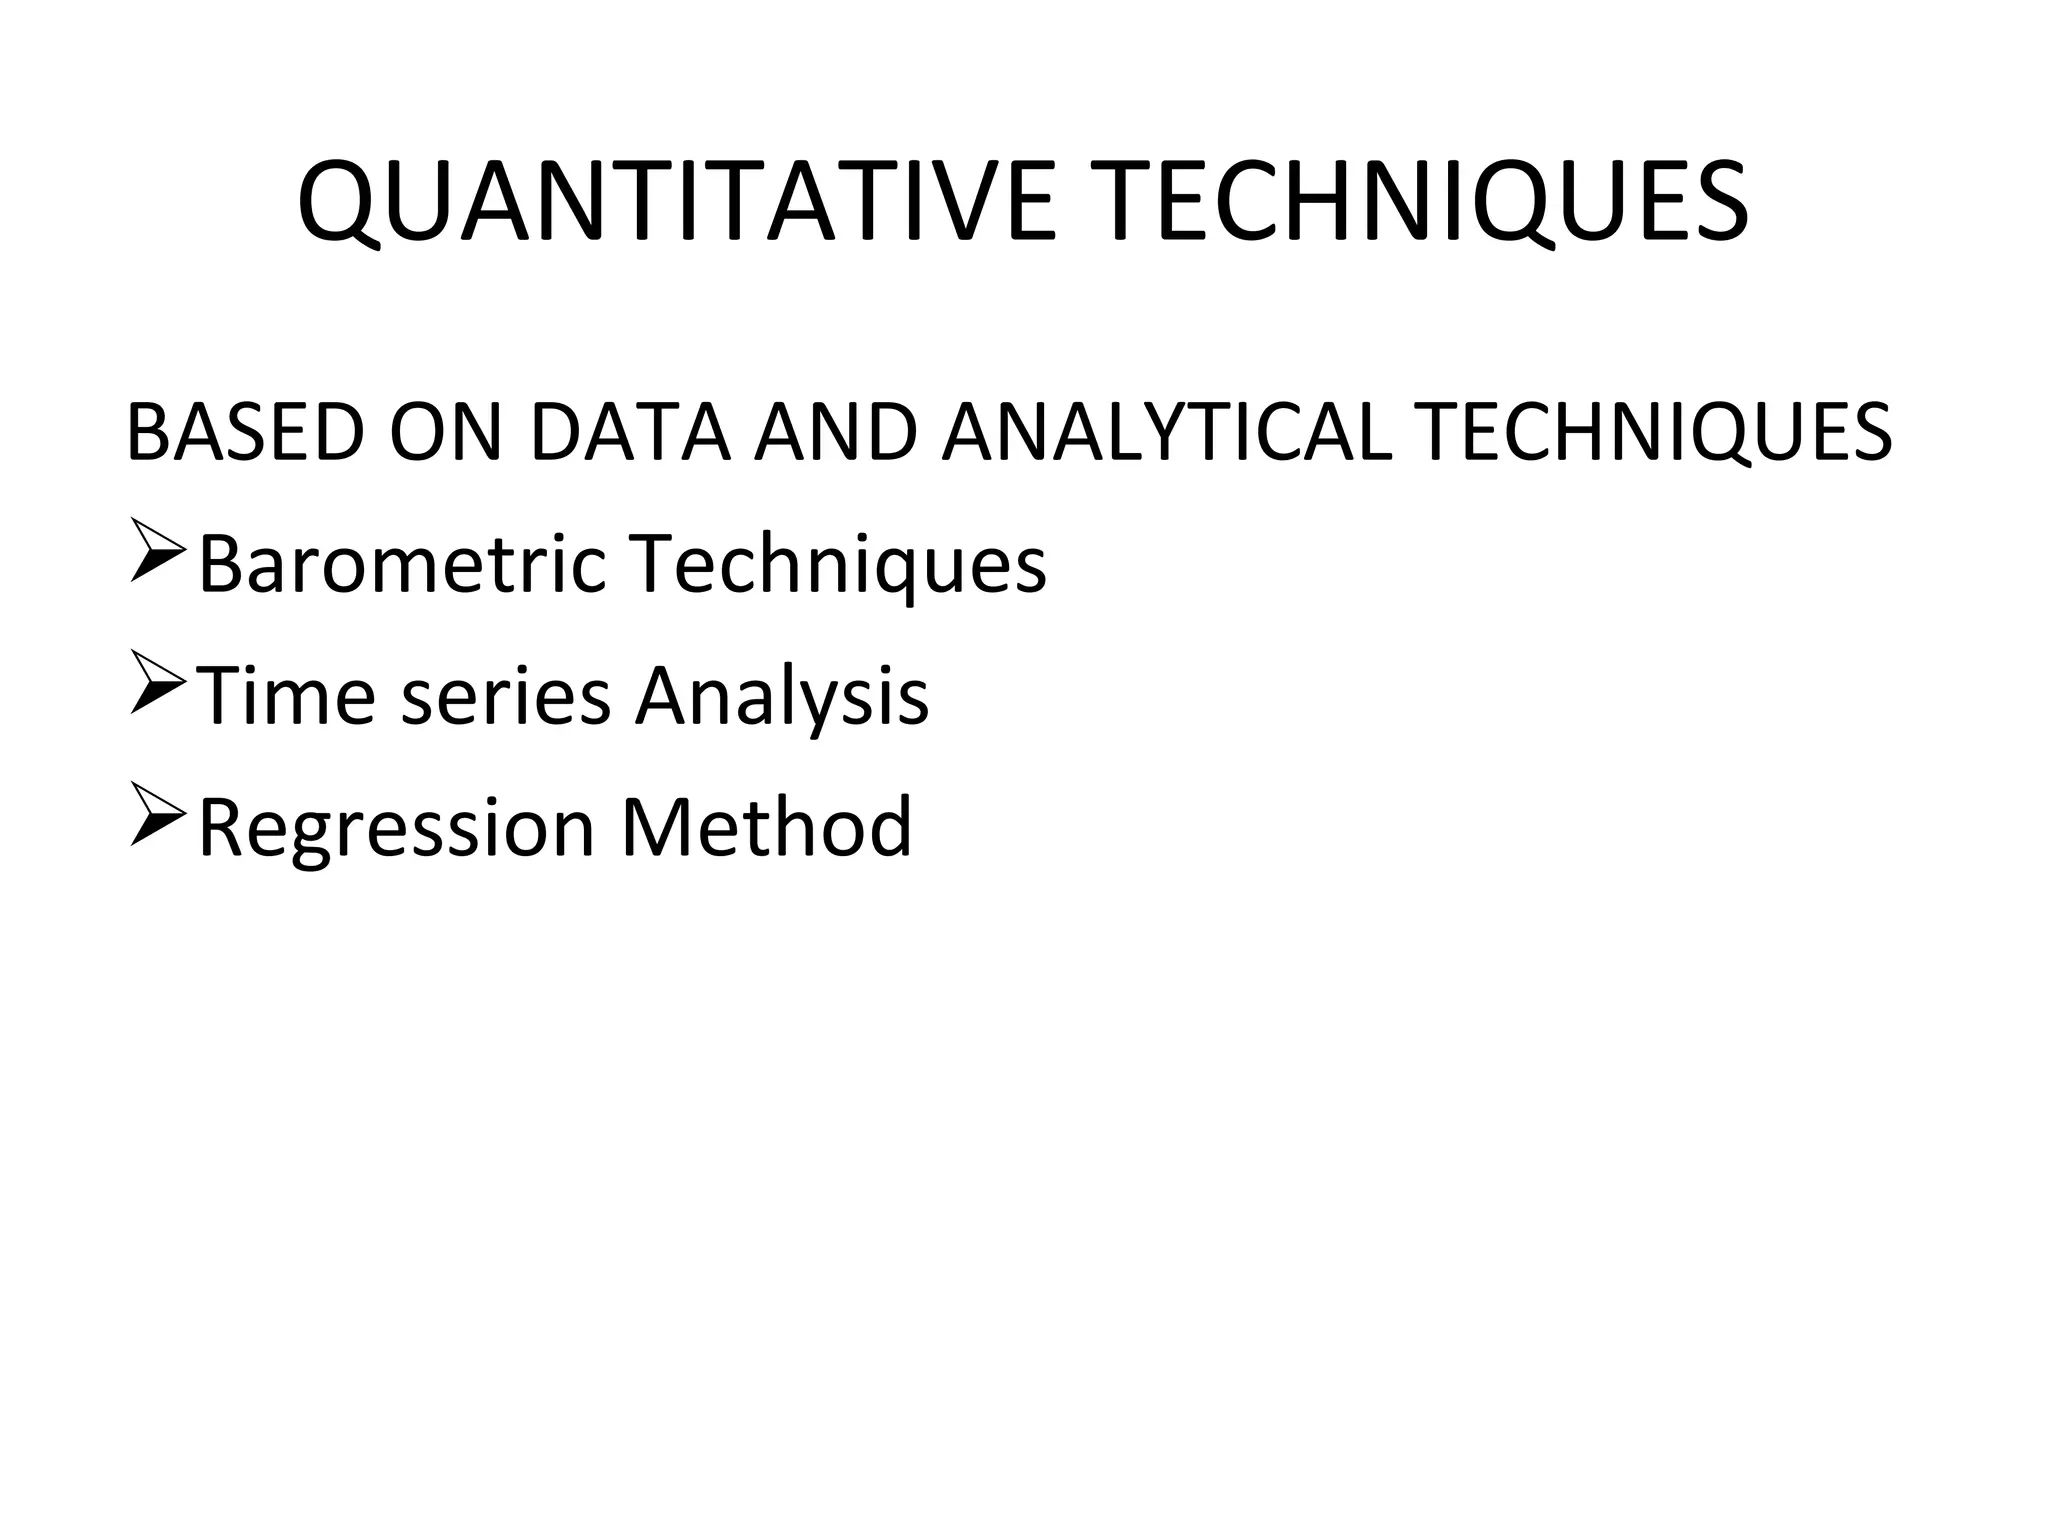
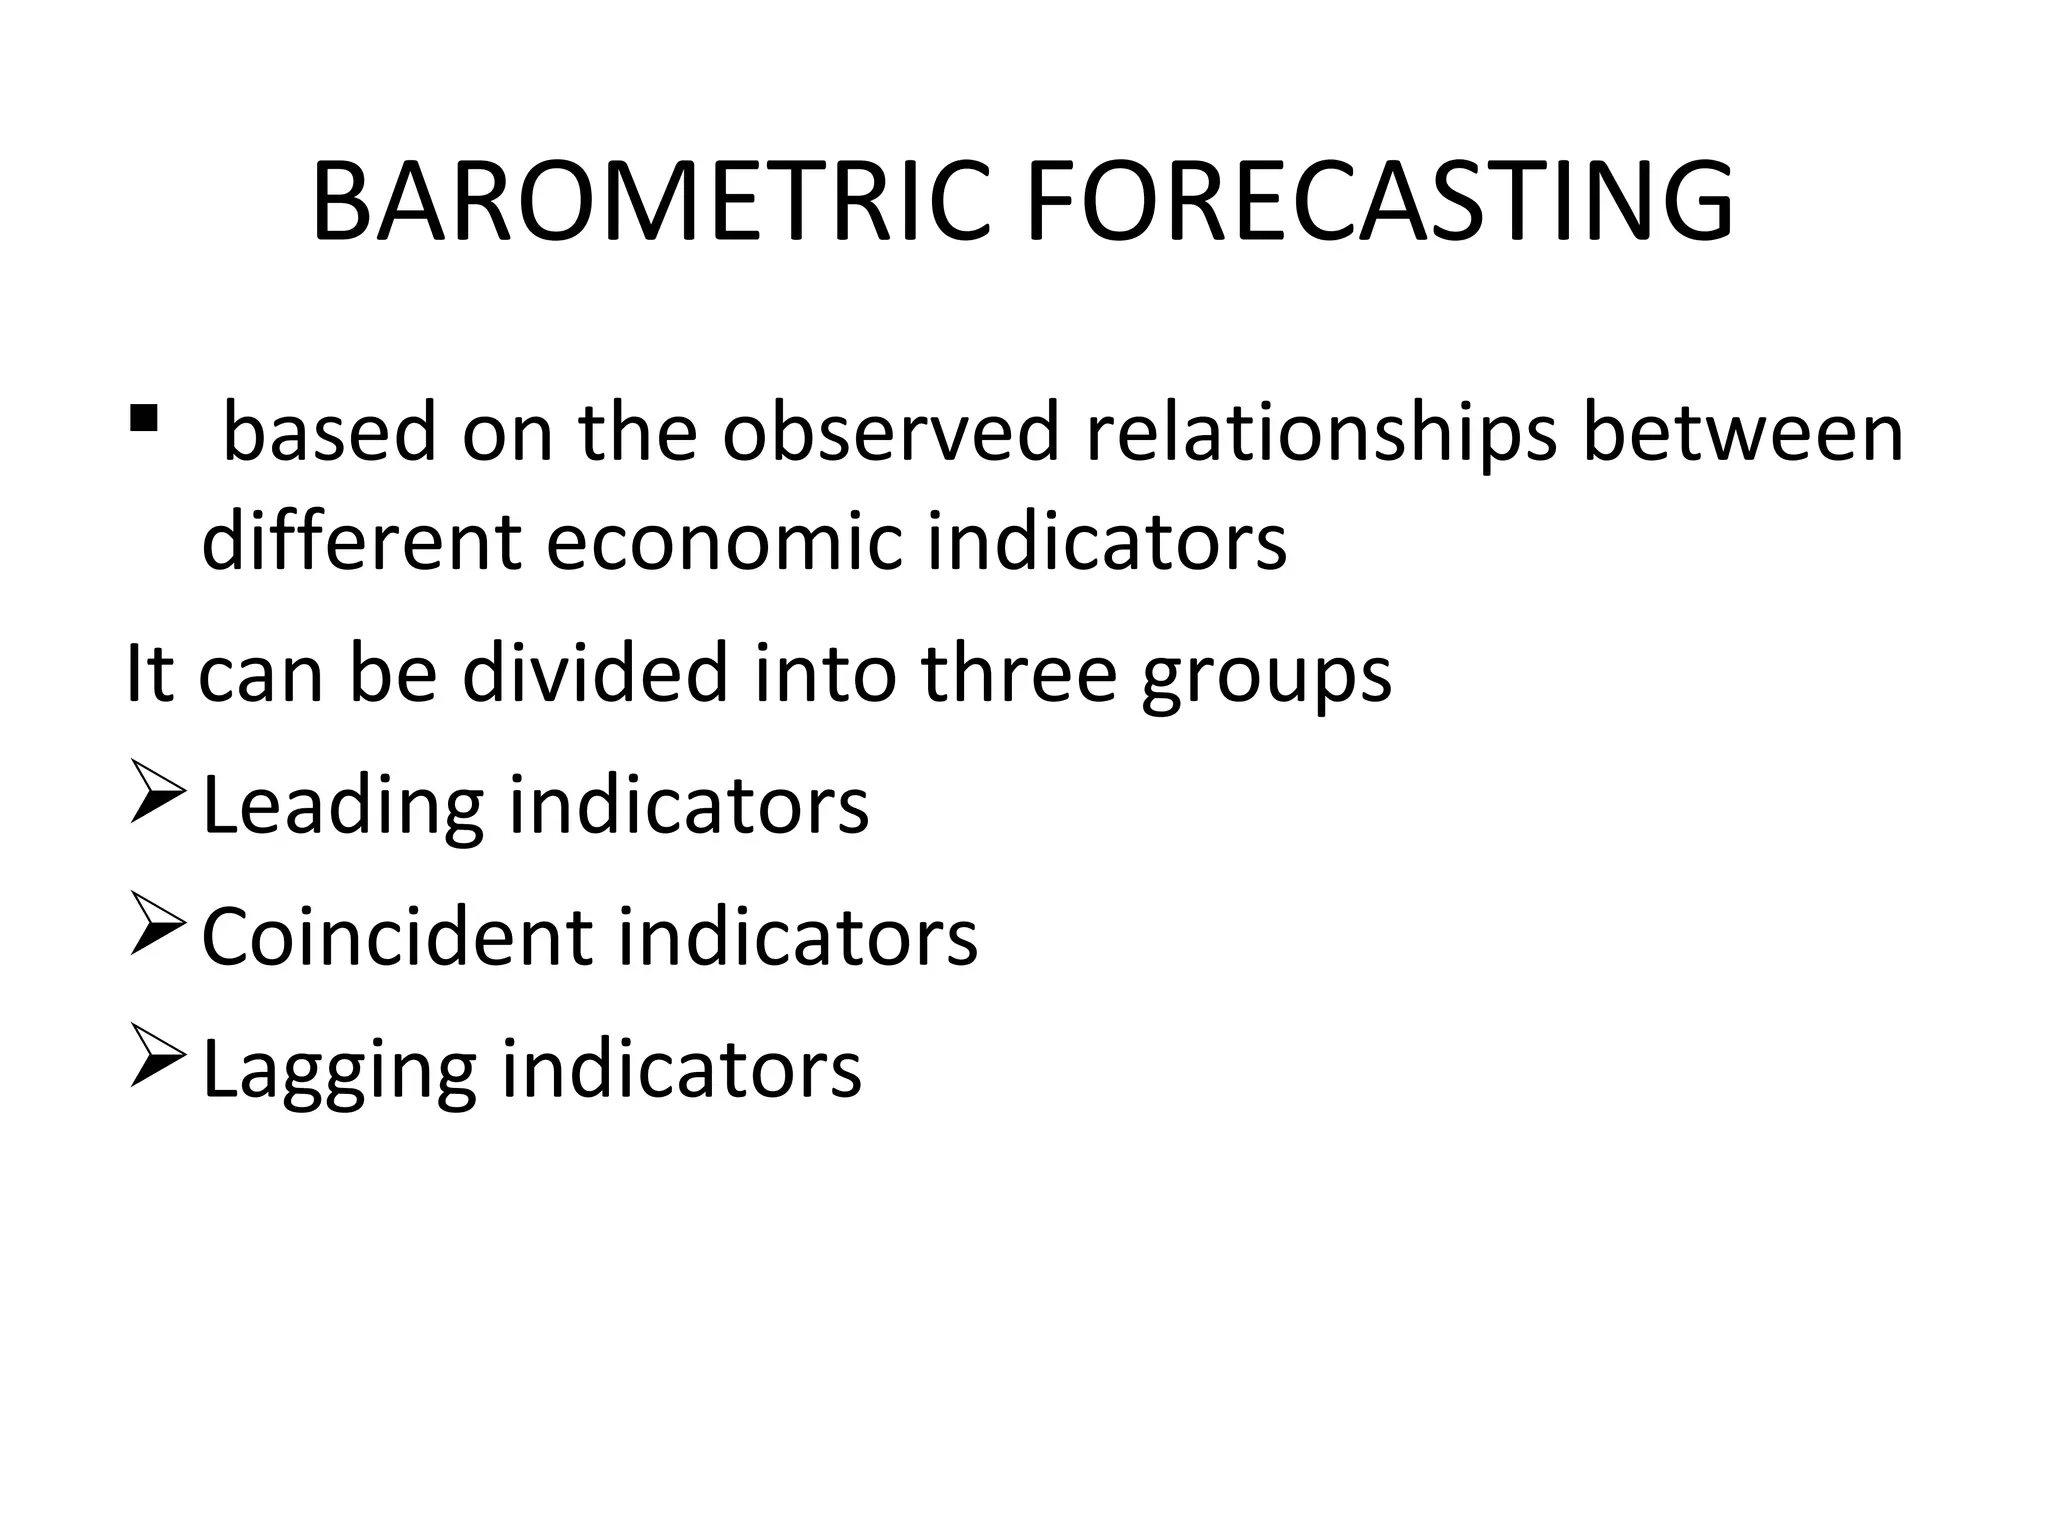
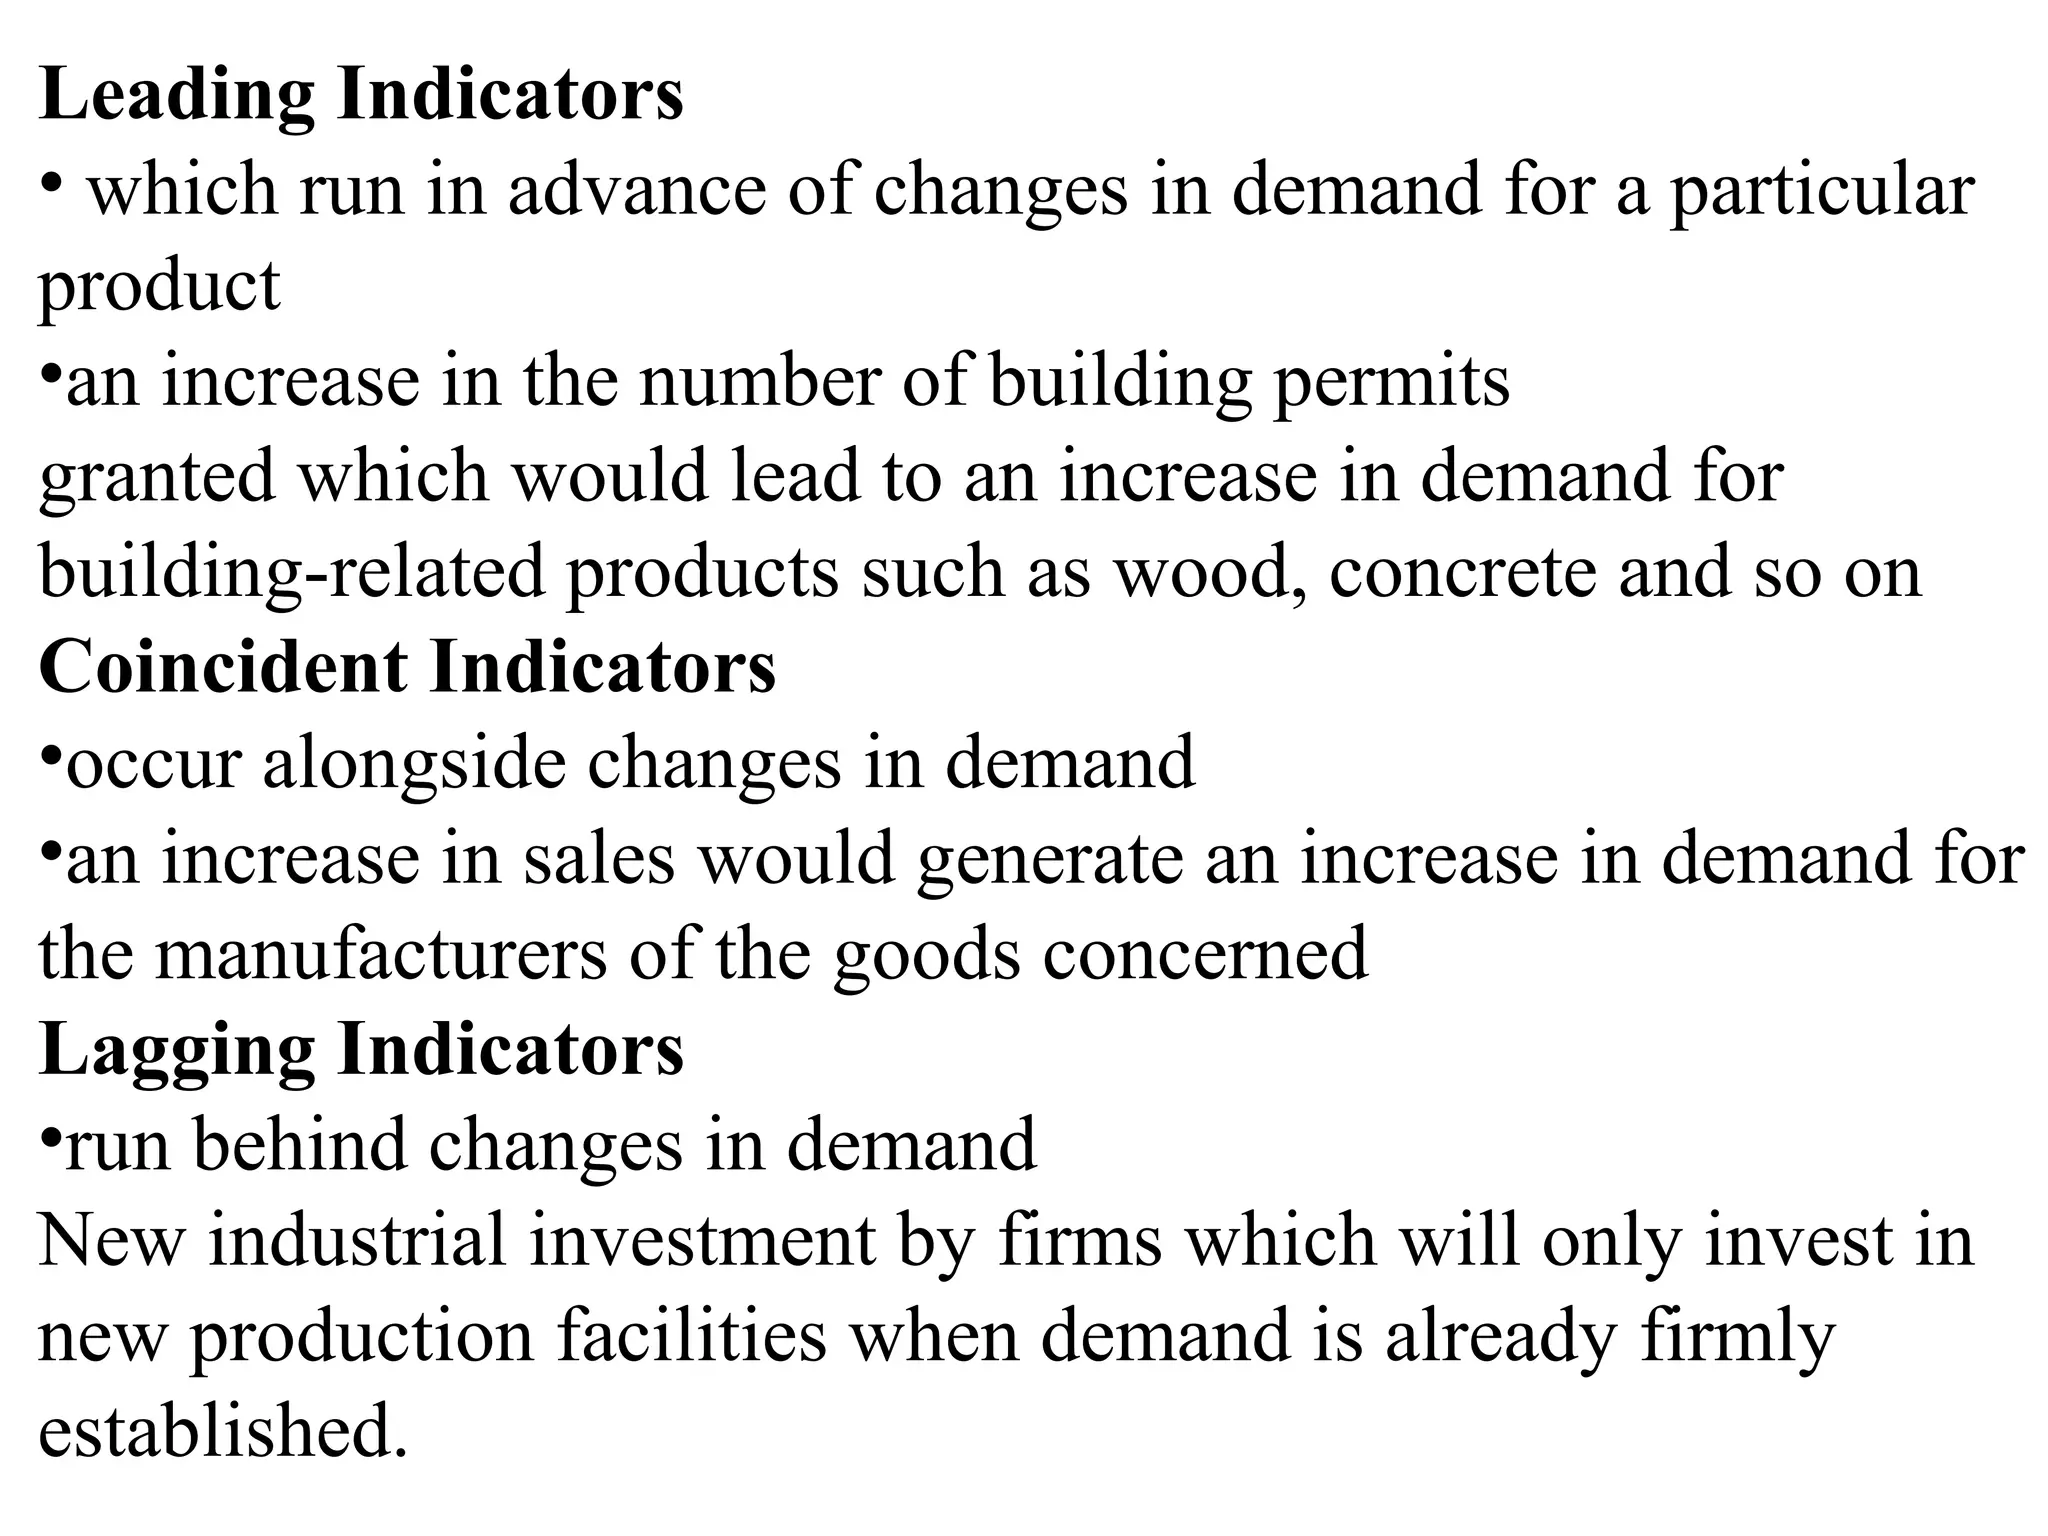
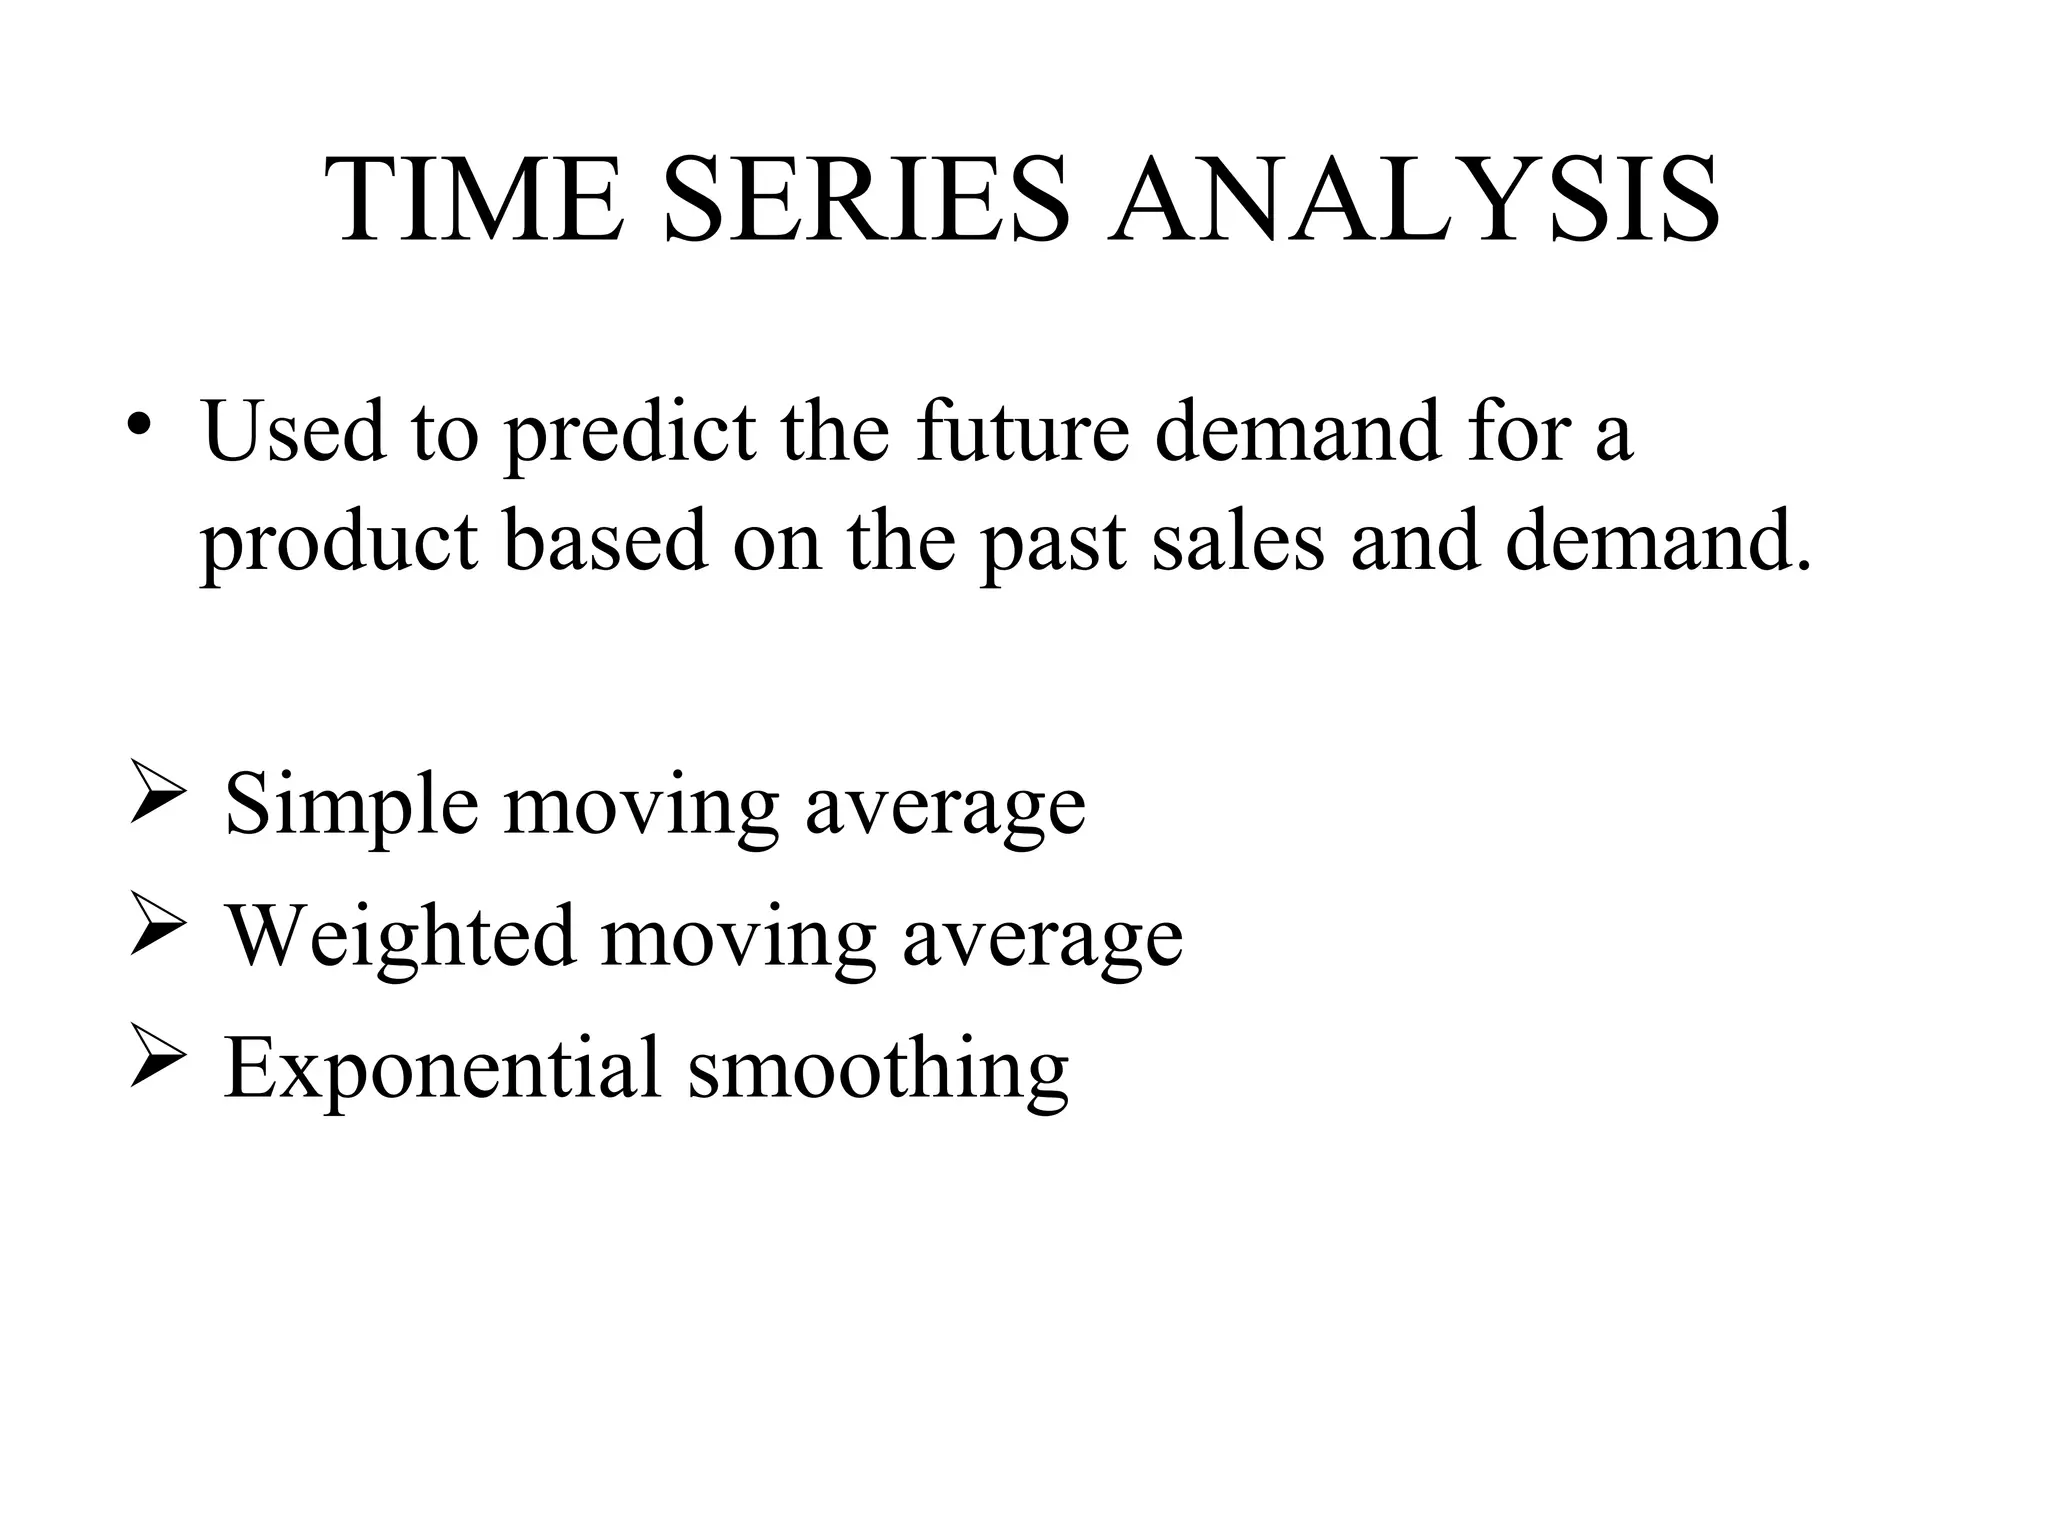
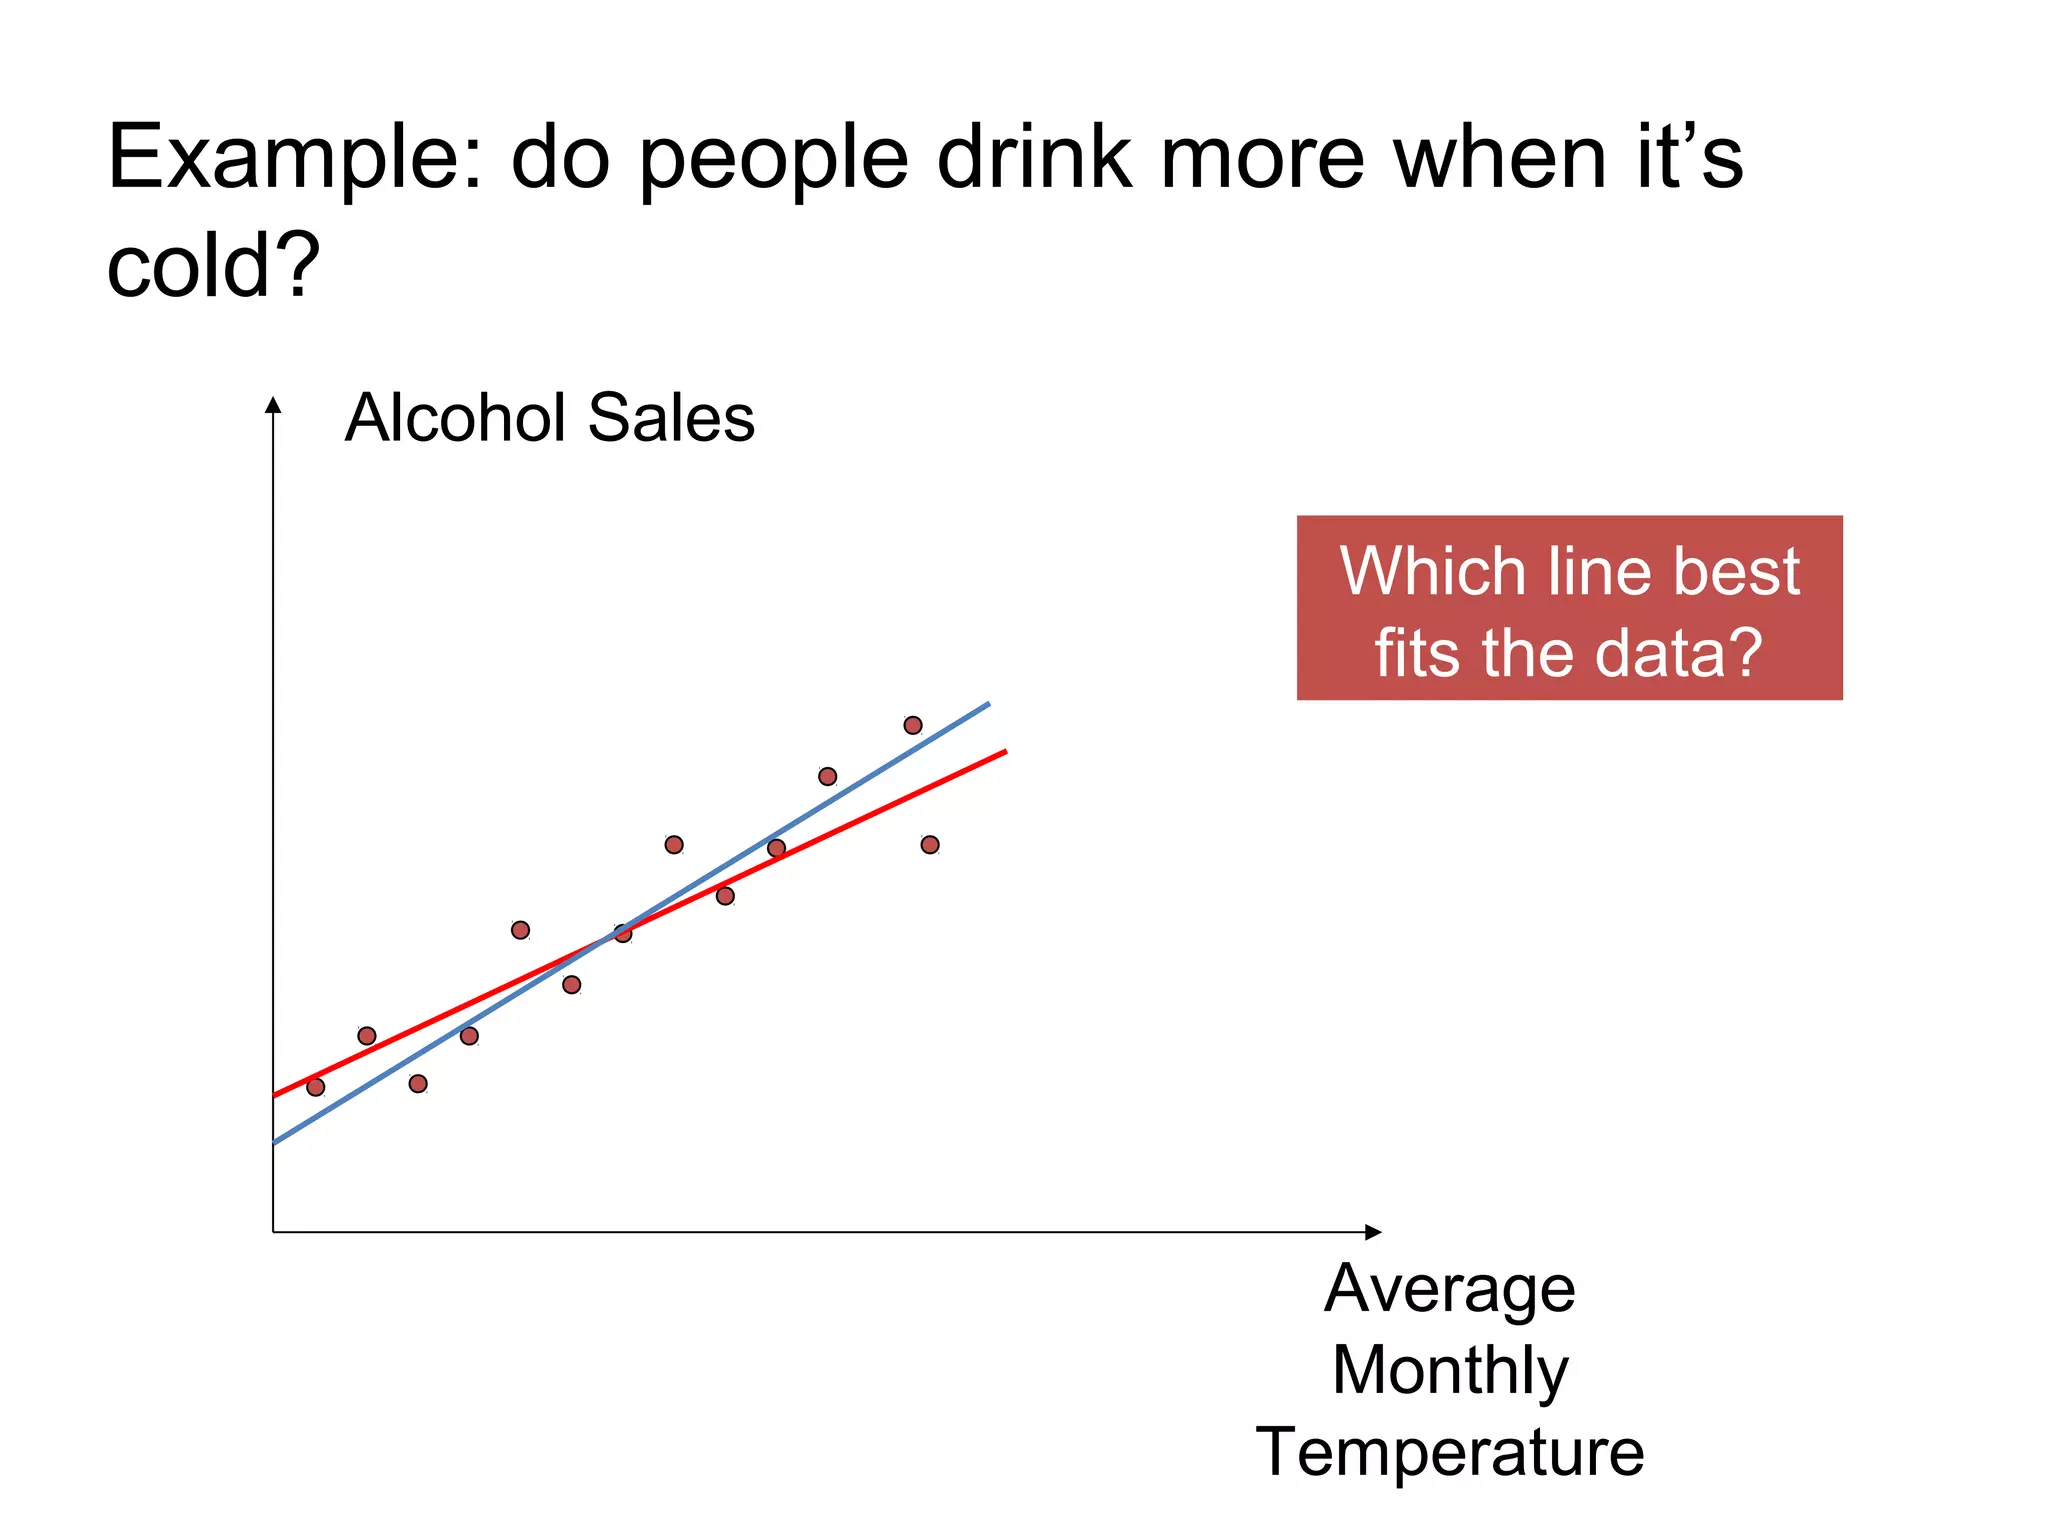
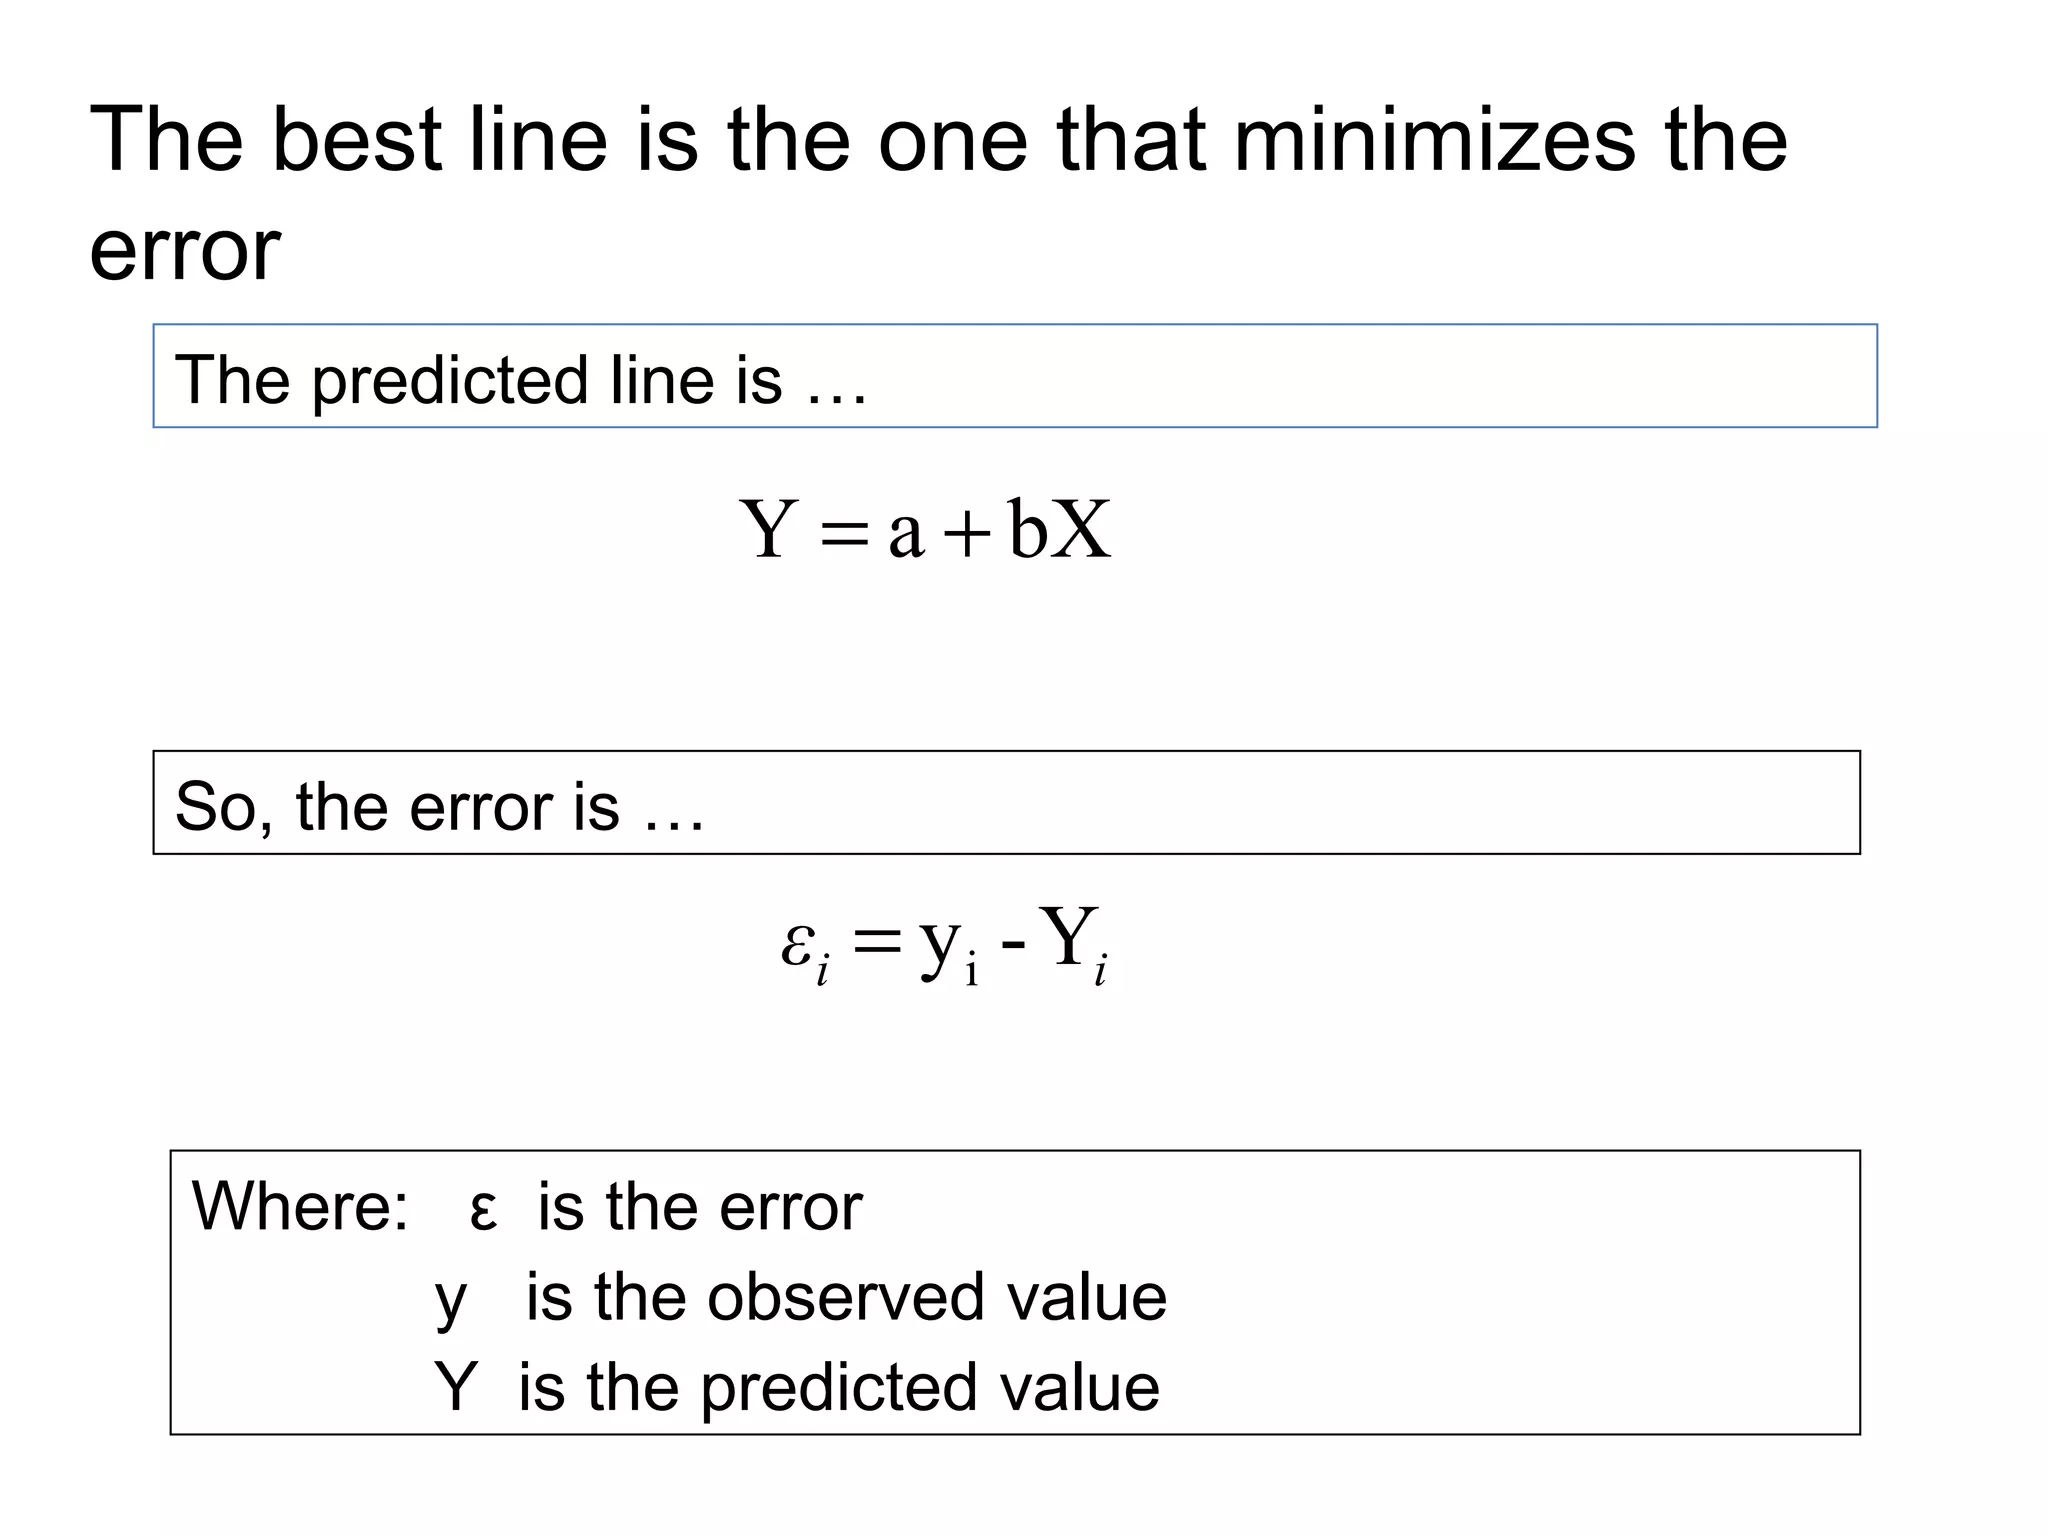
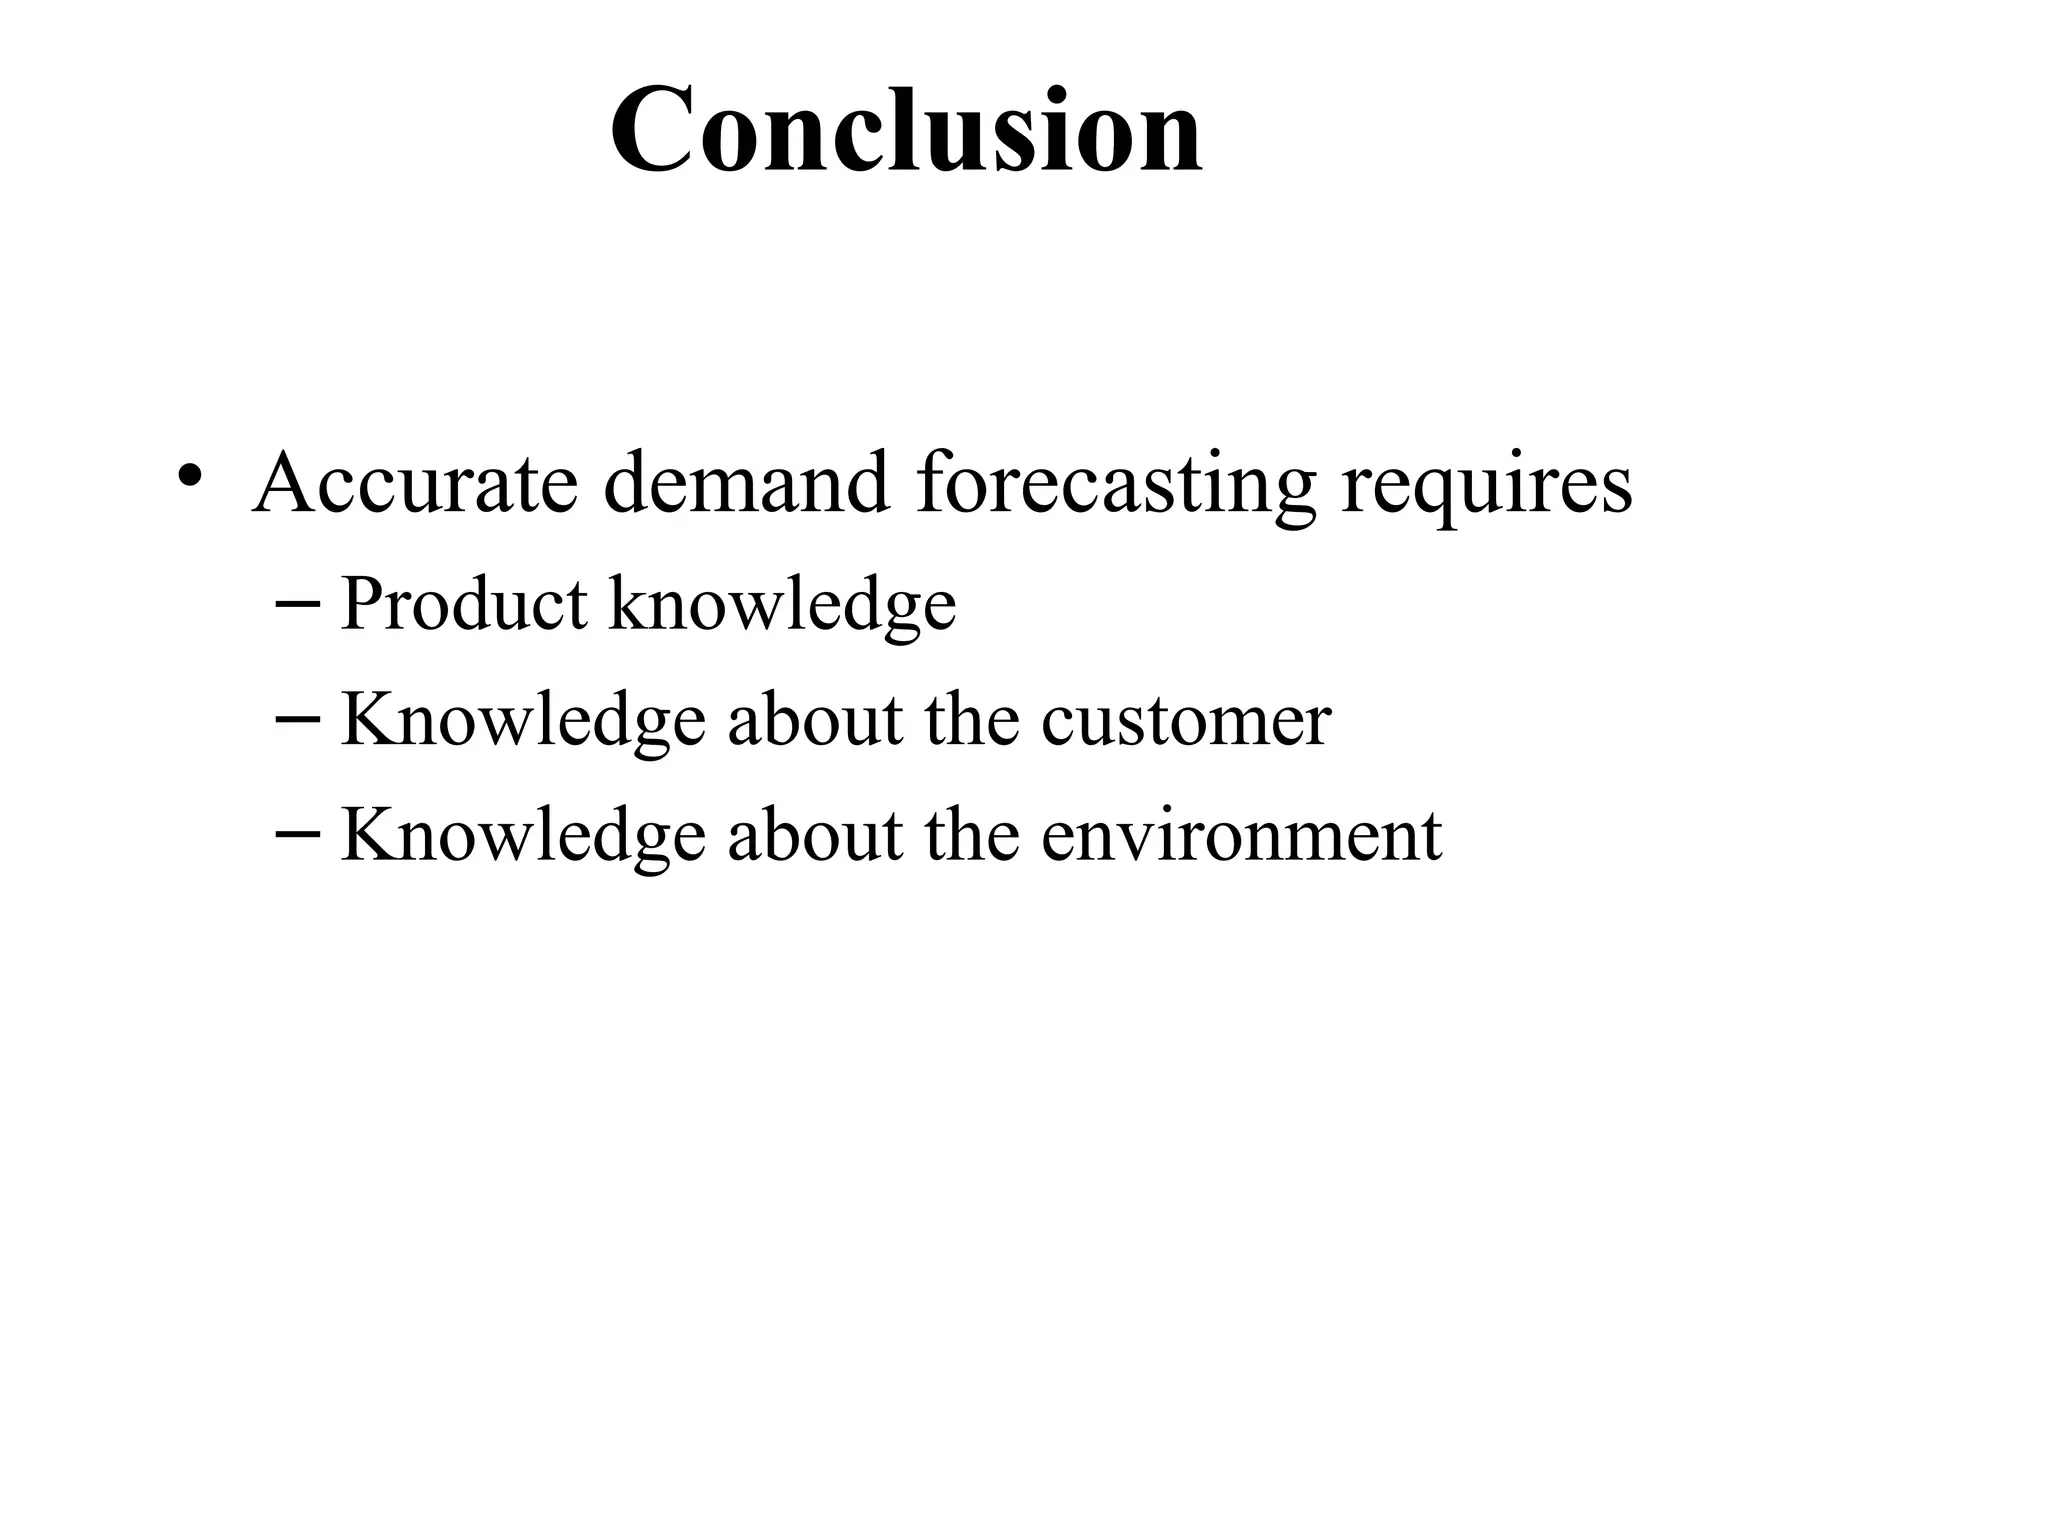
DEMAND FORECASTING
MEANING

IMPORTANTS

OBJECTIVES

METHODS
What is forecasting all about?
  Demand for Mercedes E                       We try to predict the
         Class                               future by looking back
                                                   at the past


                                                   Predicted
                                                    demand
                                                    looking
                                      Time         back six
    Ja   Fe Mar Apr May Jun Jul Aug                 months
    n    b
     Actual demand (past sales)
     Predicted demand
WHY DEMAND FORECASTING

•   Planning and scheduling production
•   Acquiring inputs
•   Making provisions for finances
•   Formulating pricing strategy
•   Planning Advertisement
OBJECTIVES

Short –term Forecasting

To evolve a suitable production policy
To reduce the cost of purchase
To determine appropriate price policy
To set sales targets and establish control
To forecast short-term financial
 requirements
OBJECTIVES

Long –term Forecasting
 Planning of a new unit or expansion of an
  existing unit
 Planning of long-term financial requirements
 Planning of man-power requirements
Levels of Forecasting
• Macro level
• Industry level
• Micro level
STEPS IN DEMAND FORECASTING

•   Determination of the objectives
•   Sub-dividing the task
•   Identifying of demand determinants
•   Selection of the method
•   Collection of Data
•   Estimation and interpretation of result
•   Reporting
METHODS OF DEMAND FORECASTING

QUALITATIVE                    QUANTITATIVE
  TECHNIQUES                     TECHNIQUES
 Survey Method                 Barometric Techniques
    Direct Interview Method    Time Series Analysis
    Collective opinion
                                Regression Method
 Delphi Method
 Controlled Experiments
SURVEY METHOD
• Surveys are conducted to collect information
  about the future plans of the potential
  consumers
• A firm may launch a new product, if the suvey
  indicates that there is a demand for that
  particular product in the market.
Direct Interview Method
Consumers are contacted directly to ask them what they
intend to buy in future
Collective opinion
The opinions of those who have the feel of the market, like
salesman, professional experts, market consultants etc.
Advantages
•Simple
•Quick
•Low cost
•Reliable
Disadvantages
Personal judgements may go wrong
Useful only foe short-term forecasting
DELPHI METHOD

• Applied to uncertain areas where past data or future
  data are not of much use
• Some expert in an area will be contacted with
  questionnaires
• A co-ordinator collect all the opinions
• Each expert will be supplied with responses of other
  experts without revealing their identity
• Expert may revise his opinion, if needed
• Process will be repeated so that all experts come to
  an agreement
CONTROLLED EXPERIMENTS
• Studies and experiments in consumers
  behavior are carried out under actual market
  conditions
• Three or four cities having similarity in
  population , income level, cultural and social
  background ,occupational distribution , taste
  etc.. are chosen
• Various demand determinants like price,
  advertisement , expenditure etc are changed
  one by one and these changes on demand are
  observed
QUANTITATIVE TECHNIQUES
BASED ON DATA AND ANALYTICAL TECHNIQUES
Barometric Techniques
Time series Analysis
Regression Method
BAROMETRIC FORECASTING
 based on the observed relationships between
   different economic indicators
It can be divided into three groups
 Leading indicators
 Coincident indicators
 Lagging indicators
Leading Indicators
• which run in advance of changes in demand for a particular
product
•an increase in the number of building permits
granted which would lead to an increase in demand for
building-related products such as wood, concrete and so on
Coincident Indicators
•occur alongside changes in demand
•an increase in sales would generate an increase in demand for
the manufacturers of the goods concerned
Lagging Indicators
•run behind changes in demand
New industrial investment by firms which will only invest in
new production facilities when demand is already firmly
established.
TIME SERIES ANALYSIS
• Used to predict the future demand for a
  product based on the past sales and demand.

 Simple moving average
 Weighted moving average
 Exponential smoothing
Time series: simple moving average

In the simple moving average models the forecast value is


                       At + At-1 + … + At-n
                Ft+1 =
                                 n


   t    is the current period.
   Ft+1 is the forecast for next period
   n is the forecasting horizon (how far back we
   look),
   A    is the actual sales figure from each period.
Example: forecasting sales at Kroger

Kroger sells (among other stuff) bottled spring water


    Month          Bottles
     Jan            1,325
     Feb            1,353                  What will
     Mar            1,305                  the sales
     Apr            1,275                    be for
     May            1,210                    July?
     Jun            1,195
      Jul             ?
What if we use a 3-month simple moving average?


                         AJun + AMay + AApr
                FJul =                        = 1,227
                                 3


What if we use a 5-month simple moving average?


                 AJun + AMay + AApr + AMar + AFeb
       FJul =                                       = 1,268
                                 5
Time series: weighted moving average
We may want to give more importance to some of the
data…

             Ft+1 = wt At + wt-1 At-1 + … + wt-n At-n


                      wt + wt-1 + … + wt-n = 1

    t    is the current period.
    Ft+1 is the forecast for next period
    n    is the forecasting horizon (how far back we look),
    A    is the actual sales figure from each period.
    w    is the importance (weight) we give to each period
Time Series: Exponential Smoothing (ES)

 Main idea: The prediction of the future depends mostly on
the most recent observation, and on the error for the latest
                         forecast.


      Smoothi
          ng
      constan
                                          Denotes the
       t alpha                        importance of the past
          α                                   error
Exponential smoothing: the method

Assume that we are currently in period t. We calculated the
 forecast for the last period (Ft-1) and we know the actual
demand last period (At-1) …


                  Ft = Ft −1 + α ( At −1 − Ft −1 )

The smoothing constant α expresses how much our
forecast will react to observed differences…
If α is low: there is little reaction to differences.
If α is high: there is a lot of reaction to differences.
Linear regression in forecasting

Linear regression is based on
1. Fitting a straight line to data
2. Explaining the change in one variable through changes
   in other variables.


   dependent variable = a + b × (independent variable)


 By using linear regression, we are trying to explore which
   independent variables affect the dependent variable
Linear Regression Model

• Shows linear relationship between dependent
  & explanatory variables
  – Example: Diapers & # Babies (not time)
          Y-intercept    Slope


                  ^
                  Yi = a + b X i
 Dependent                         Independent (explanatory)
 (response) variable               variable
Example: do people drink more when it’s
cold?
     Alcohol Sales

                             Which line best
                              fits the data?


                             Average
                             Monthly
                           Temperature
The best line is the one that minimizes the
error
  The predicted line is …

                       Y = a + bX


  So, the error is …
                        εi = y i - Yi


  Where: ε is the error
        y is the observed value
        Y is the predicted value
Conclusion

• Accurate demand forecasting requires
  – Product knowledge
  – Knowledge about the customer
  – Knowledge about the environment

demand forecasting

  • 1.
  • 2.
    What is forecastingall about? Demand for Mercedes E We try to predict the Class future by looking back at the past Predicted demand looking Time back six Ja Fe Mar Apr May Jun Jul Aug months n b Actual demand (past sales) Predicted demand
  • 3.
    WHY DEMAND FORECASTING • Planning and scheduling production • Acquiring inputs • Making provisions for finances • Formulating pricing strategy • Planning Advertisement
  • 4.
    OBJECTIVES Short –term Forecasting Toevolve a suitable production policy To reduce the cost of purchase To determine appropriate price policy To set sales targets and establish control To forecast short-term financial requirements
  • 5.
    OBJECTIVES Long –term Forecasting Planning of a new unit or expansion of an existing unit  Planning of long-term financial requirements  Planning of man-power requirements
  • 6.
    Levels of Forecasting •Macro level • Industry level • Micro level
  • 7.
    STEPS IN DEMANDFORECASTING • Determination of the objectives • Sub-dividing the task • Identifying of demand determinants • Selection of the method • Collection of Data • Estimation and interpretation of result • Reporting
  • 8.
    METHODS OF DEMANDFORECASTING QUALITATIVE QUANTITATIVE TECHNIQUES TECHNIQUES  Survey Method  Barometric Techniques  Direct Interview Method  Time Series Analysis  Collective opinion  Regression Method  Delphi Method  Controlled Experiments
  • 9.
    SURVEY METHOD • Surveysare conducted to collect information about the future plans of the potential consumers • A firm may launch a new product, if the suvey indicates that there is a demand for that particular product in the market.
  • 10.
    Direct Interview Method Consumersare contacted directly to ask them what they intend to buy in future Collective opinion The opinions of those who have the feel of the market, like salesman, professional experts, market consultants etc. Advantages •Simple •Quick •Low cost •Reliable Disadvantages Personal judgements may go wrong Useful only foe short-term forecasting
  • 11.
    DELPHI METHOD • Appliedto uncertain areas where past data or future data are not of much use • Some expert in an area will be contacted with questionnaires • A co-ordinator collect all the opinions • Each expert will be supplied with responses of other experts without revealing their identity • Expert may revise his opinion, if needed • Process will be repeated so that all experts come to an agreement
  • 12.
    CONTROLLED EXPERIMENTS • Studiesand experiments in consumers behavior are carried out under actual market conditions • Three or four cities having similarity in population , income level, cultural and social background ,occupational distribution , taste etc.. are chosen • Various demand determinants like price, advertisement , expenditure etc are changed one by one and these changes on demand are observed
  • 13.
    QUANTITATIVE TECHNIQUES BASED ONDATA AND ANALYTICAL TECHNIQUES Barometric Techniques Time series Analysis Regression Method
  • 14.
    BAROMETRIC FORECASTING  basedon the observed relationships between different economic indicators It can be divided into three groups  Leading indicators  Coincident indicators  Lagging indicators
  • 15.
    Leading Indicators • whichrun in advance of changes in demand for a particular product •an increase in the number of building permits granted which would lead to an increase in demand for building-related products such as wood, concrete and so on Coincident Indicators •occur alongside changes in demand •an increase in sales would generate an increase in demand for the manufacturers of the goods concerned Lagging Indicators •run behind changes in demand New industrial investment by firms which will only invest in new production facilities when demand is already firmly established.
  • 16.
    TIME SERIES ANALYSIS •Used to predict the future demand for a product based on the past sales and demand.  Simple moving average  Weighted moving average  Exponential smoothing
  • 17.
    Time series: simplemoving average In the simple moving average models the forecast value is At + At-1 + … + At-n Ft+1 = n t is the current period. Ft+1 is the forecast for next period n is the forecasting horizon (how far back we look), A is the actual sales figure from each period.
  • 18.
    Example: forecasting salesat Kroger Kroger sells (among other stuff) bottled spring water Month Bottles Jan 1,325 Feb 1,353 What will Mar 1,305 the sales Apr 1,275 be for May 1,210 July? Jun 1,195 Jul ?
  • 19.
    What if weuse a 3-month simple moving average? AJun + AMay + AApr FJul = = 1,227 3 What if we use a 5-month simple moving average? AJun + AMay + AApr + AMar + AFeb FJul = = 1,268 5
  • 20.
    Time series: weightedmoving average We may want to give more importance to some of the data… Ft+1 = wt At + wt-1 At-1 + … + wt-n At-n wt + wt-1 + … + wt-n = 1 t is the current period. Ft+1 is the forecast for next period n is the forecasting horizon (how far back we look), A is the actual sales figure from each period. w is the importance (weight) we give to each period
  • 21.
    Time Series: ExponentialSmoothing (ES) Main idea: The prediction of the future depends mostly on the most recent observation, and on the error for the latest forecast. Smoothi ng constan Denotes the t alpha importance of the past α error
  • 22.
    Exponential smoothing: themethod Assume that we are currently in period t. We calculated the forecast for the last period (Ft-1) and we know the actual demand last period (At-1) … Ft = Ft −1 + α ( At −1 − Ft −1 ) The smoothing constant α expresses how much our forecast will react to observed differences… If α is low: there is little reaction to differences. If α is high: there is a lot of reaction to differences.
  • 23.
    Linear regression inforecasting Linear regression is based on 1. Fitting a straight line to data 2. Explaining the change in one variable through changes in other variables. dependent variable = a + b × (independent variable) By using linear regression, we are trying to explore which independent variables affect the dependent variable
  • 24.
    Linear Regression Model •Shows linear relationship between dependent & explanatory variables – Example: Diapers & # Babies (not time) Y-intercept Slope ^ Yi = a + b X i Dependent Independent (explanatory) (response) variable variable
  • 25.
    Example: do peopledrink more when it’s cold? Alcohol Sales Which line best fits the data? Average Monthly Temperature
  • 26.
    The best lineis the one that minimizes the error The predicted line is … Y = a + bX So, the error is … εi = y i - Yi Where: ε is the error y is the observed value Y is the predicted value
  • 27.
    Conclusion • Accurate demandforecasting requires – Product knowledge – Knowledge about the customer – Knowledge about the environment