Downloaded 130 times


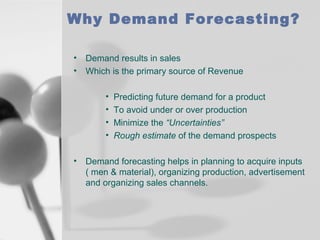
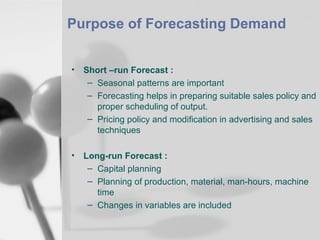
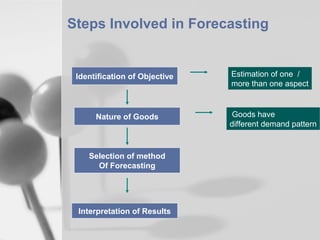
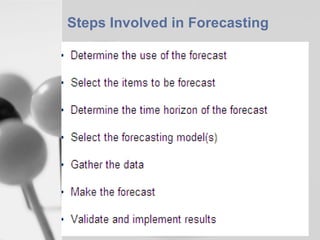
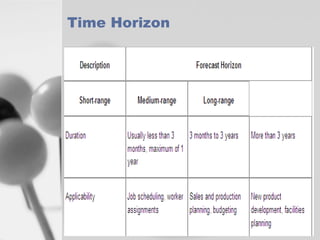
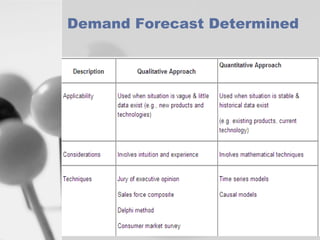
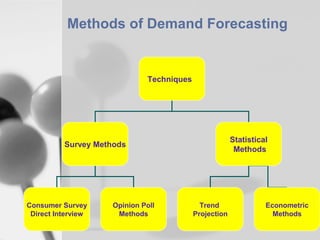
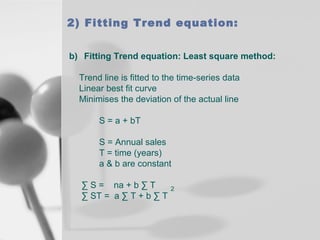

Demand forecasting helps companies plan production levels and resource allocation. There are several methods for forecasting demand, including statistical methods like trend projection and econometric models, as well as survey methods involving consumer surveys and expert opinions. Short-term forecasts focus on seasonal patterns and help with pricing and promotions, while long-term forecasts inform capital planning. The document outlines various demand forecasting techniques and their appropriate uses depending on the time horizon and product characteristics.