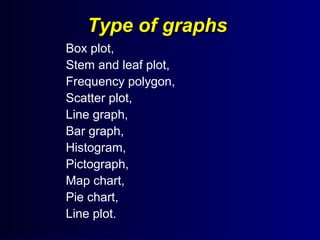
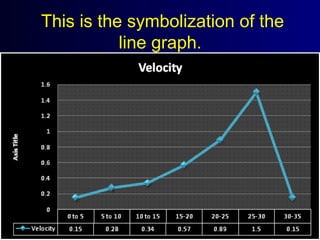
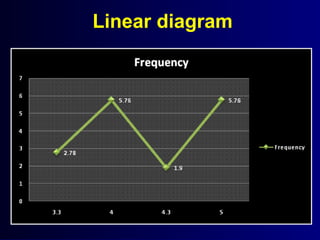
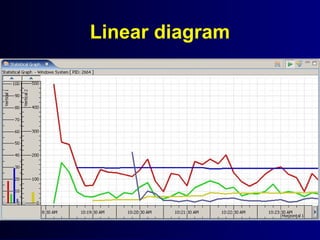
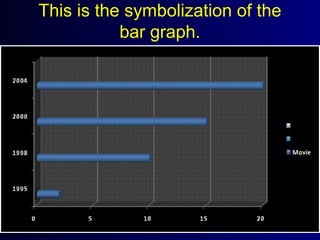
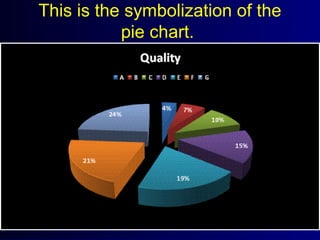
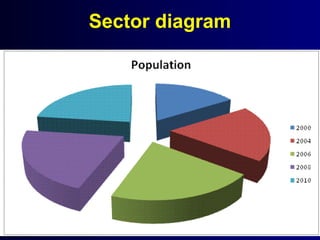
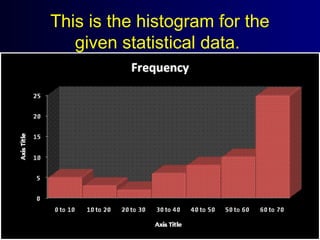
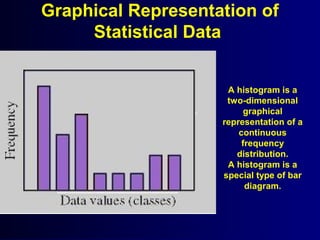
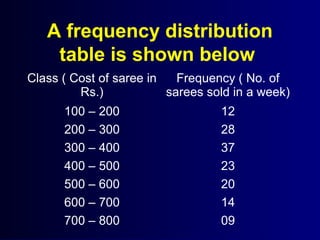
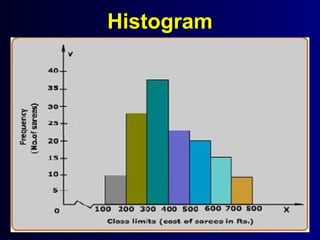
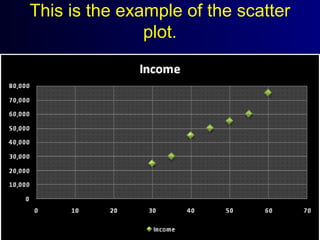
This document discusses different types of statistical graphs used to represent data. There are 11 types of graphs including box plots, stem-and-leaf plots, frequency polygons, scatter plots, line graphs, bar graphs, histograms, pictographs, map charts, pie charts, and line plots. The key graphs discussed are line graphs for continuous data, bar graphs for discrete data, pie charts showing data as percentages, and histograms which are like bar graphs but show continuous data in columns. A histogram example is provided to illustrate how frequency distribution tables are used to construct the graphs.


![Statistics -copy_-_copy[1]](https://cdn.slidesharecdn.com/ss_thumbnails/statistics-copy-copy1-150503082441-conversion-gate02-thumbnail.jpg?width=640&height=640&fit=bounds)