Adapted from the Presentation
of Mrs. Zennifer L. Oberio
Presented by:
Balbido, Aileen U.
Latap, Kenneth John R.
Tejuco, Kerwin Chester
The Study of how to:
Collect
Organize
Analyze
& interpret
numerical information
DESCRIPTIVE STATISTICS
Categories or Qualities
Numbers are used simply as labels for groups or
classes
Number convey no numerical information
Example:1 for YES, 2 for NO
1 – Red, 2 – Yellow, 3 - Green
DESCRIPTIVE STATISTICS
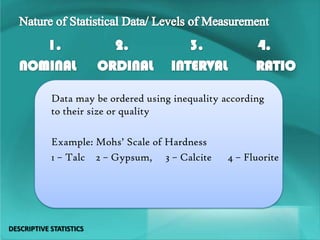
Data may be ordered using inequality according
to their size or quality
Example: Mohs’ Scale of Hardness
1 – Talc 2 – Gypsum, 3 – Calcite 4 – Fluorite
DESCRIPTIVE STATISTICS
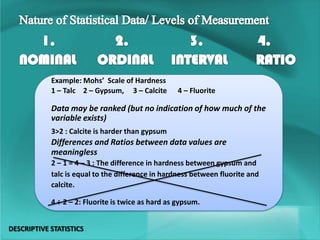
Example: Mohs’ Scale of Hardness
1 – Talc 2 – Gypsum, 3 – Calcite 4 – Fluorite
Data may be ranked (but no indication of how much of the
variable exists)
3>2 : Calcite is harder than gypsum
Differences and Ratios between data values are
meaningless
2 – 1 = 4 – 3 : The difference in hardness between gypsum and
talc is equal to the difference in hardness between fluorite and
calcite.
4 ÷ 2 – 2: Fluorite is twice as hard as gypsum.
DESCRIPTIVE STATISTICS
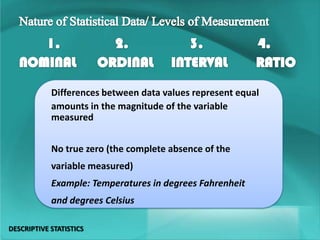
Differences between data values represent equal
amounts in the magnitude of the variable
measured
No true zero (the complete absence of the
variable measured)
Example: Temperatures in degrees Fahrenheit
and degrees Celsius
DESCRIPTIVE STATISTICS
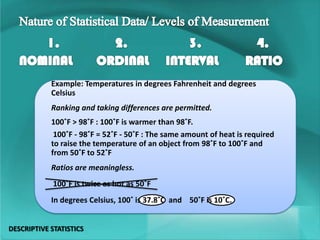
Example: Temperatures in degrees Fahrenheit and degrees
Celsius
Ranking and taking differences are permitted.
100˚F > 98˚F : 100˚F is warmer than 98˚F.
100˚F - 98˚F = 52˚F - 50˚F : The same amount of heat is required
to raise the temperature of an object from 98˚F to 100˚F and
from 50˚F to 52˚F
Ratios are meaningless.
100˚F is twice as hot as 50˚F
In degrees Celsius, 100˚ is 37.8˚C and 50˚F is 10˚C.
DESCRIPTIVE STATISTICS
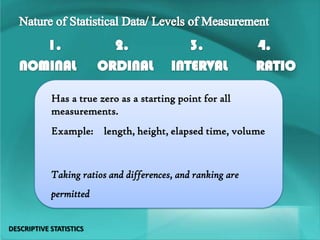
Has a true zero as a starting point for all
measurements.
Example: length, height, elapsed time, volume
Taking ratios and differences, and ranking are
permitted
DESCRIPTIVE STATISTICS
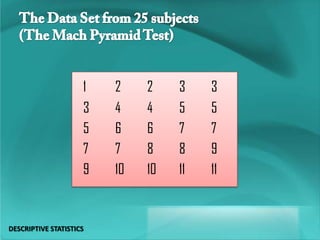
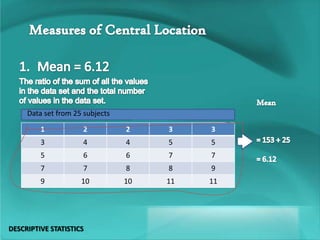
1 2 2 3 3
3 4 4 5 5
5 6 6 7 7
7 7 8 8 9
9 10 10 11 11
DESCRIPTIVE STATISTICS
Descriptive Statistics
DESCRIPTIVE STATISTICS
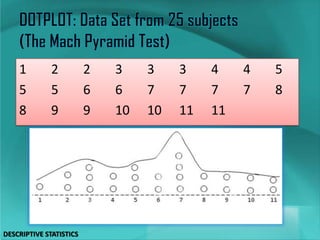
1 2 2 3 3 3 4 4 5
5 5 6 6 7 7 7 7 8
8 9 9 10 10 11 11
DESCRIPTIVE STATISTICS
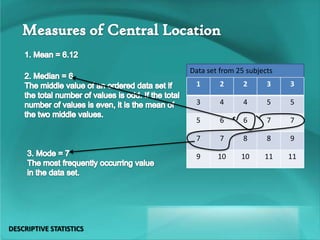
1 2 2 3 3
3 4 4 5 5
5 6 6 7 7
7 7 8 8 9
9 10 10 11 11
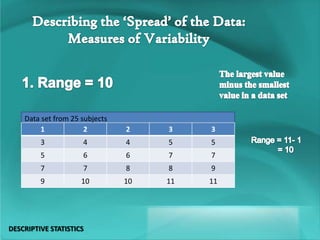
Data set from 25 subjects
DESCRIPTIVE STATISTICS
1 2 2 3 3
3 4 4 5 5
5 6 6 7 7
7 7 8 8 9
9 10 10 11 11
Data set from 25 subjects
DESCRIPTIVE STATISTICS
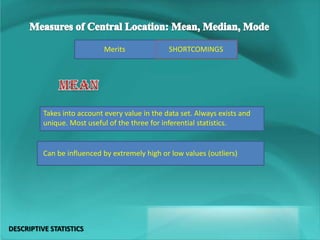
SHORTCOMINGSMerits
Takes into account every value in the data set. Always exists and
unique. Most useful of the three for inferential statistics.
Can be influenced by extremely high or low values (outliers)
DESCRIPTIVE STATISTICS
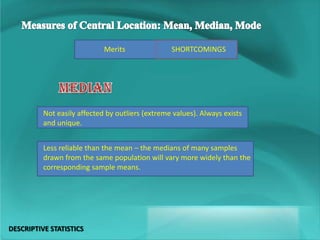
SHORTCOMINGSMerits
Not easily affected by outliers (extreme values). Always exists
and unique.
Less reliable than the mean – the medians of many samples
drawn from the same population will vary more widely than the
corresponding sample means.
DESCRIPTIVE STATISTICS
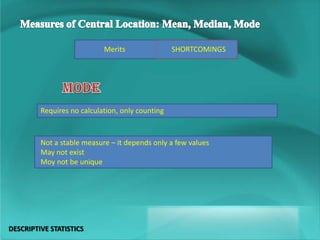
SHORTCOMINGSMerits
Requires no calculation, only counting
Not a stable measure – it depends only a few values
May not exist
Moy not be unique
DESCRIPTIVE STATISTICS
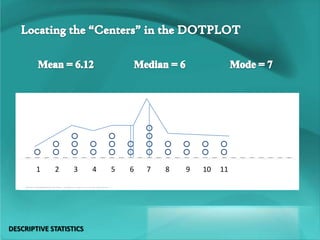
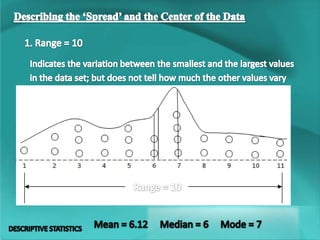
1 2 3 4 5 6 7 8 9 10 11
DESCRIPTIVE STATISTICS
1 2 2 3 3
3 4 4 5 5
5 6 6 7 7
7 7 8 8 9
9 10 10 11 11
Data set from 25 subjects
DESCRIPTIVE STATISTICS
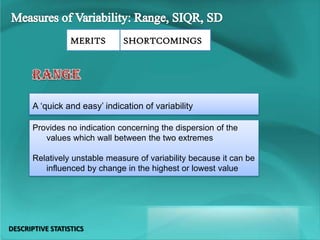
A ‘quick and easy’ indication of variability
Provides no indication concerning the dispersion of the
values which wall between the two extremes
Relatively unstable measure of variability because it can be
influenced by change in the highest or lowest value
DESCRIPTIVE STATISTICS
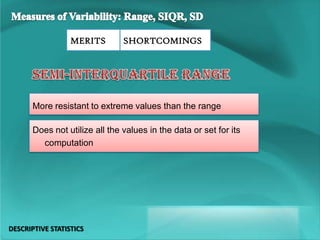
MERITS SHORTCOMINGS
MERITS SHORTCOMINGS
More resistant to extreme values than the range
Does not utilize all the values in the data or set for its
computation
DESCRIPTIVE STATISTICS
MERITS SHORTCOMINGS
Use all the values in the data for its computation
DESCRIPTIVE STATISTICS
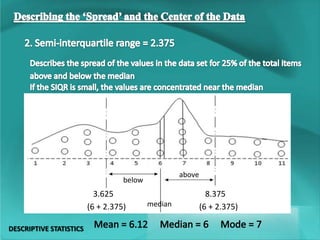
below
above
median
8.375
(6 + 2.375)
3.625
(6 + 2.375)
DESCRIPTIVE STATISTICS
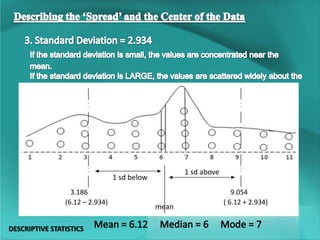
3.186
(6.12 – 2.934)
1 sd below
1 sd above
mean
9.054
( 6.12 + 2.934)
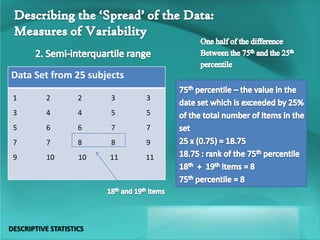
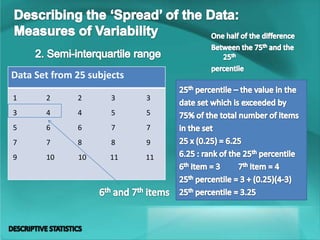
Data Set from 25 subjects
1 2 2 3 3
3 4 4 5 5
5 6 6 7 7
7 7 8 8 9
9 10 10 11 11
DESCRIPTIVE STATISTICS
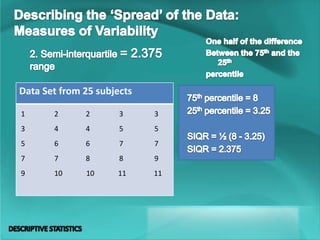
Data Set from 25 subjects
1 2 2 3 3
3 4 4 5 5
5 6 6 7 7
7 7 8 8 9
9 10 10 11 11
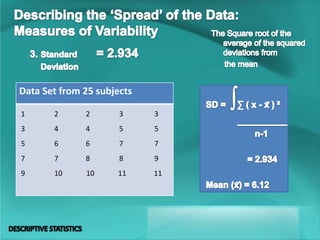
Data Set from 25 subjects
1 2 2 3 3
3 4 4 5 5
5 6 6 7 7
7 7 8 8 9
9 10 10 11 11
Data Set from 25 subjects
1 2 2 3 3
3 4 4 5 5
5 6 6 7 7
7 7 8 8 9
9 10 10 11 11