Downloaded 267 times

![Resolution
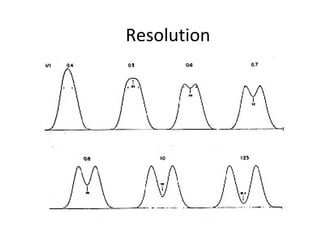
R = 2∆Z = 2[(tR) B − (tR) A]
WA + WB WA + WB](https://image.slidesharecdn.com/columnchr-190622182010/85/Chromatography-50-320.jpg)


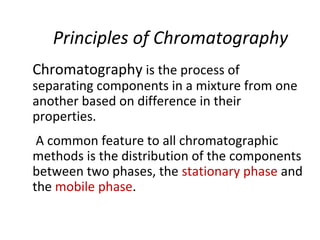
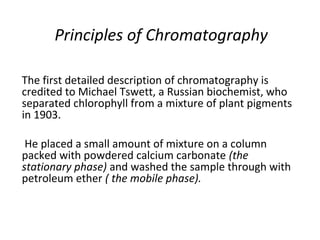
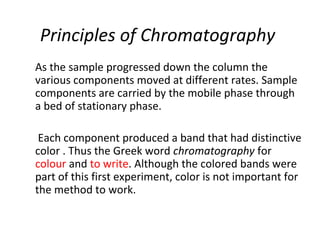
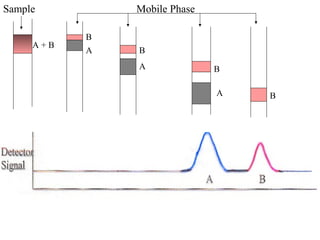
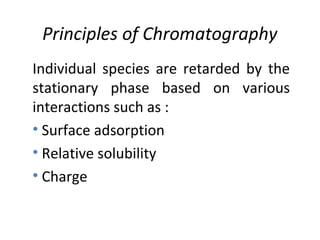
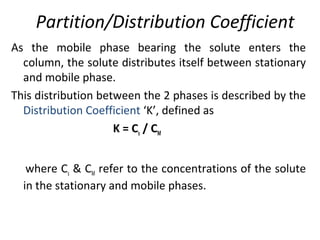
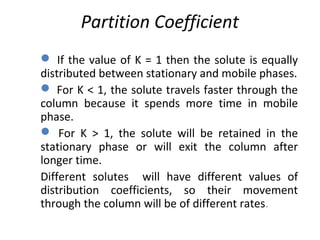
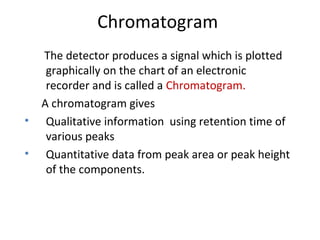
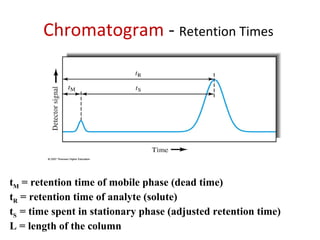
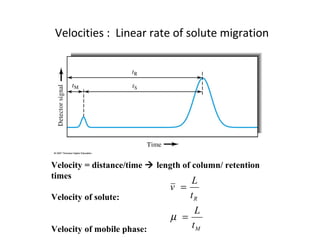
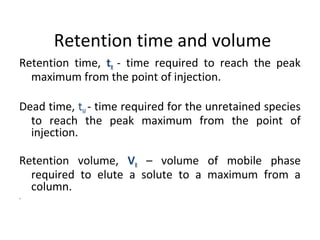
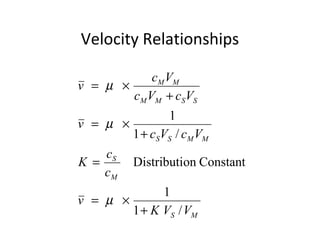
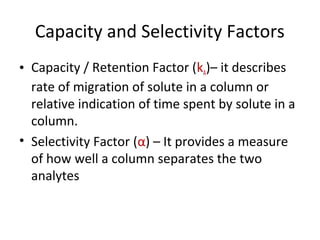
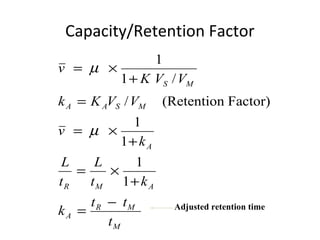
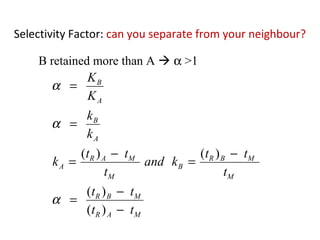
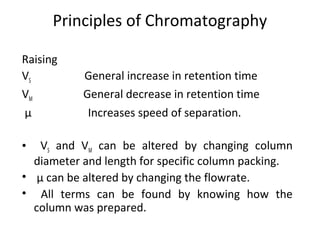
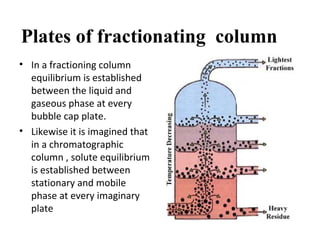
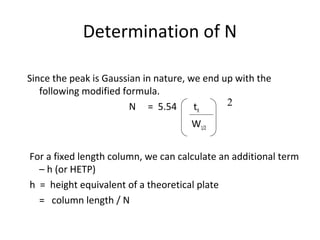
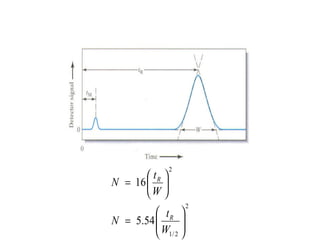
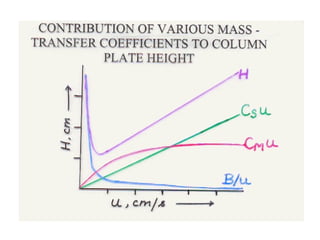
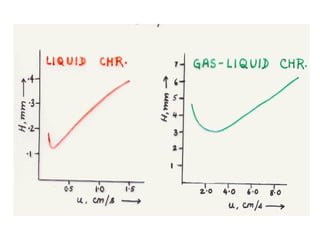
The document discusses the principles of chromatography. It describes how chromatography separates components in a mixture based on differences in their interactions with mobile and stationary phases. It discusses how Michael Tswett first demonstrated chromatography in 1903 and the key aspects of how it works. These include how retention time, partition coefficients, selectivity factors and efficiency parameters like plate number and height equivalent to a theoretical plate are used to characterize chromatographic separations.


![Polymer [ बहुलक ] Chemistry Notes PDF - Irfanullah Mehar - JJ Sir Chemistry.pdf](https://cdn.slidesharecdn.com/ss_thumbnails/polymerchemistrynotespdf-irfanullahmehar-jjsirchemistry-260210172118-3f9b37f7-thumbnail.jpg?width=640&height=640&fit=bounds)


