Download to read offline

![C h r o m a t o g r a p h y S u m m a r y
Ch
Page 4
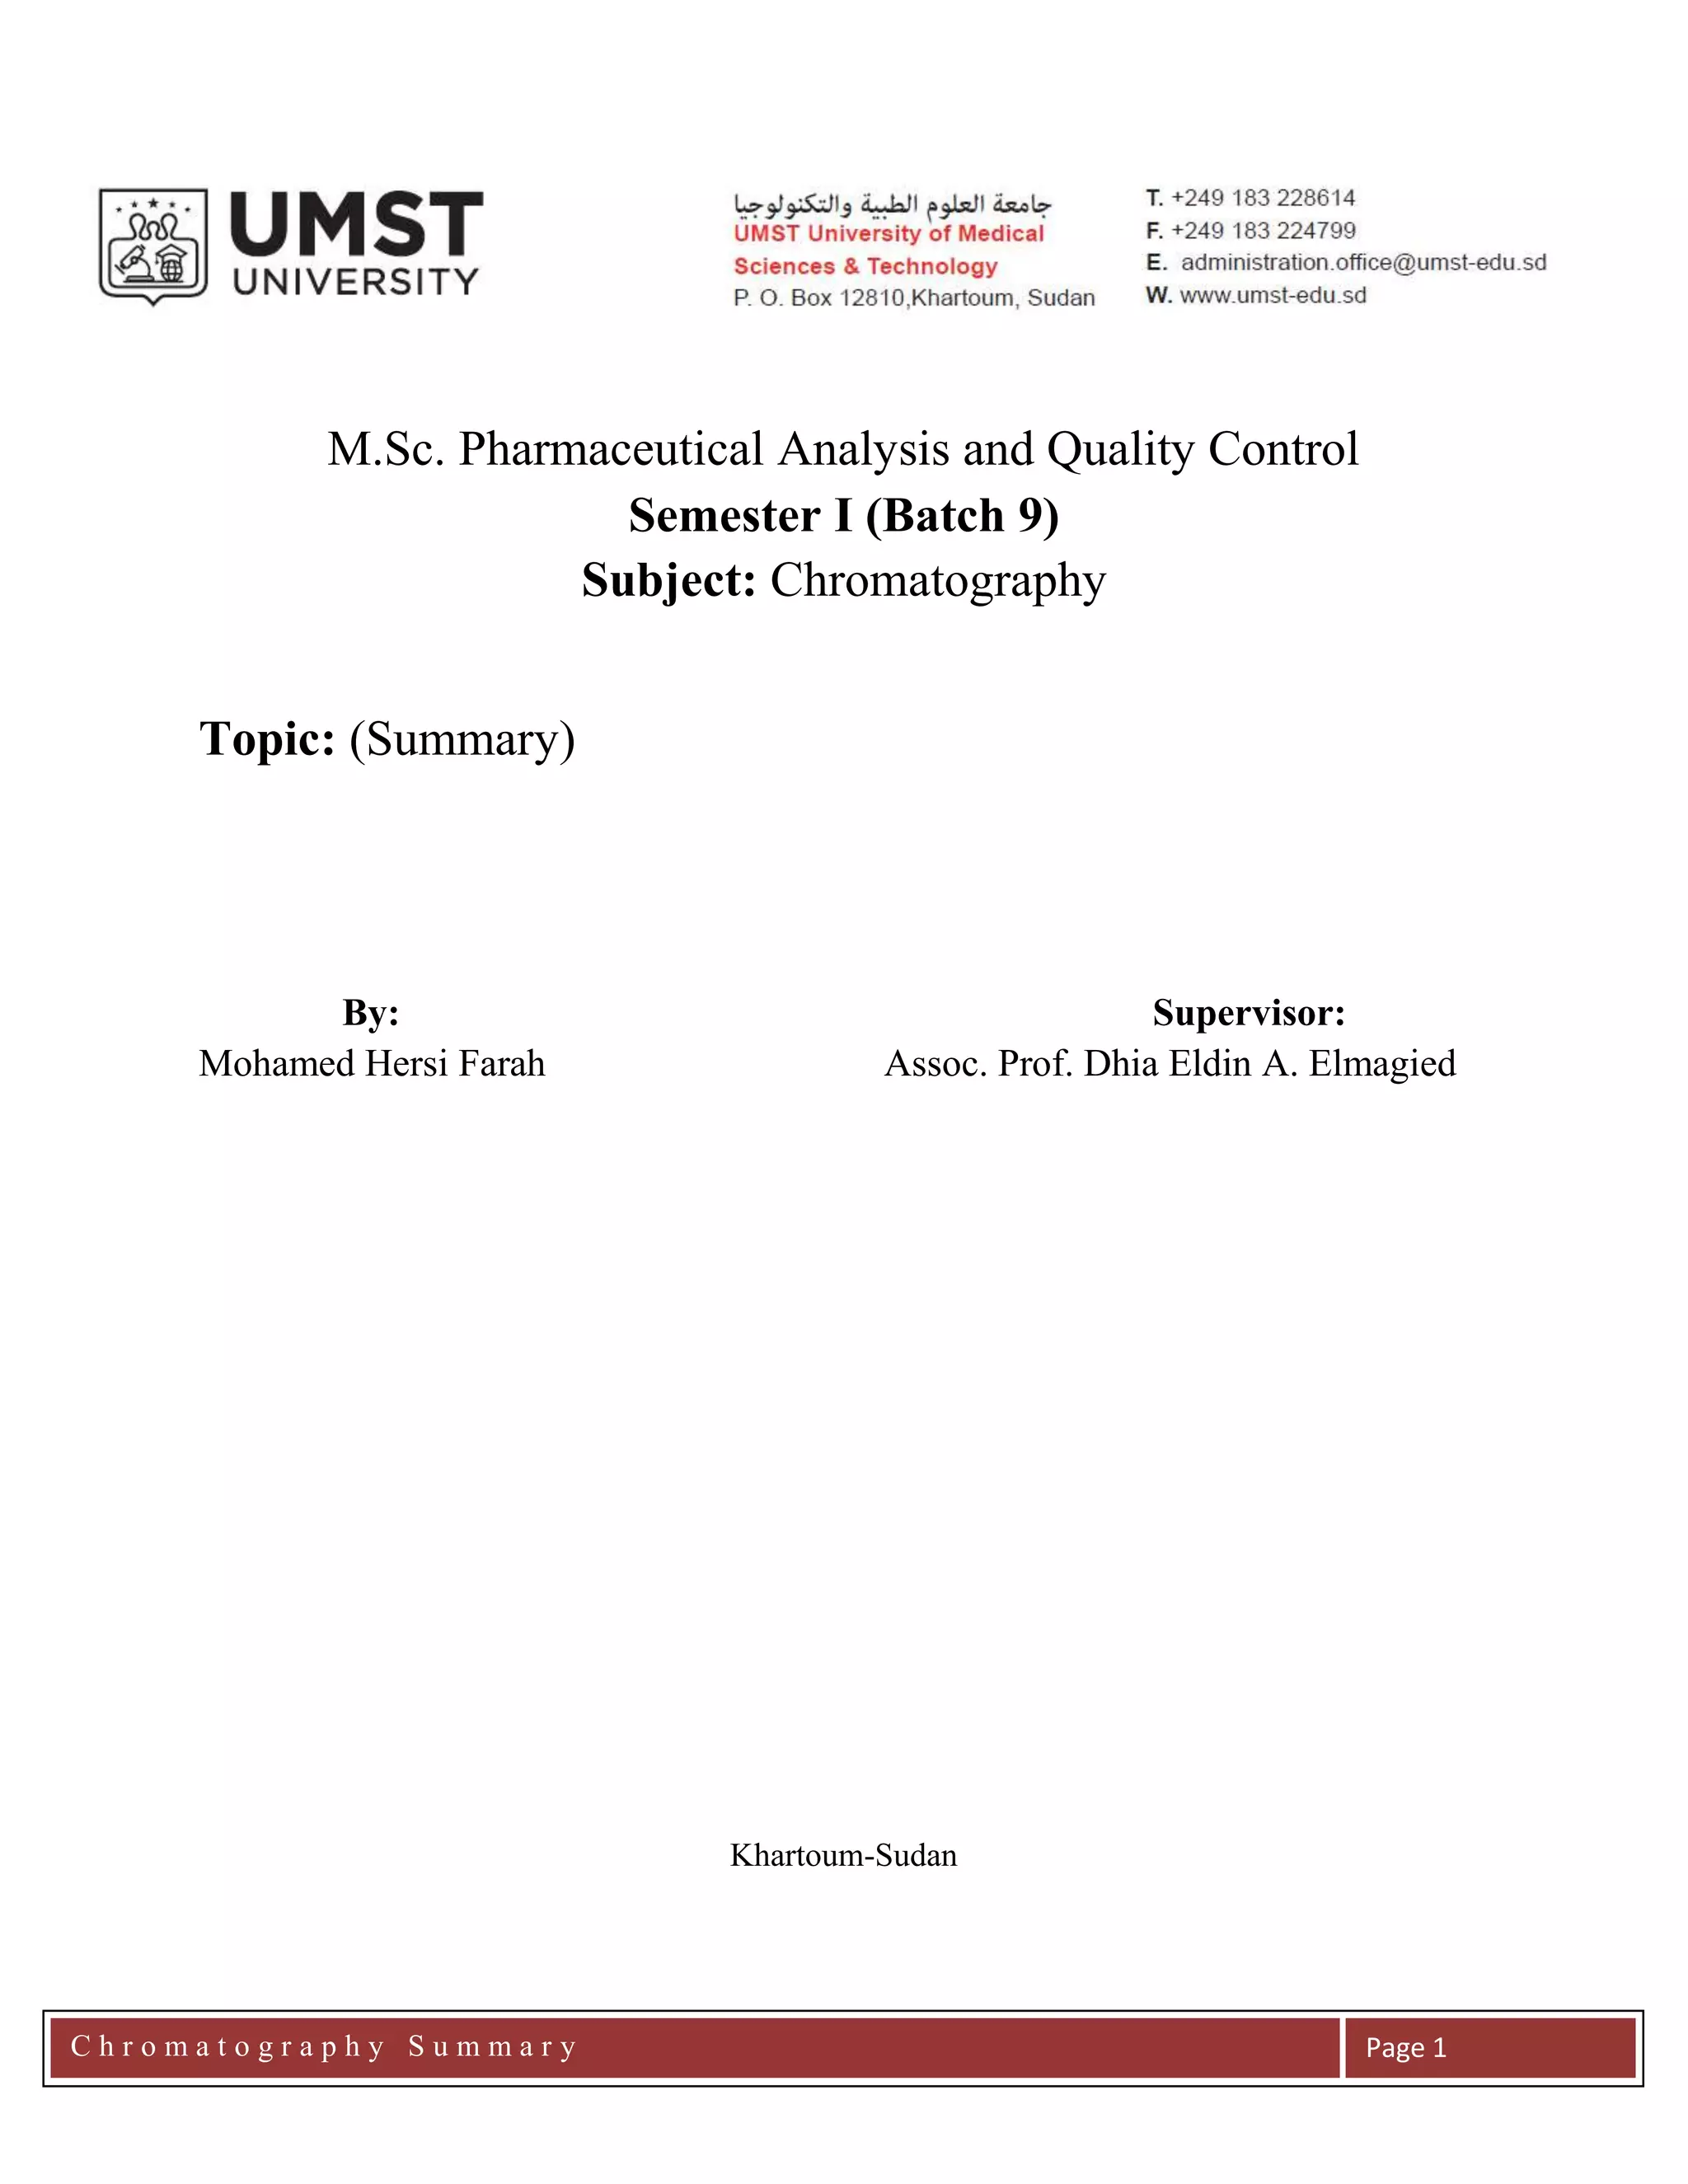
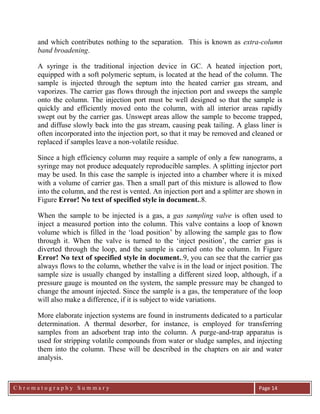
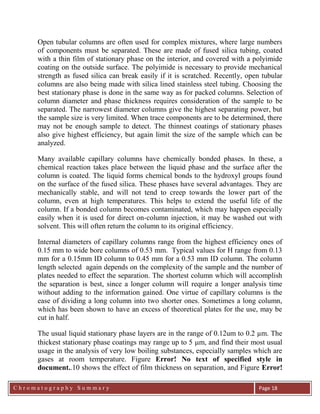
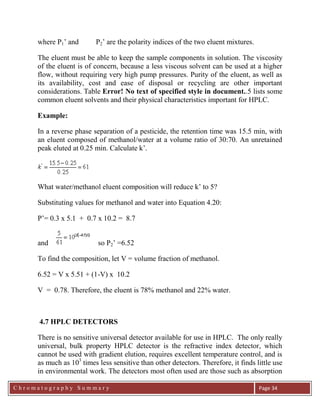
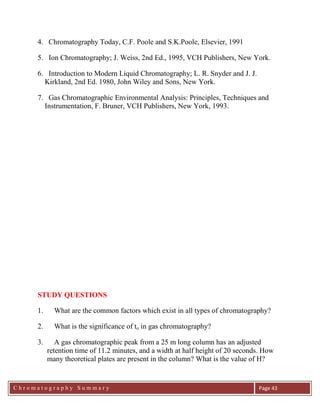
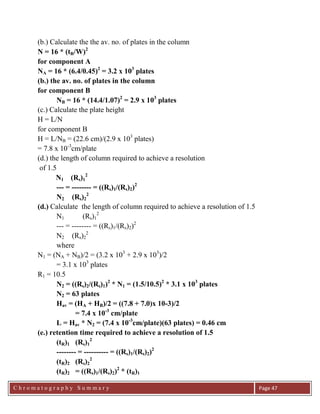
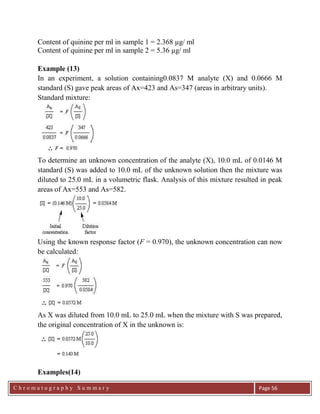
The movement of analytes in the column can be described mathematically. The
basis of chromatography is the equilibrium of each analyte between the mobile and
stationary phase. This can be expressed by a simple equilibrium equation, where
Kx is partition coefficient,
Kx = [C]s / [C]m ( Error! No text
of specified style in document..1)
that is: the concentration in the stationary phase ([Cs]) is directly related to the
concentration in the mobile phase ([Cm]), at least when the concentrations are low.
Chromatographic separations are best done with a small amount of analyte, which
keeps either phase from becoming saturated with analyte, so that the
concentrations in the two phases are directly proportional. Overloading the column
with sample causes one of the phases to become saturated with sample, leading to a
loss of column efficiency, and poorly shaped peak profiles.
The quantities in the equilibrium expression for Kx, [C]s and [C]m are not easy to
measure. We can define a new constant, the capacity factor, k':
k'x = (moles of X in stationary phase)/(moles of X in mobile phase)
( Error! No text of specified style in document..2)
Since the number of moles can be expressed as the concentration multiplied by the
volume, Equations 6.1 and 6.2 can be combined and reduced to:
k'x = Kx (Vs/Vm) ( Error! No text
of specified style in document..3)
All sample molecules spend the same amount of time in the mobile phase. If they
were completely unretained by the stationary phase they would exit the column in
the time it takes for one volume of mobile phase to pass through the column. This
is equal to the void volume of the column. Molecules pass through the column in
the time equal to the passage of one void volume, Vm, plus the time spent in the
stationary phase, expressed by k'x. Therefore, the volume of eluent which will pass
through the column before the sample elutes (the retention volume, Vr) can be
expressed as:
Vr = Vm ( 1 + k'x ) ( Chapter 4 .4)](https://image.slidesharecdn.com/chromatographysummary-190820060528/85/Chromatography-summary-4-320.jpg)
![C h r o m a t o g r a p h y S u m m a r y
Ch
Page 38
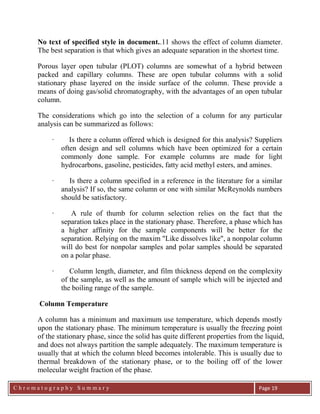
The partition coefficient K for the cation exchange is:
K = [R-Zn++
]/[Zn++
]
where R-Zn++
is the concentration on the ion exchange resin, and Zn++
is the
concentration in the mobile phase. The partition coefficient for the anion exchange
is calculated in a similar fashion. The most common anion exchange column
incorporates a quaternary amine group, while cation columns usually bear
sulfonate groups. The packings are prepared by sulfonating or aminating the
surface of the polymer core, with the active sites located close to the surface, to
improve the mass transfer between the eluent and the stationary phase.
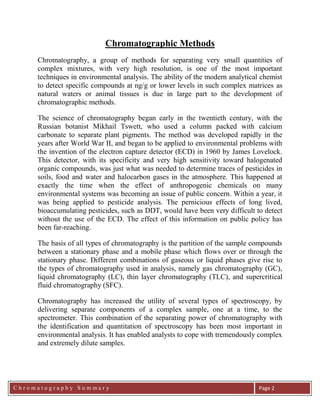
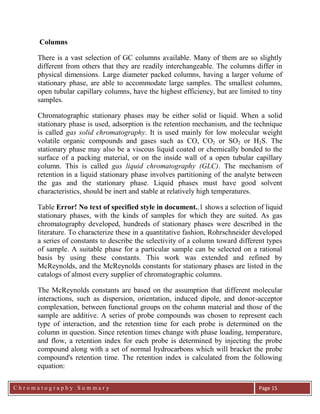
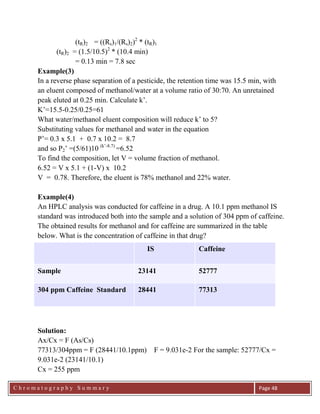
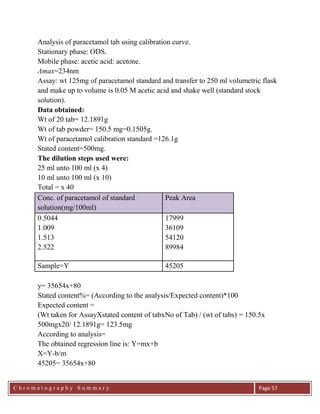
The instrumentation used for ion chromatography is similar to that used for HPLC
and is shown in Figure Error! No text of specified style in document..30. The
conductivity detector which measures the electrical conductivity of the eluting
mobile phase is commonly used.
If the mobile phase has a high ionic strength, the background electrical
conductivity will be high and the detector will have low sensitivity. There are two
methods used to reduce this difficulty: the suppresser column technique and the
single column technique. In the suppresser column method, the a fairly strong
eluent is used to move the sample through the analytical column. Then the eluent is
passed through a second column, the suppresser column. This neutralizes the
eluent and allows easy detection of the sample ions. For instance, in the analysis of
cations, a dilute HCl solution may be used as the eluent. The analytical column is a
low capacity cation exchange resin, and the suppresser column is a high capacity
anion exchange resin. The large excess of H+
ions displaces the sample cations,
with each cation establishing its own equilibrium between the eluent and the
surface. The suppresser column is an anion exchange resin in the hydroxyl form,
and the H+
ions from the mobile phase react with the OH-
, forming water. This
leaves the sample cations in the eluent stream, with a very low background
conductivity, facilitating conductivity detection. The suppresser column eventually
becomes exhausted and must be regenerated to replenish the OH-
on the surface.
For analysis of anions, the analytical column is an anion exchange resin while the
suppresser is a high capacity cation exchange resin. The eluent is, for instance, a
dilute solution of NaOH. In the suppresser column, the OH-
ions in the eluent are
neutralized by the H+
from the column. This leaves only the sample anions in the
solution and high sensitivity is obtained.](https://image.slidesharecdn.com/chromatographysummary-190820060528/85/Chromatography-summary-38-320.jpg)
![C h r o m a t o g r a p h y S u m m a r y
Ch
Page 51
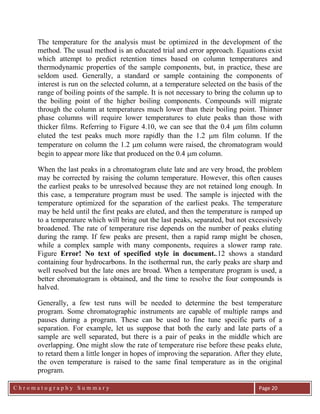
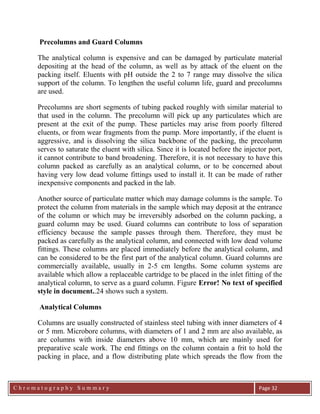
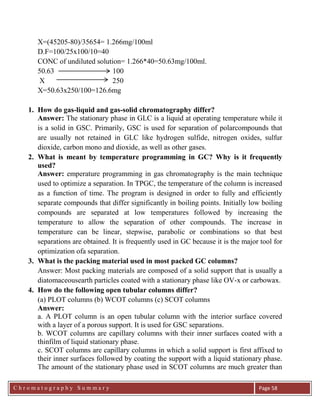
Example(8)
HPLC analysis of a drug gave a relative peak area of 0.381 units. 5ml of a 0.2 M of
a standard was added to 95 ml of the sample. The signal obtained was 0.805. Find
the conc of the drug in the amplr
Note that when we add the 5 ml standard solution to the 95 ml sample solution, we
are diluting the solutions.
Thus we need to take the DILUTION FACTOR into account.
Therefore:
For the mixture of sample and standard:
Hence:
Example (10)
stdsamplefromSignal
samplefromSignal
stdsamplein.tofConc
samplein..ofConc
drughe
drugthe
SX
X
ff
i
I
I
[S][X]
[X]
f
i
V
V
volumefinal
volumeinitial
factorDilution
concInitial
V
V
concFinal
f
i
ii 0.95[x][x]
ml100
ml95
sampleofconcFinal 0.010M0.20M
ml100
ml5
stdofconcFinal
0.805
0.381
(0.010)0.95[x]
[x]
i
i
SX
X
ff
i
I
I
[S][X]
[X]
M0.086[x]i ](https://image.slidesharecdn.com/chromatographysummary-190820060528/85/Chromatography-summary-51-320.jpg)

This document provides a summary of chromatography. It discusses the basic principles of chromatography including the partition of analytes between a mobile and stationary phase. The four main types of chromatography are described as gas chromatography, liquid chromatography, thin layer chromatography, and supercritical fluid chromatography. Key concepts like retention time, capacity factor, plate height, plate number, efficiency, selectivity and resolution are defined. Chromatographic separation depends on differences in how long analytes interact with the mobile versus stationary phases.