Downloaded 166 times
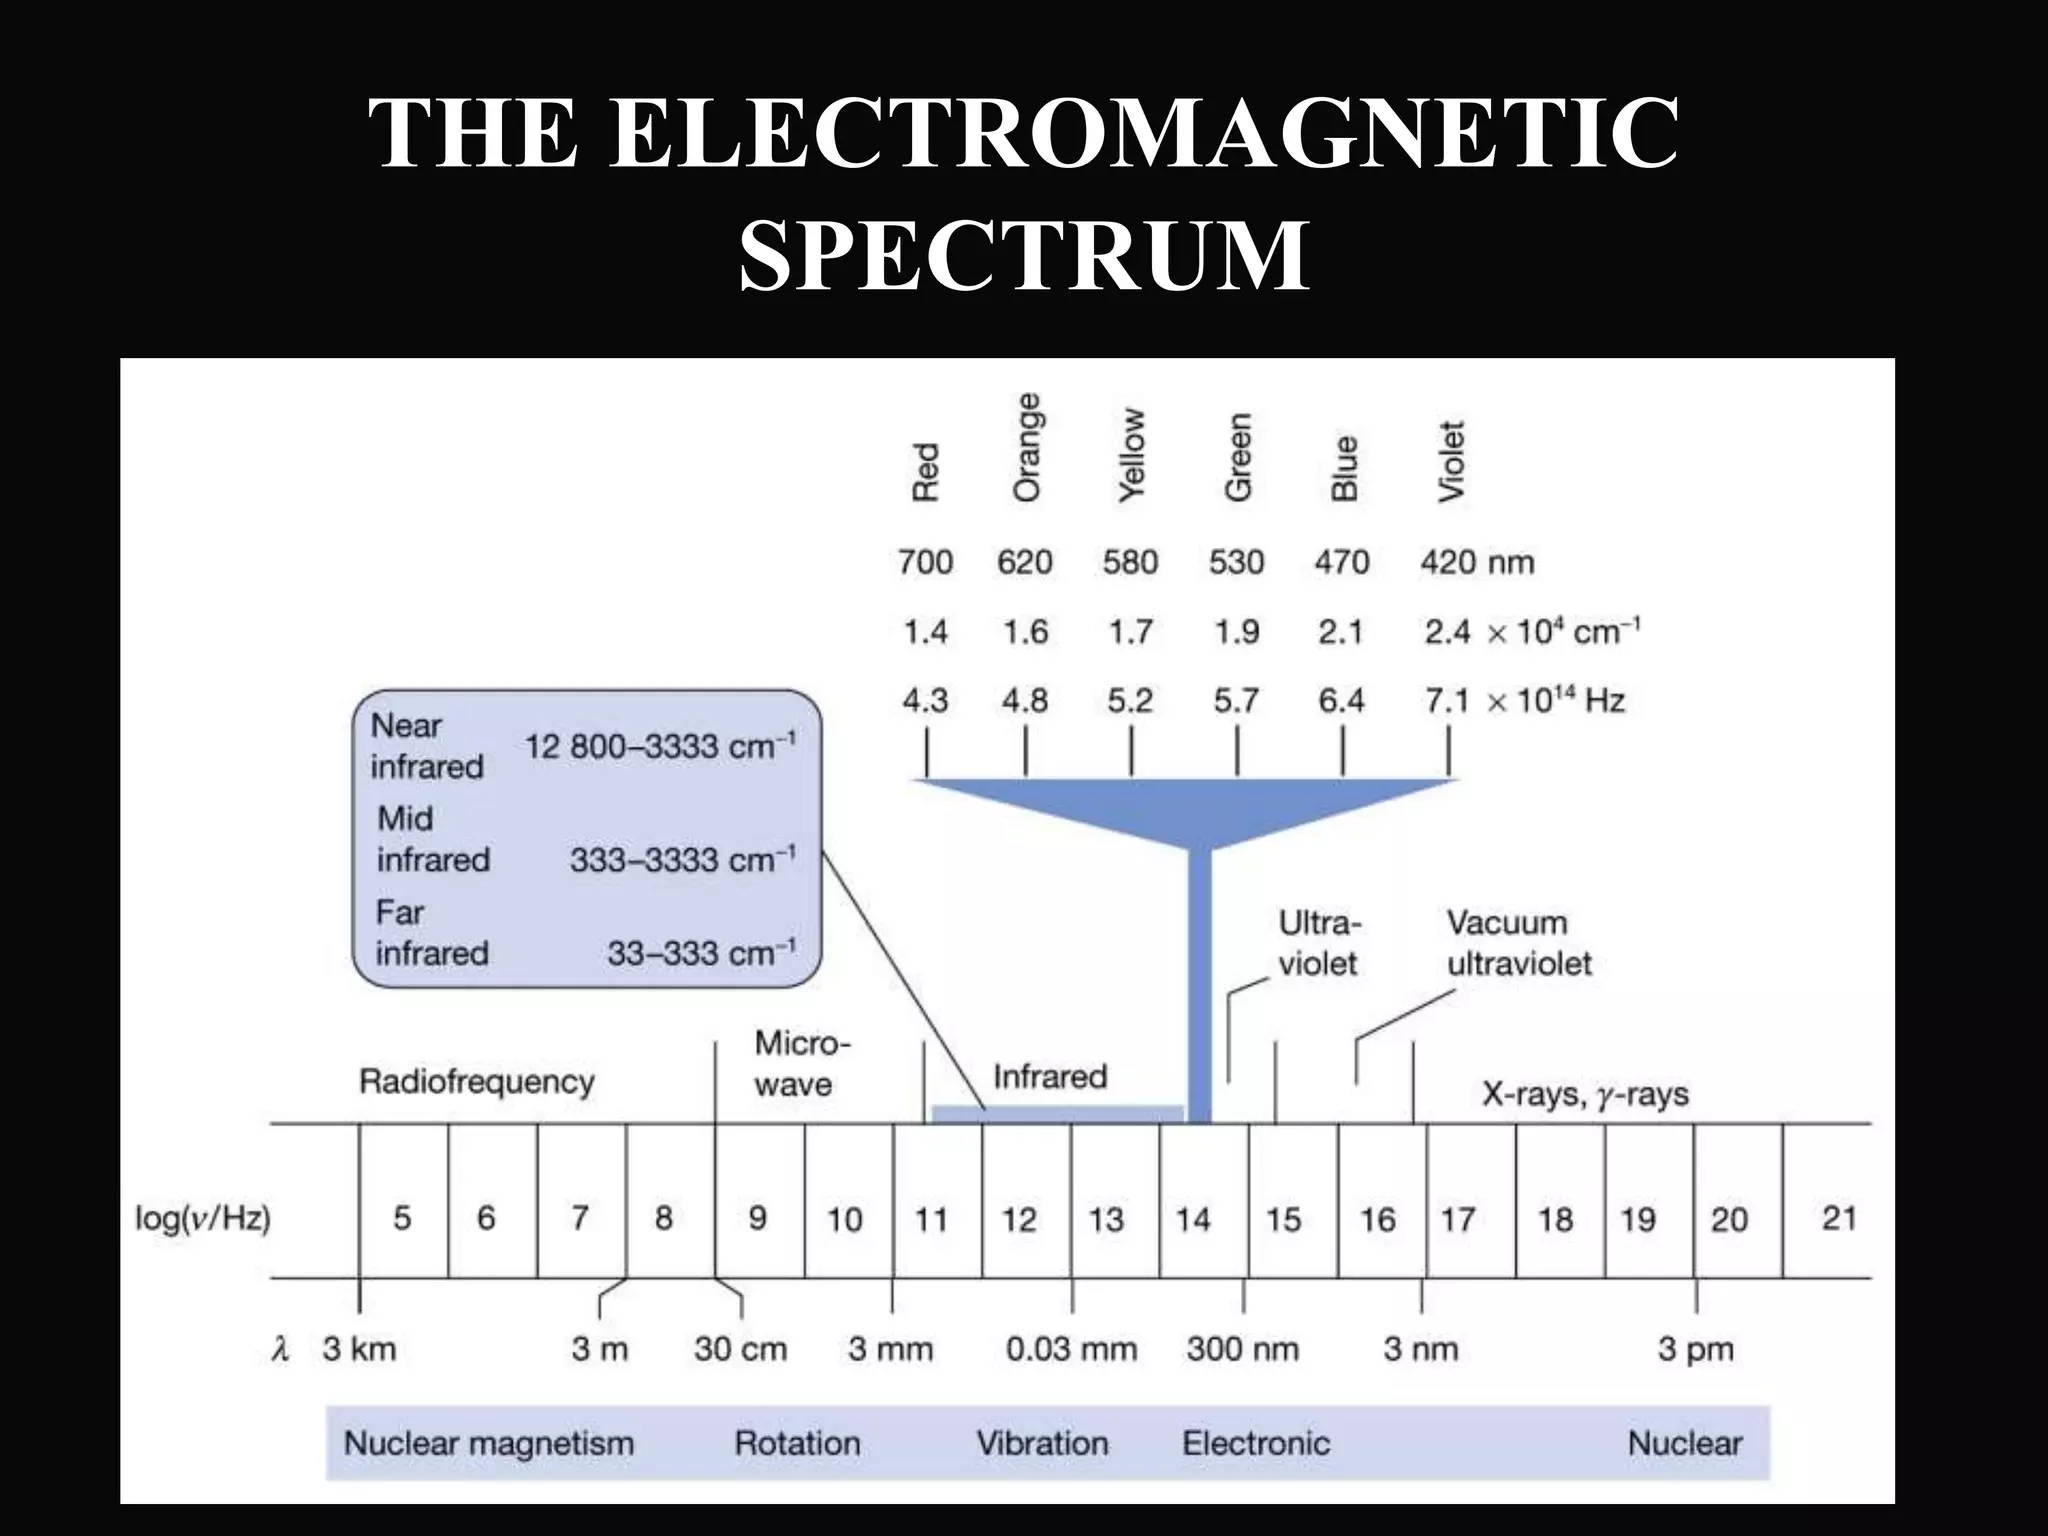
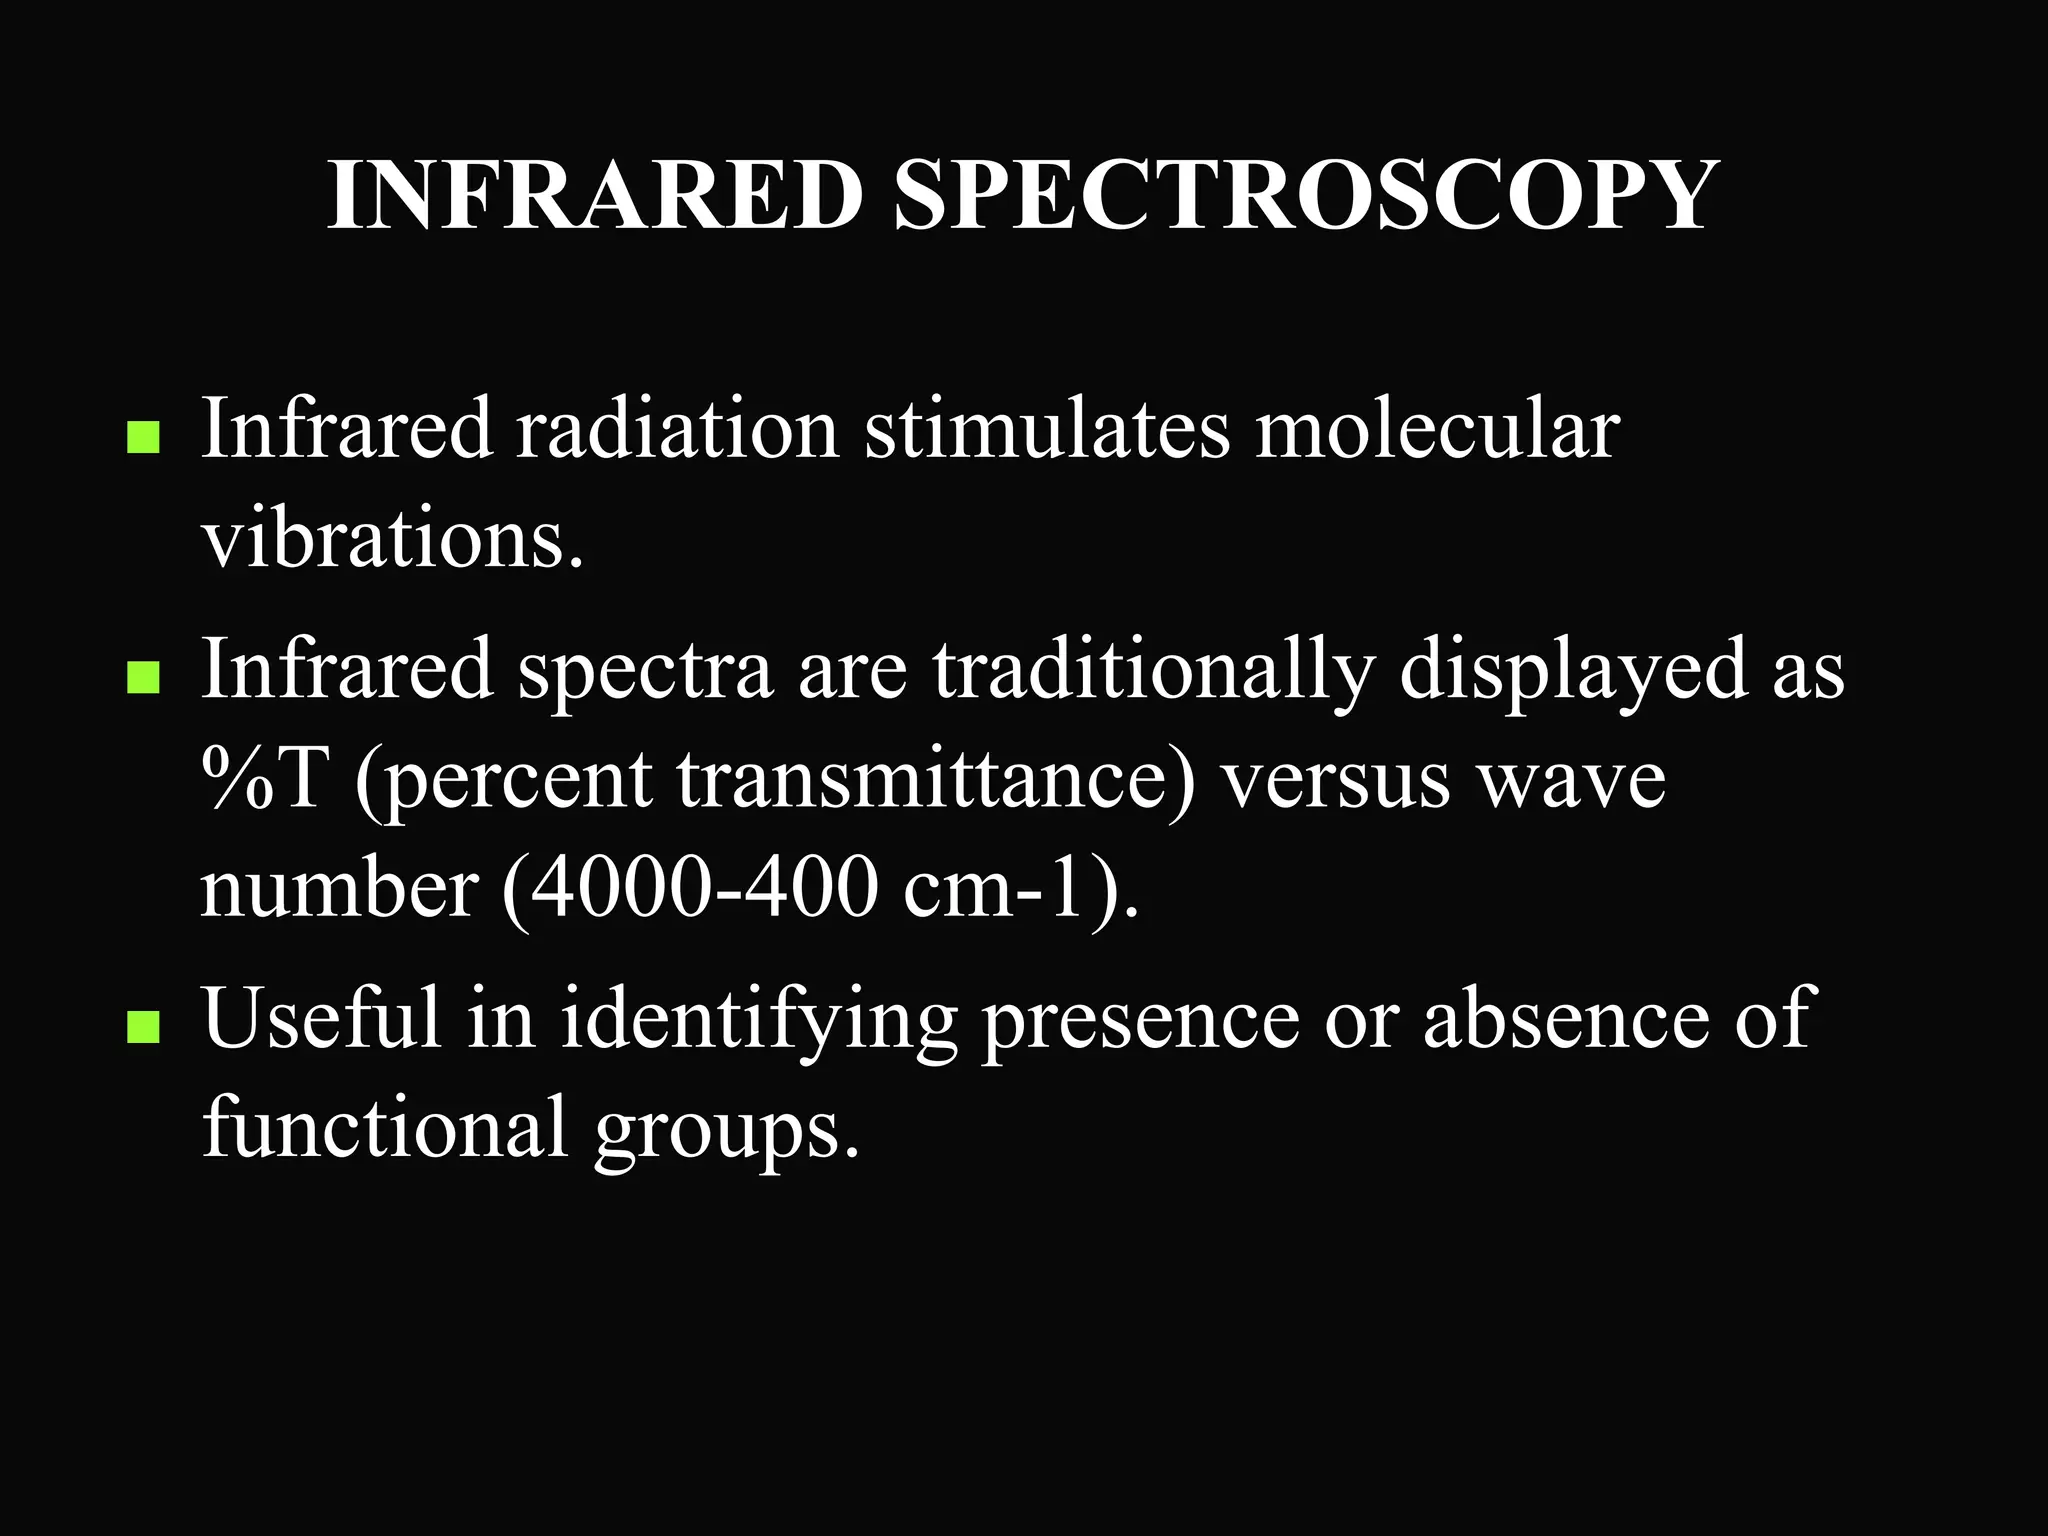
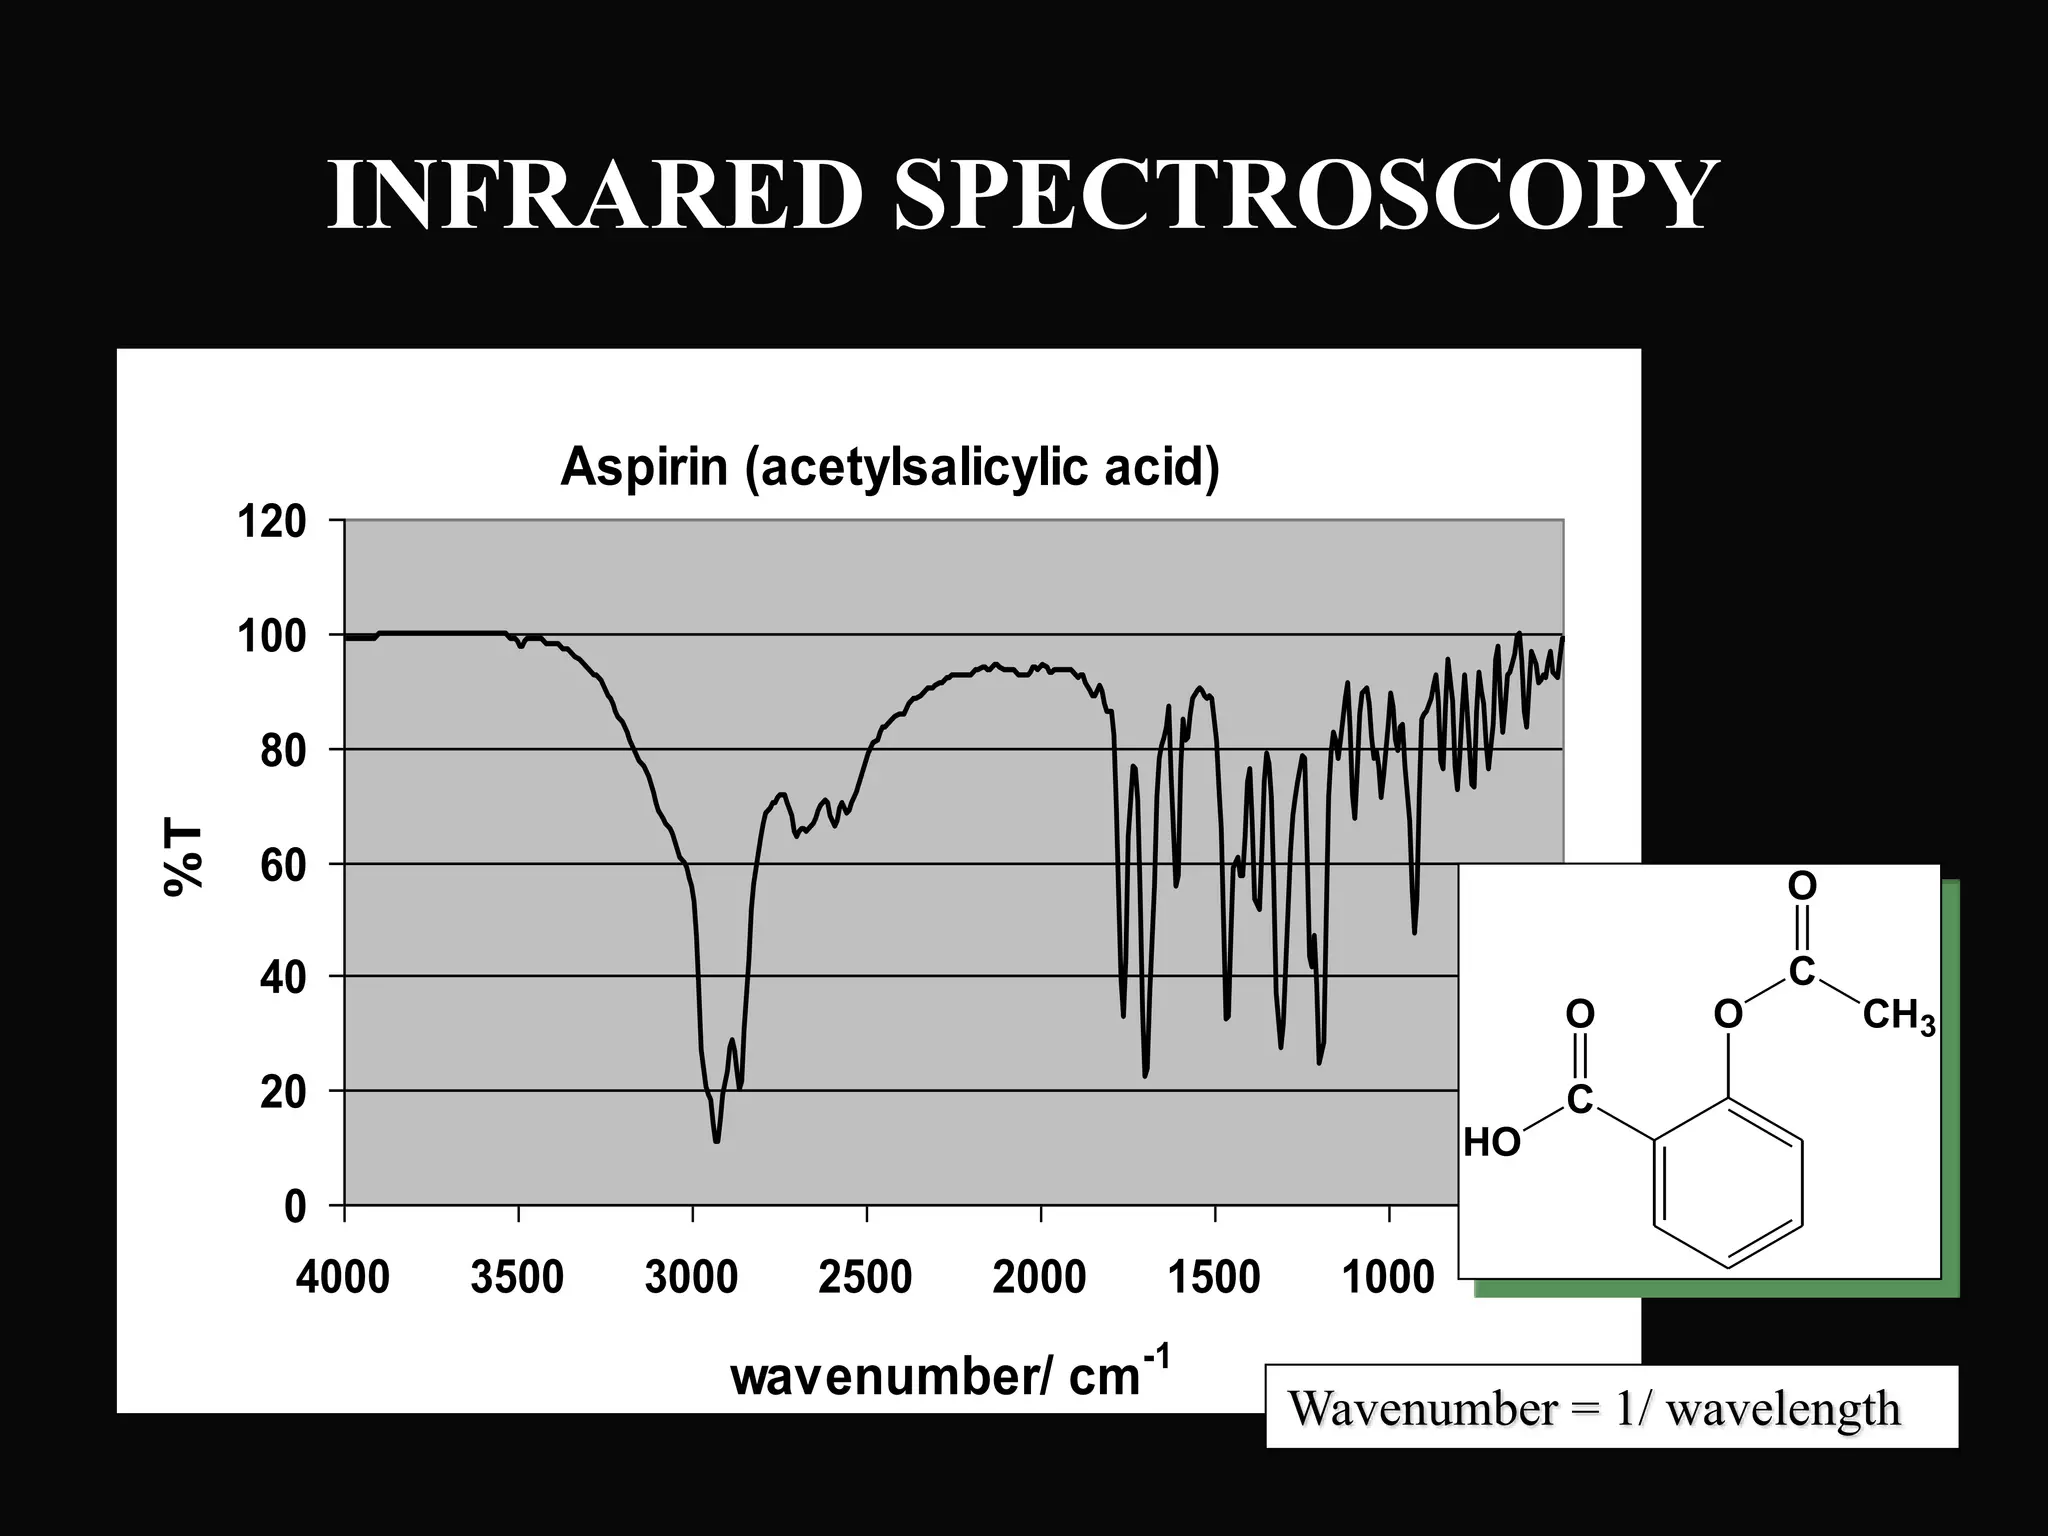
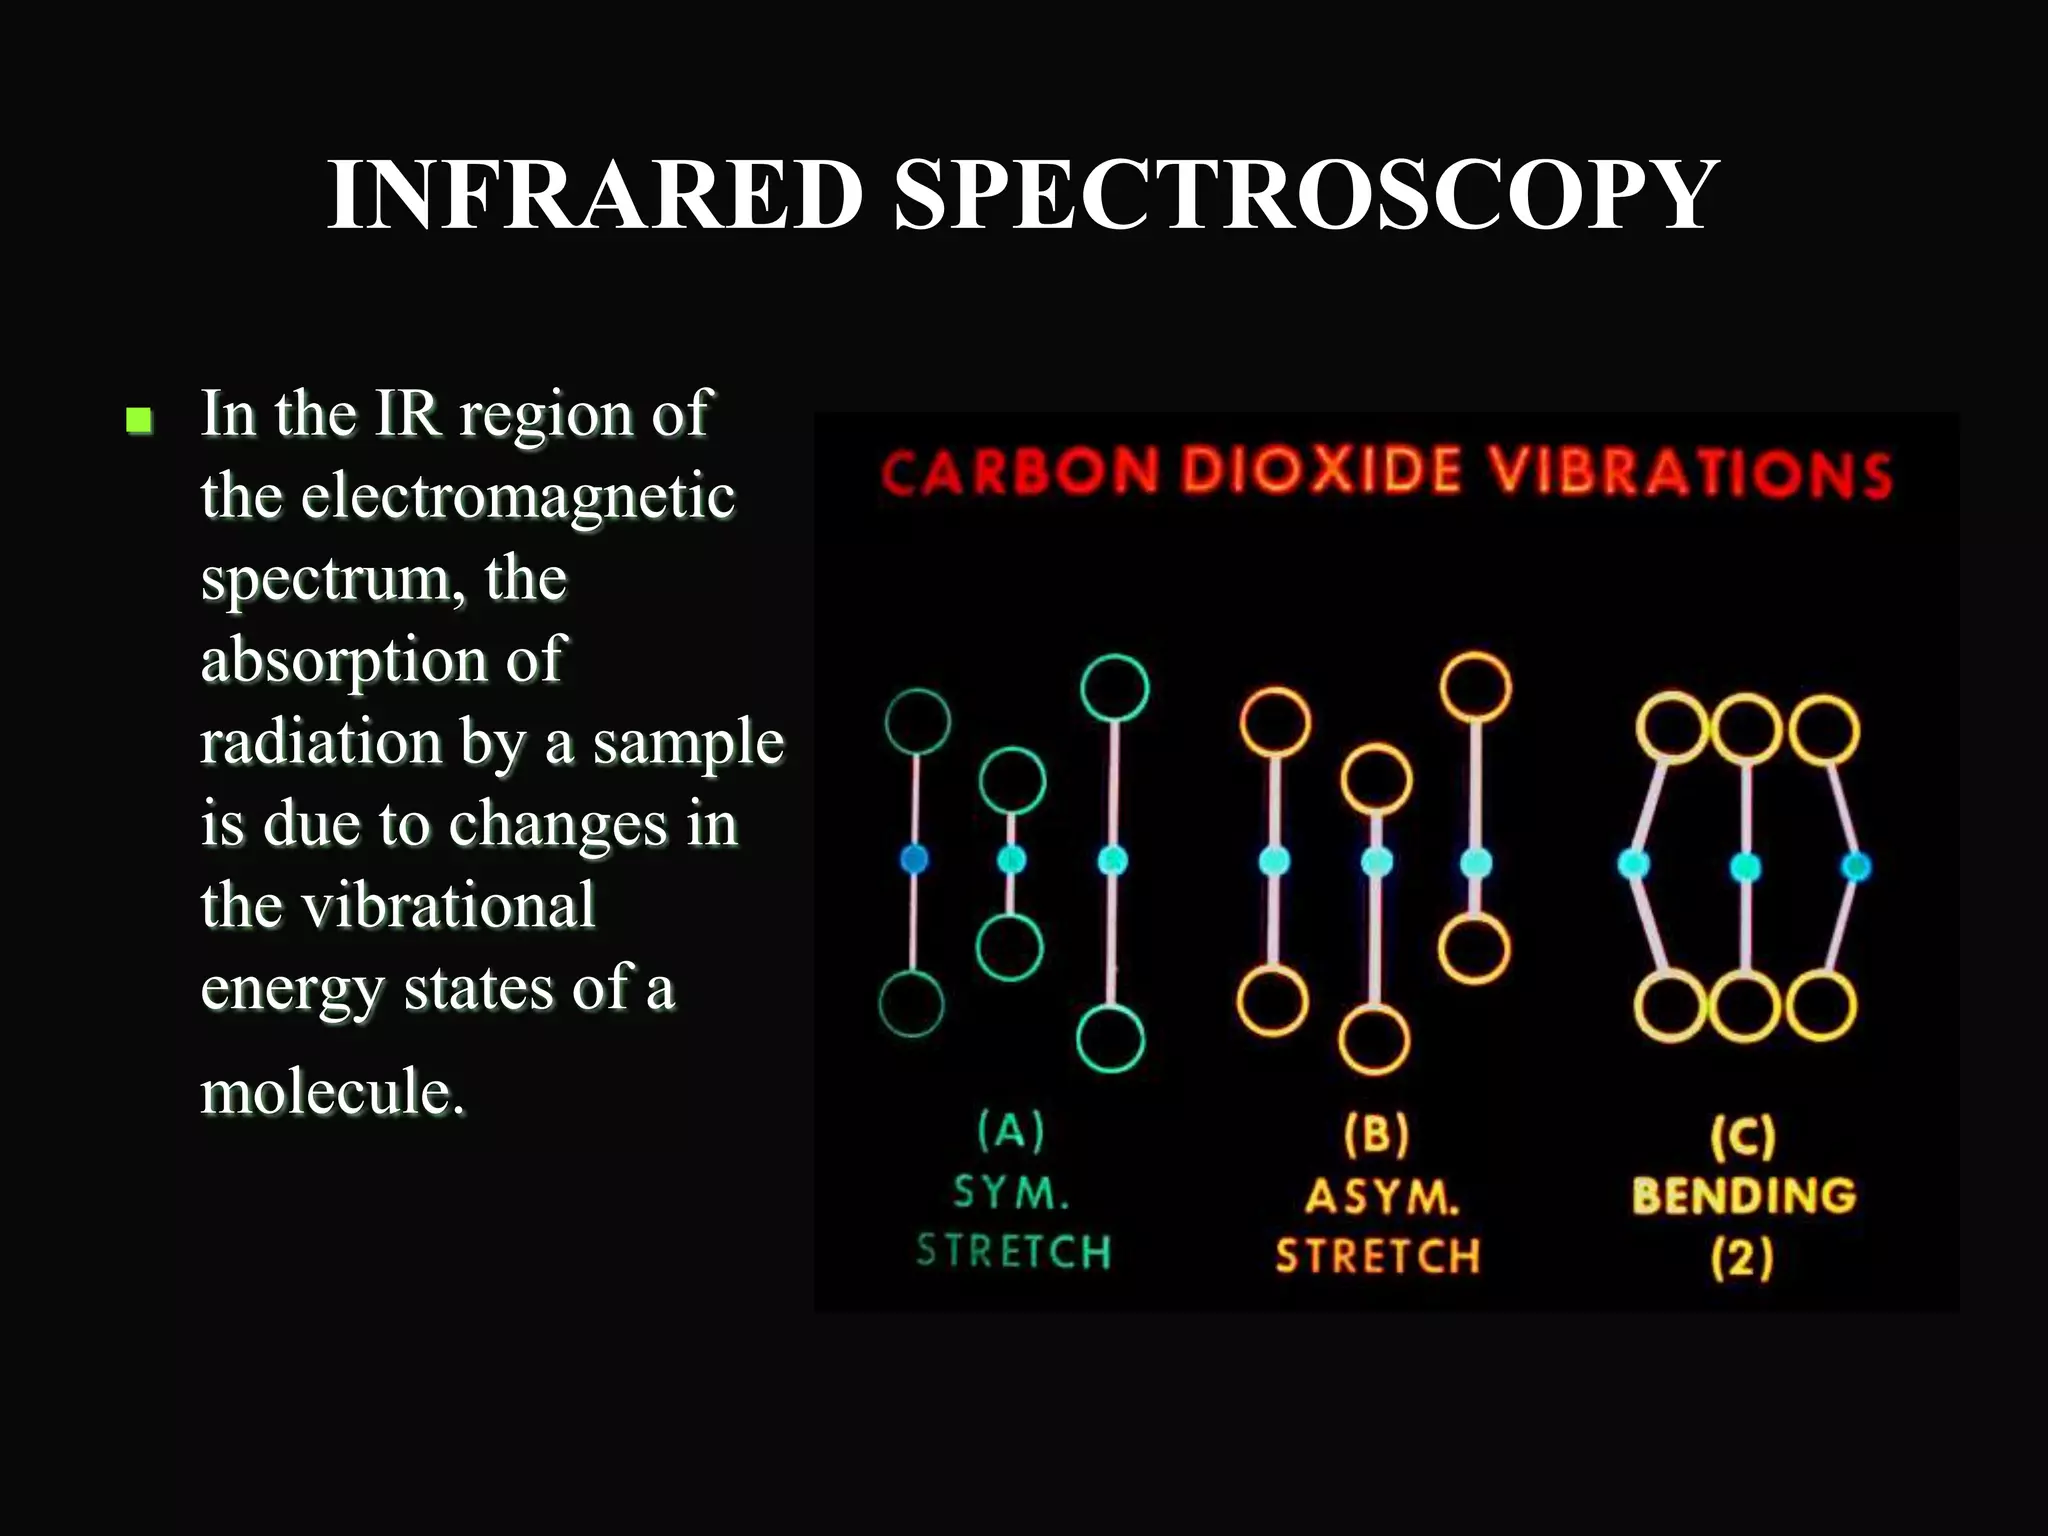
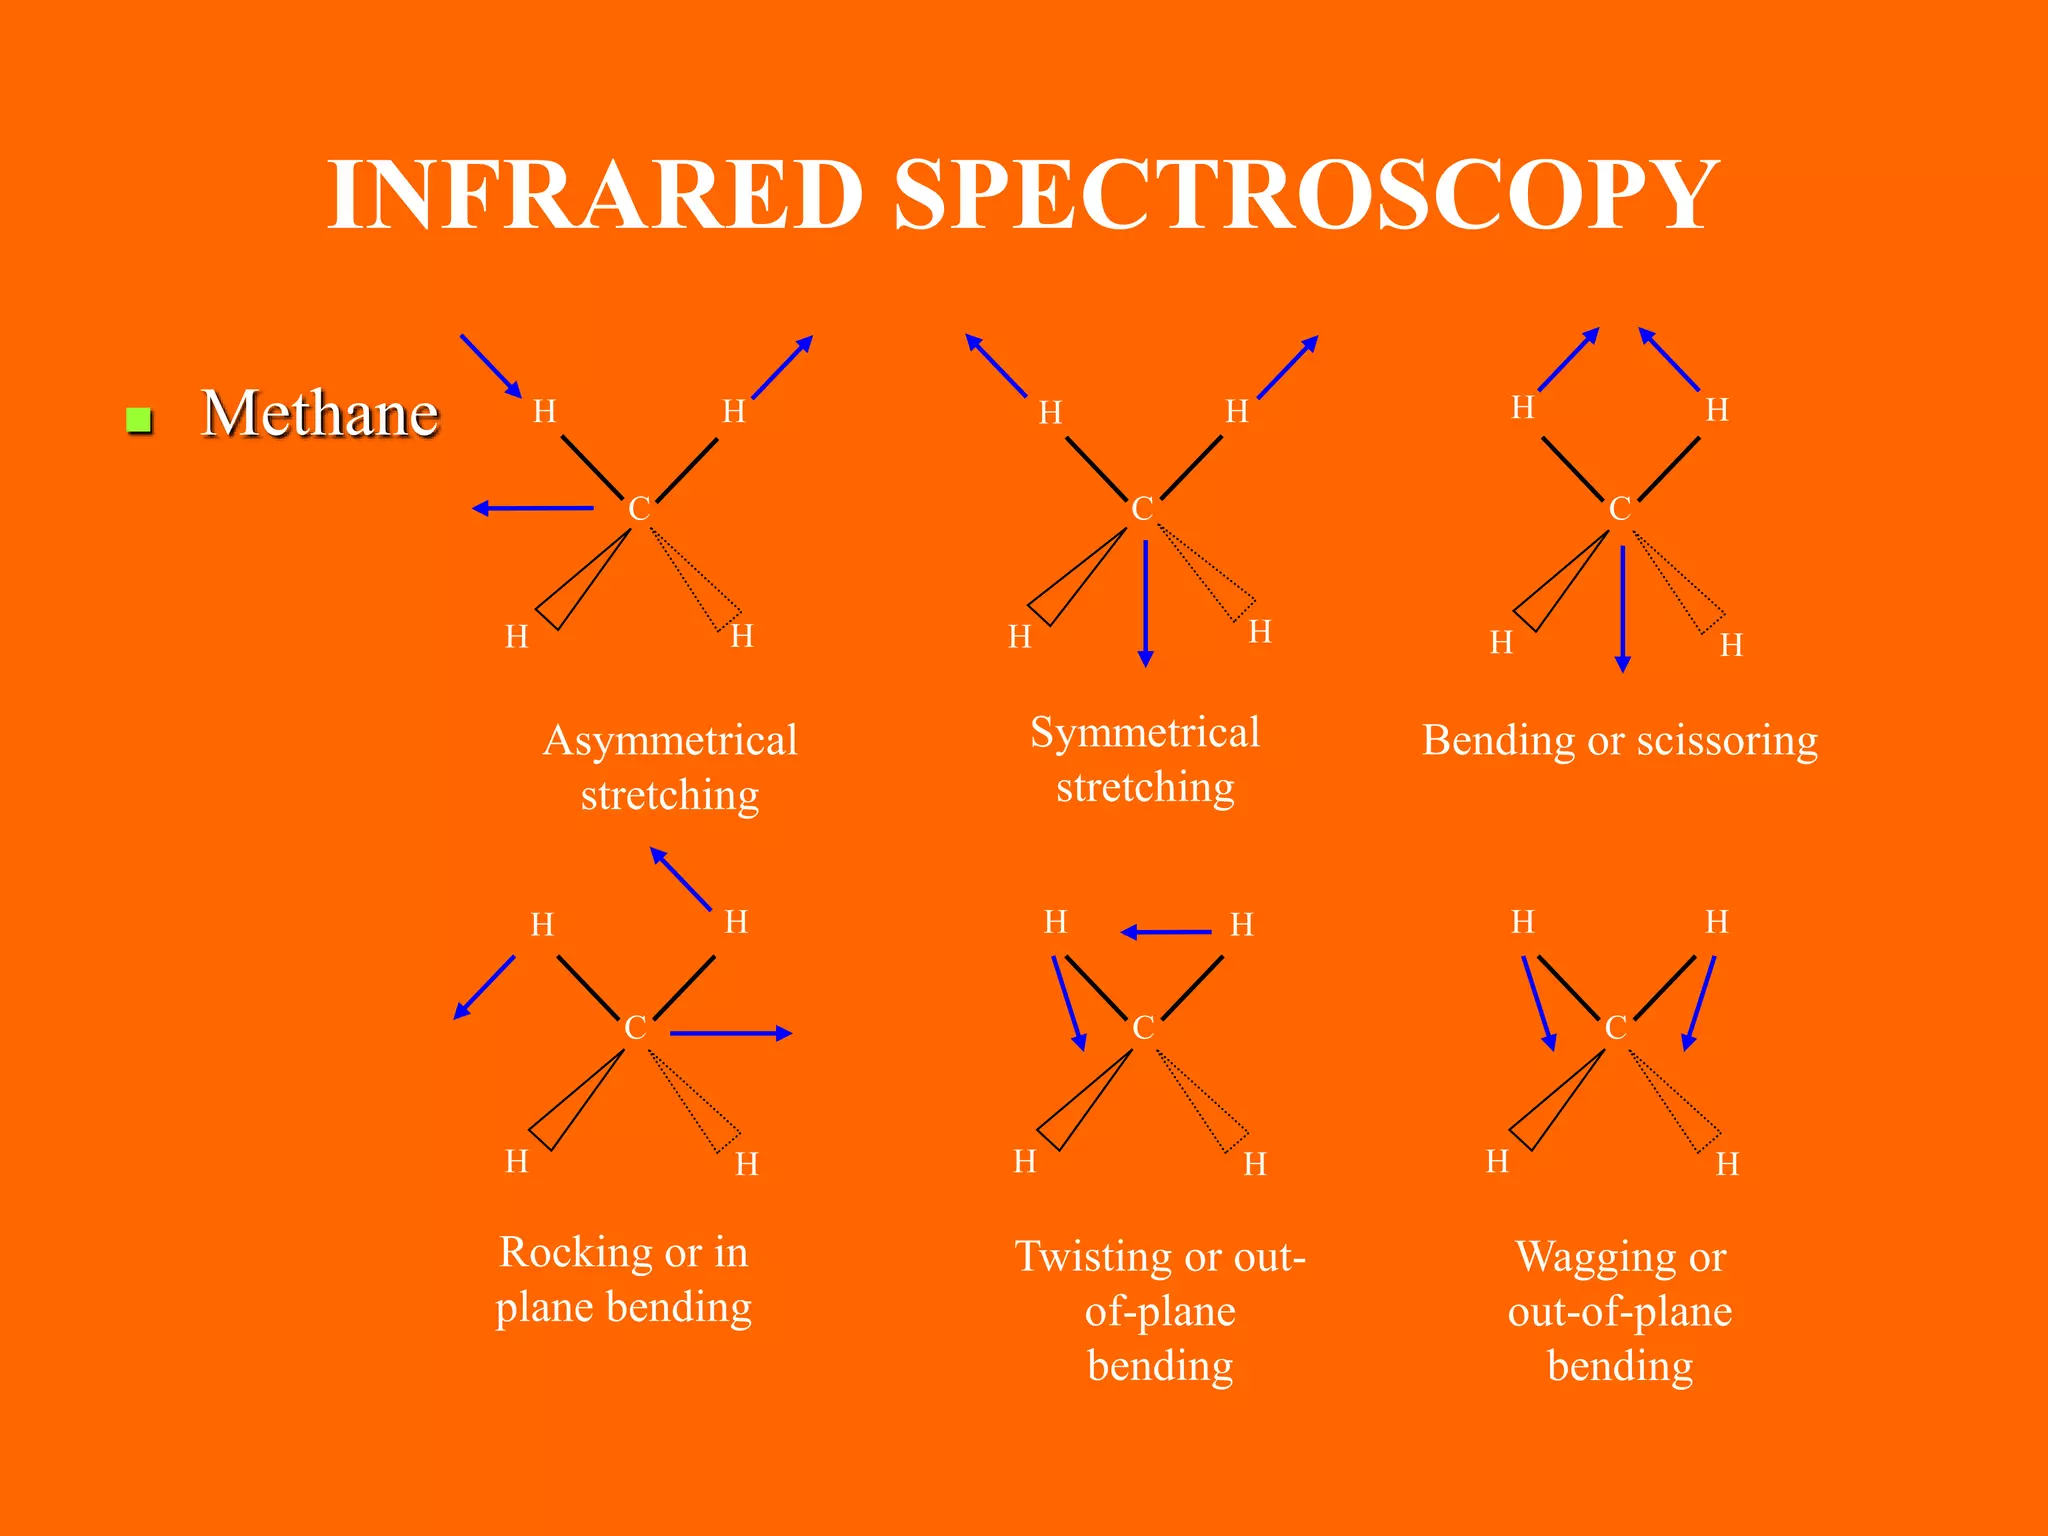
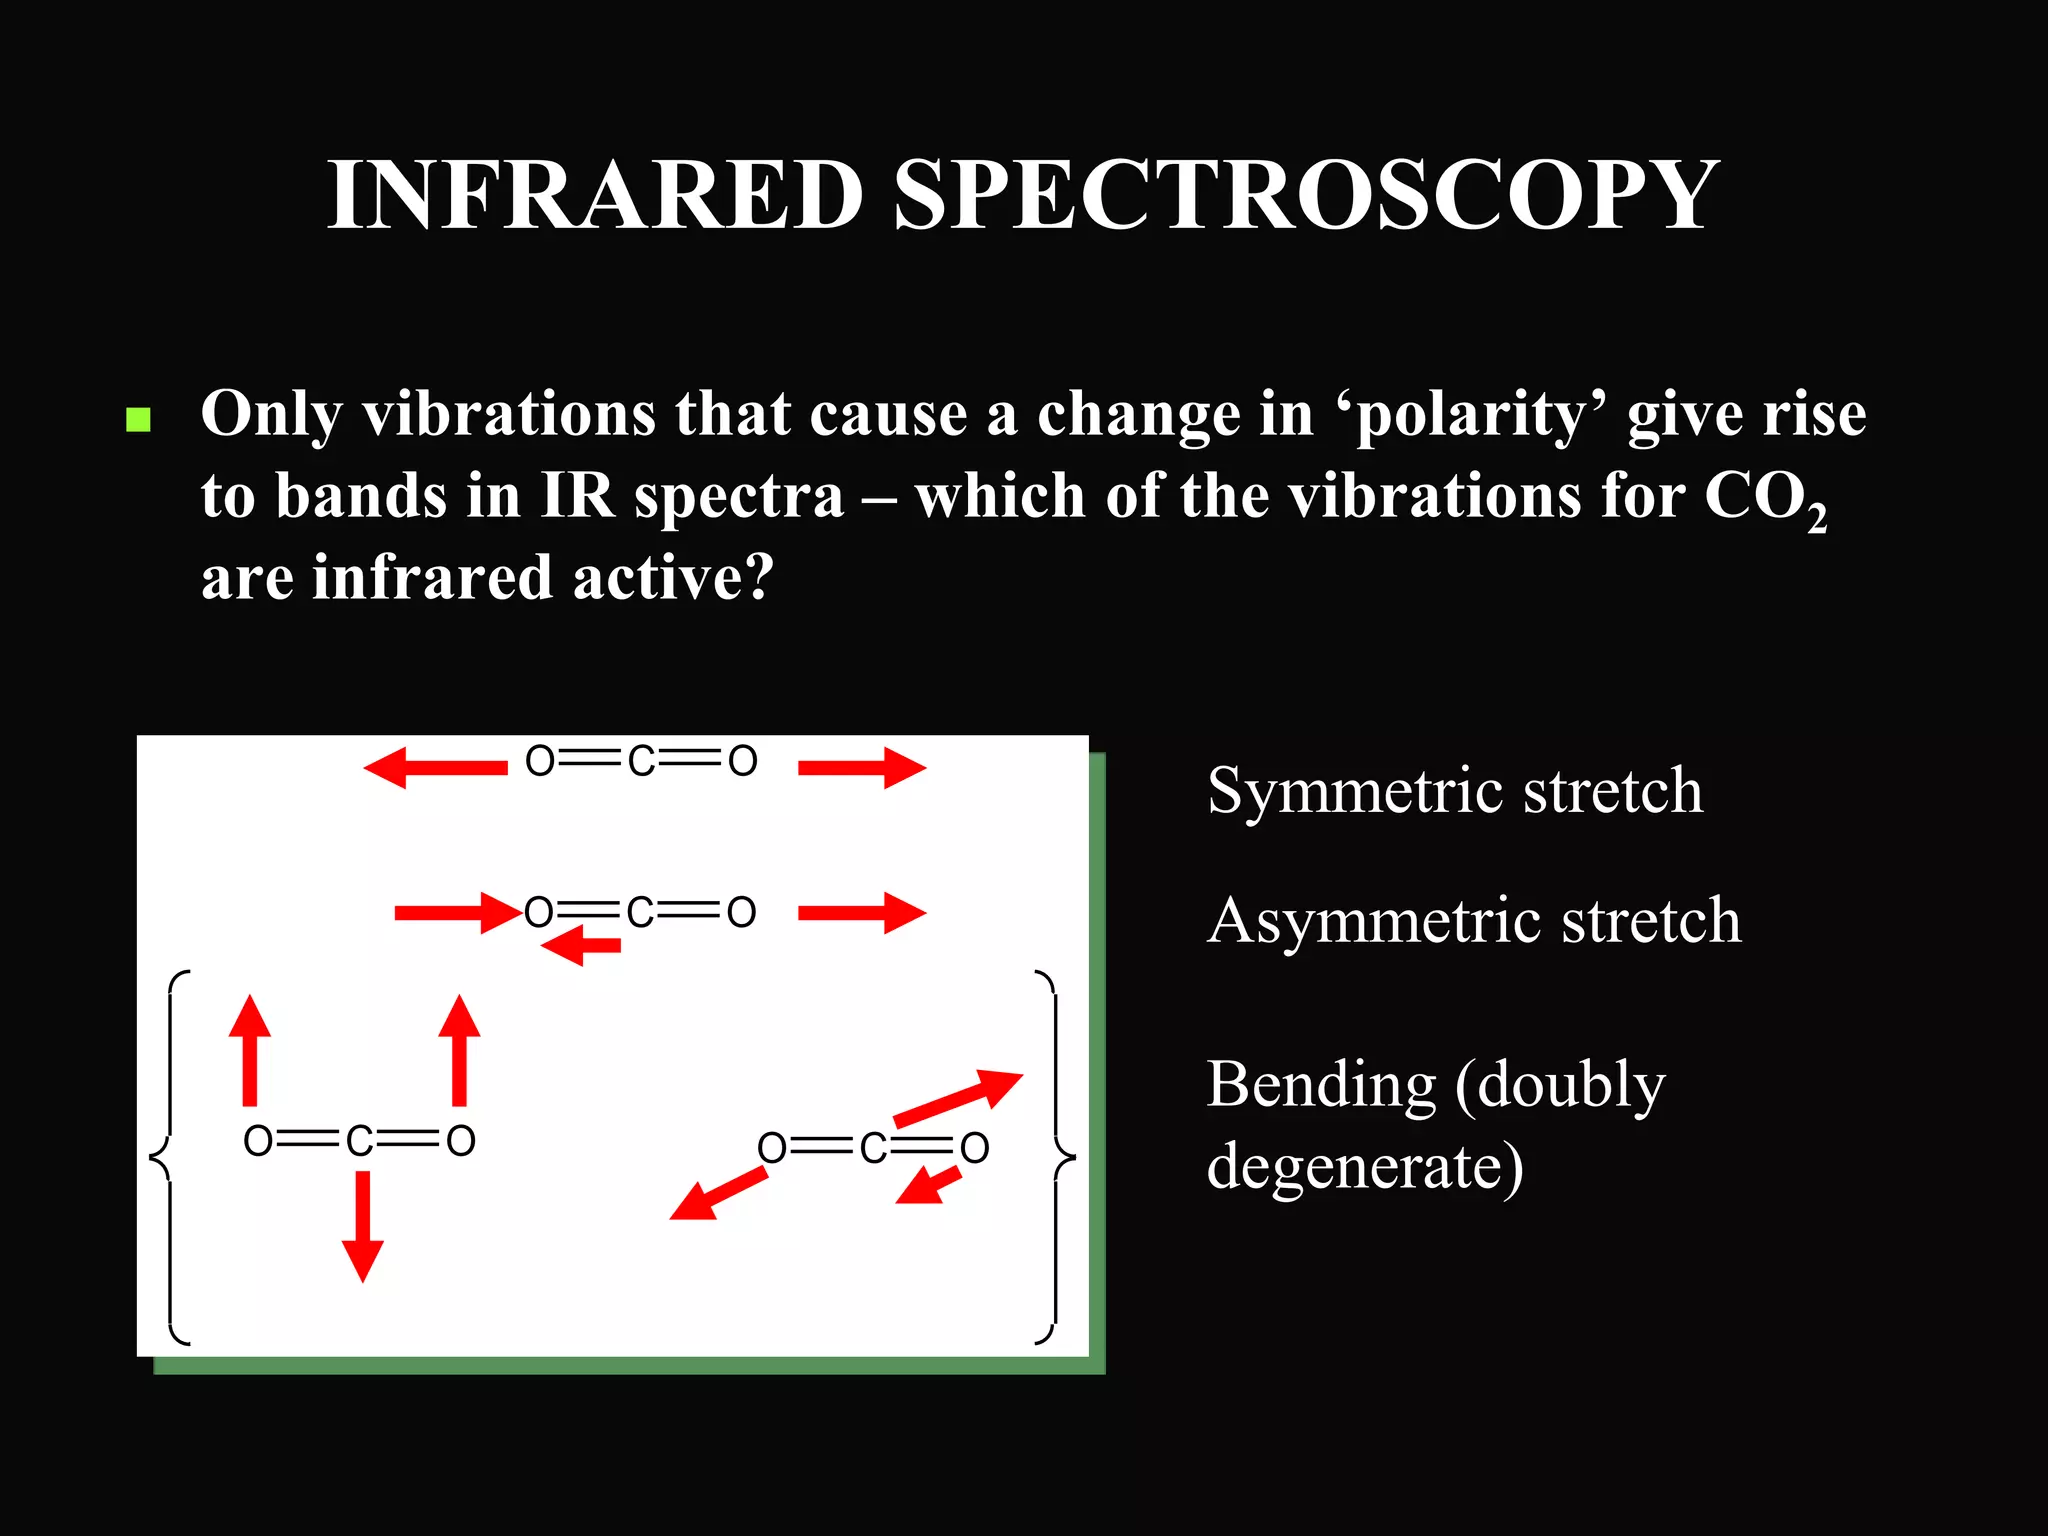
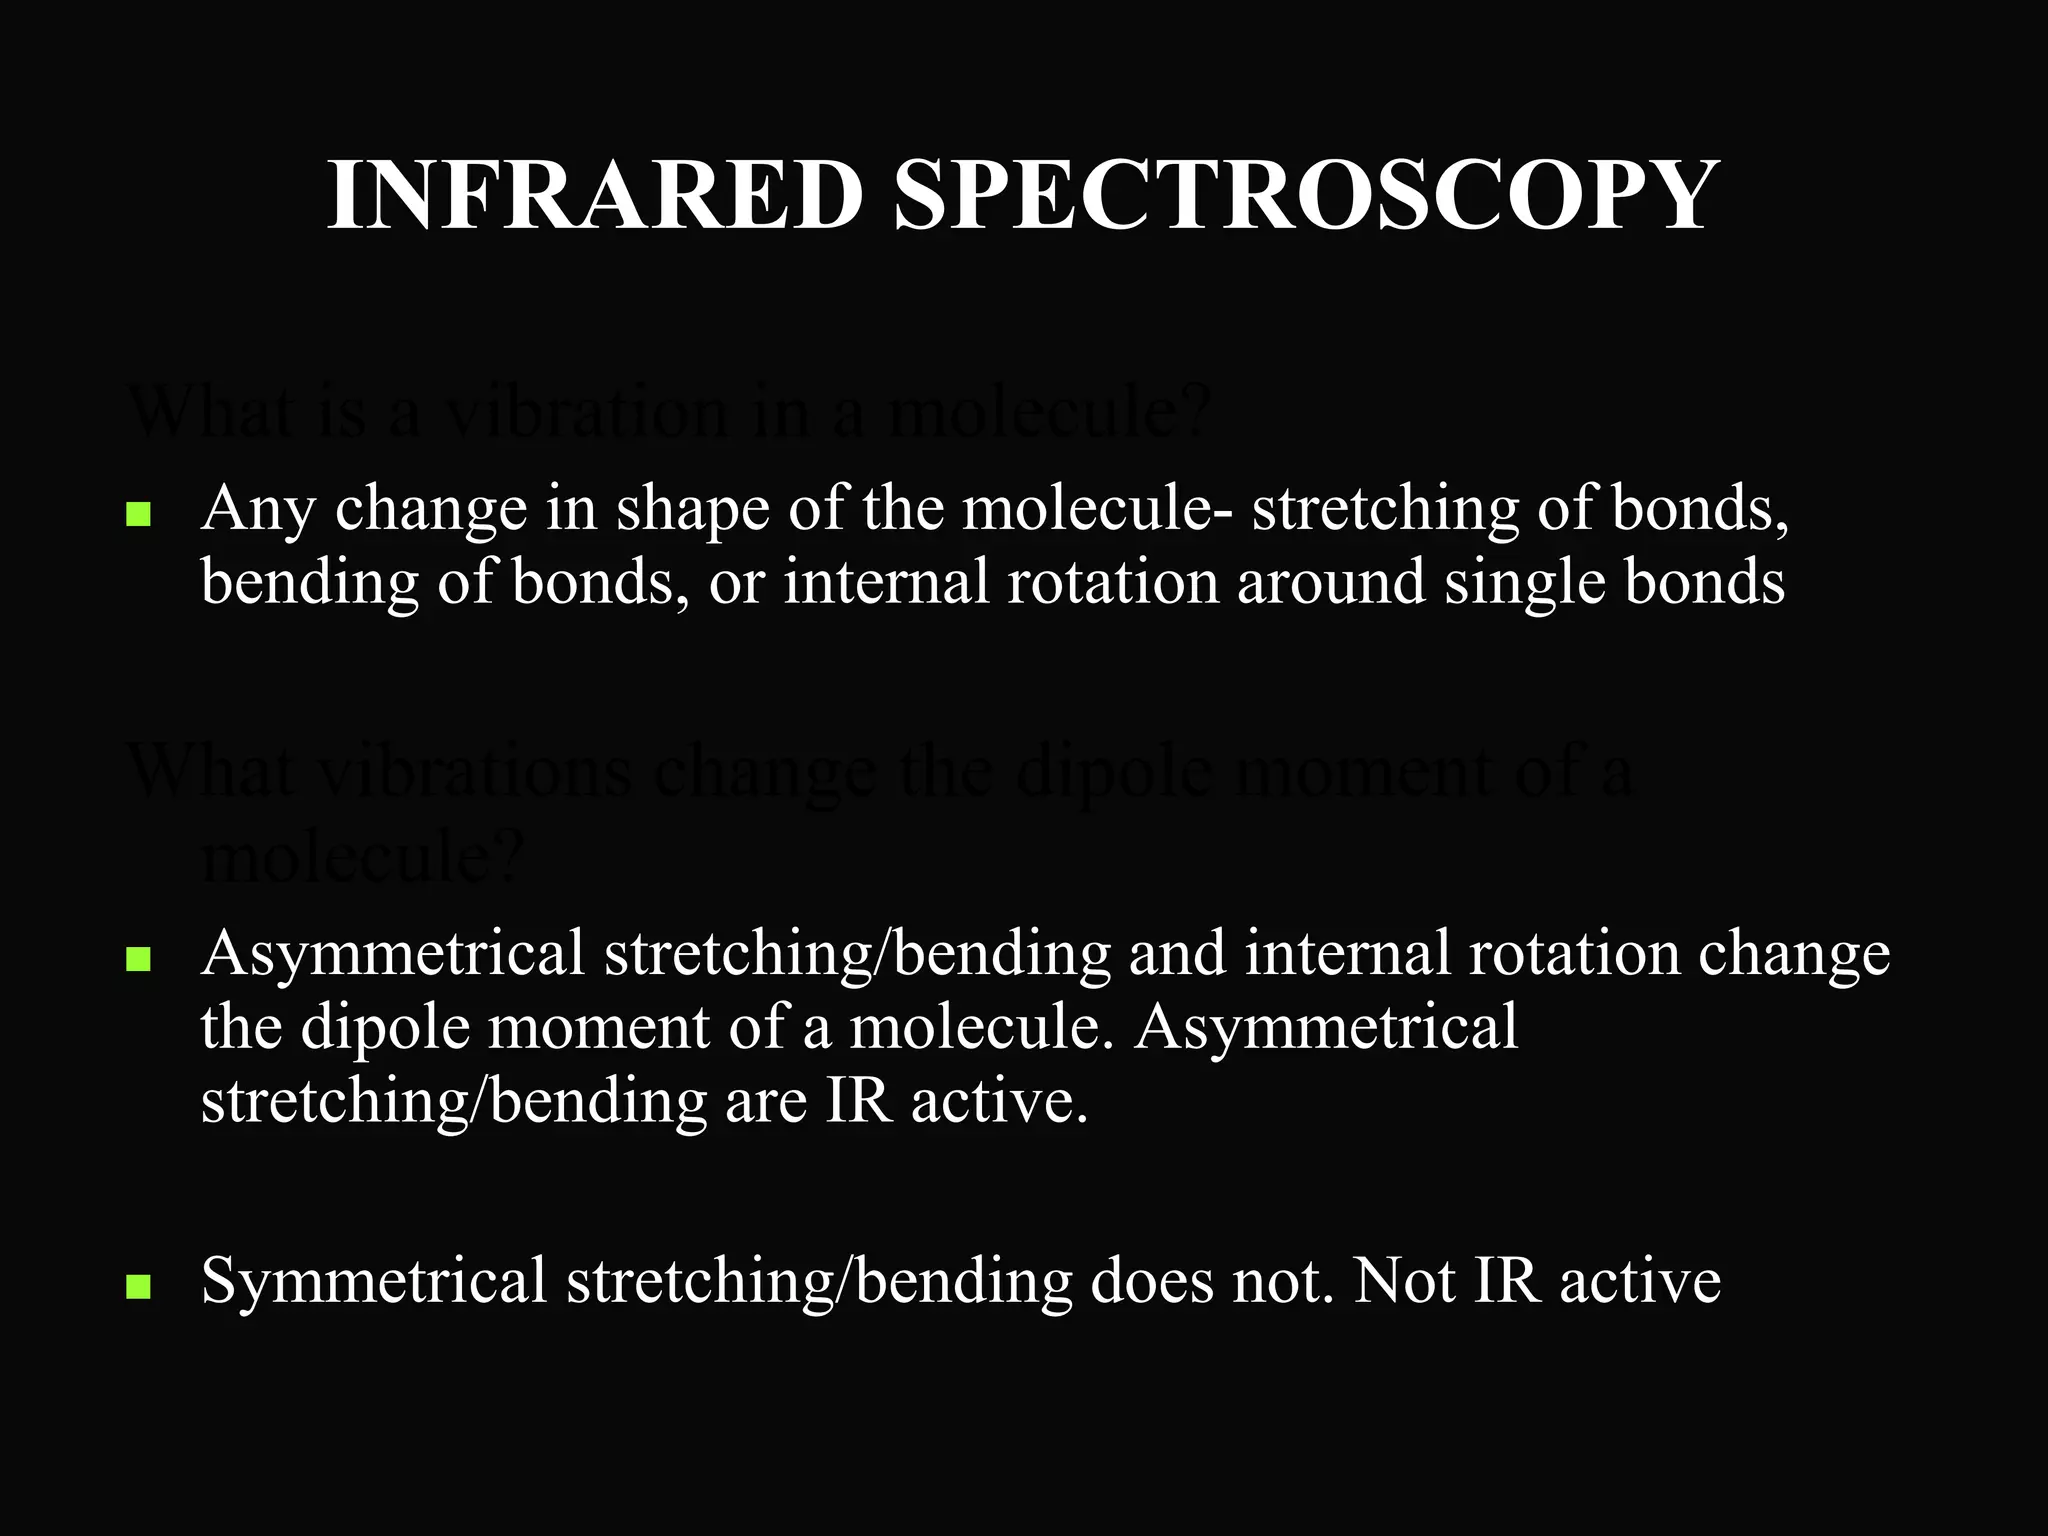
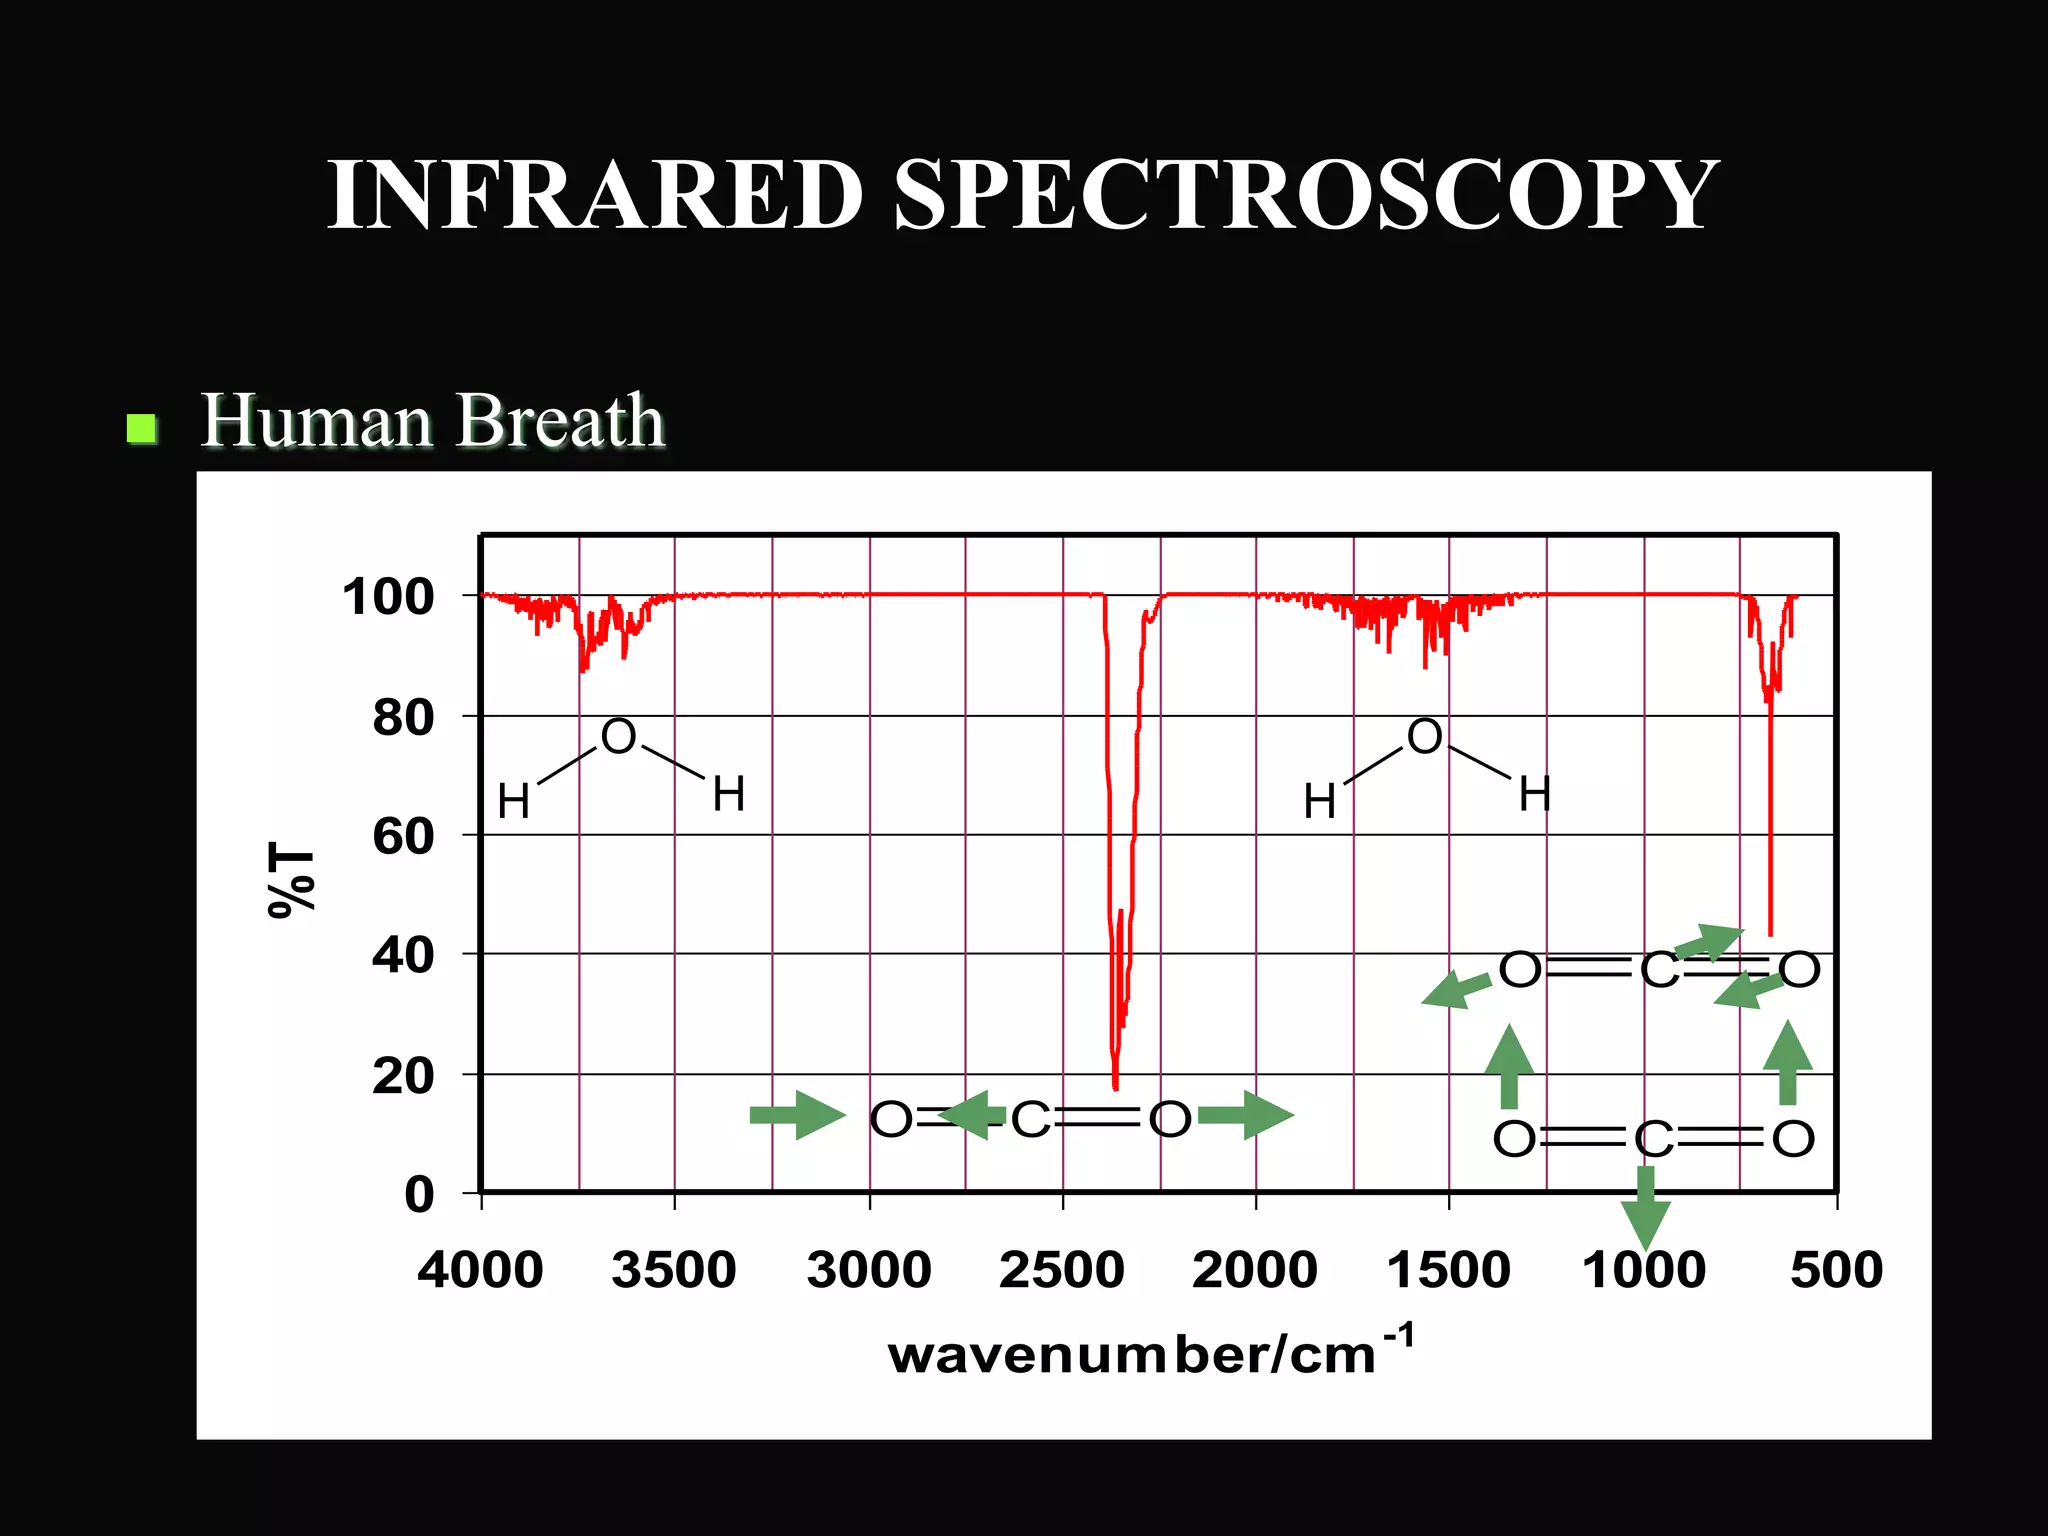
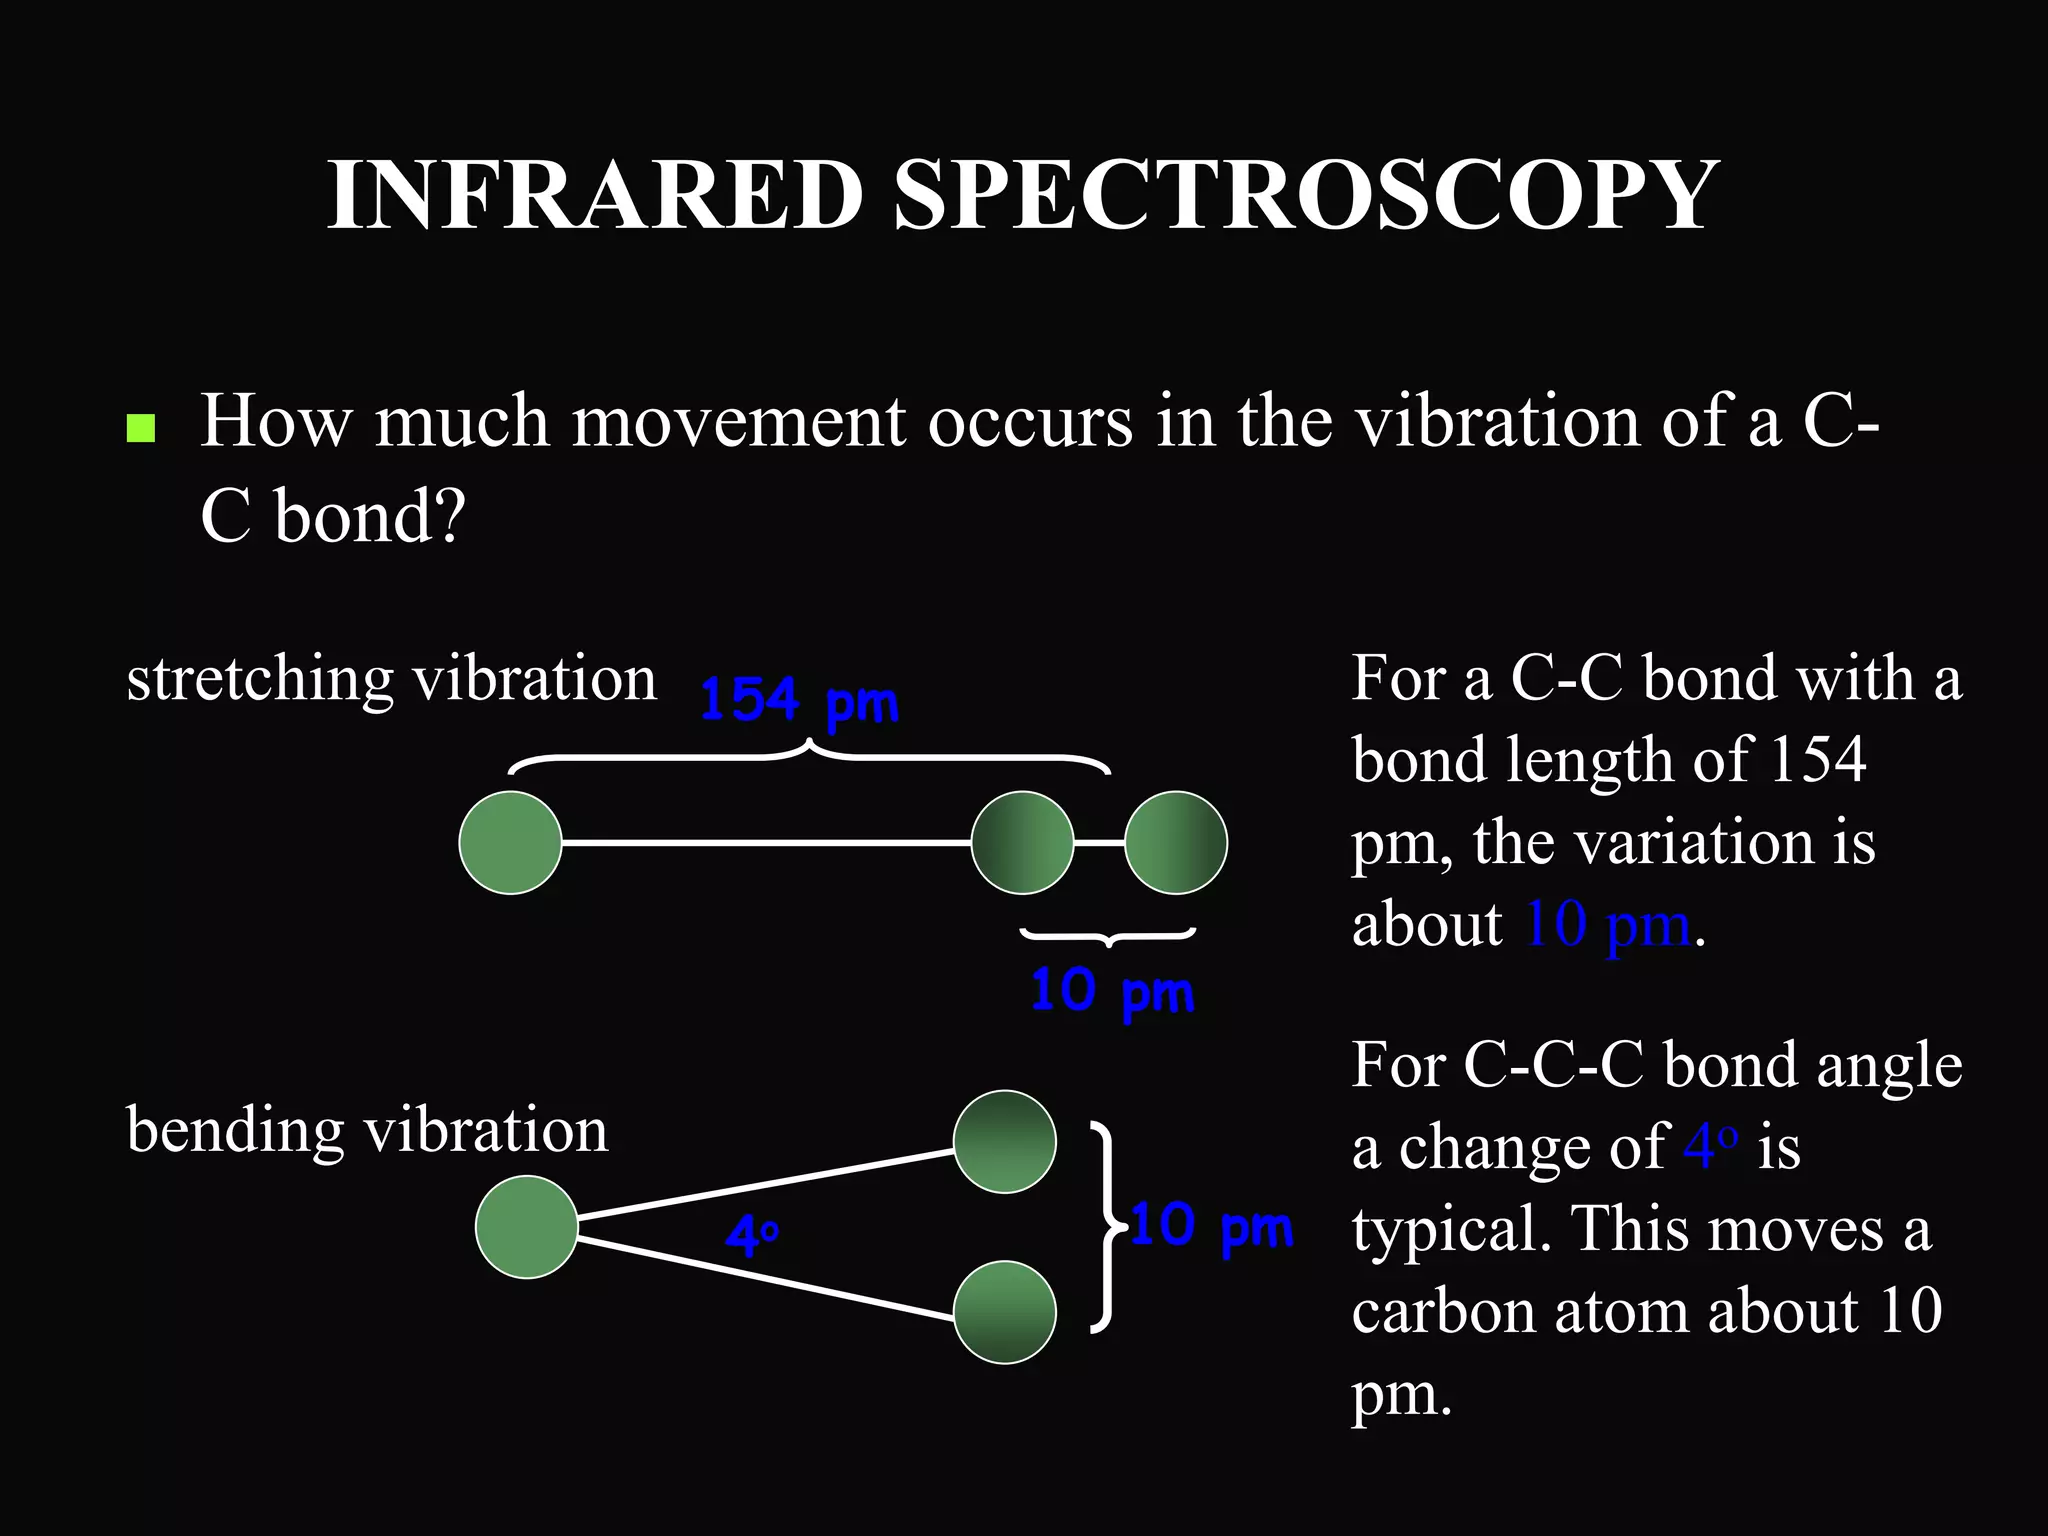
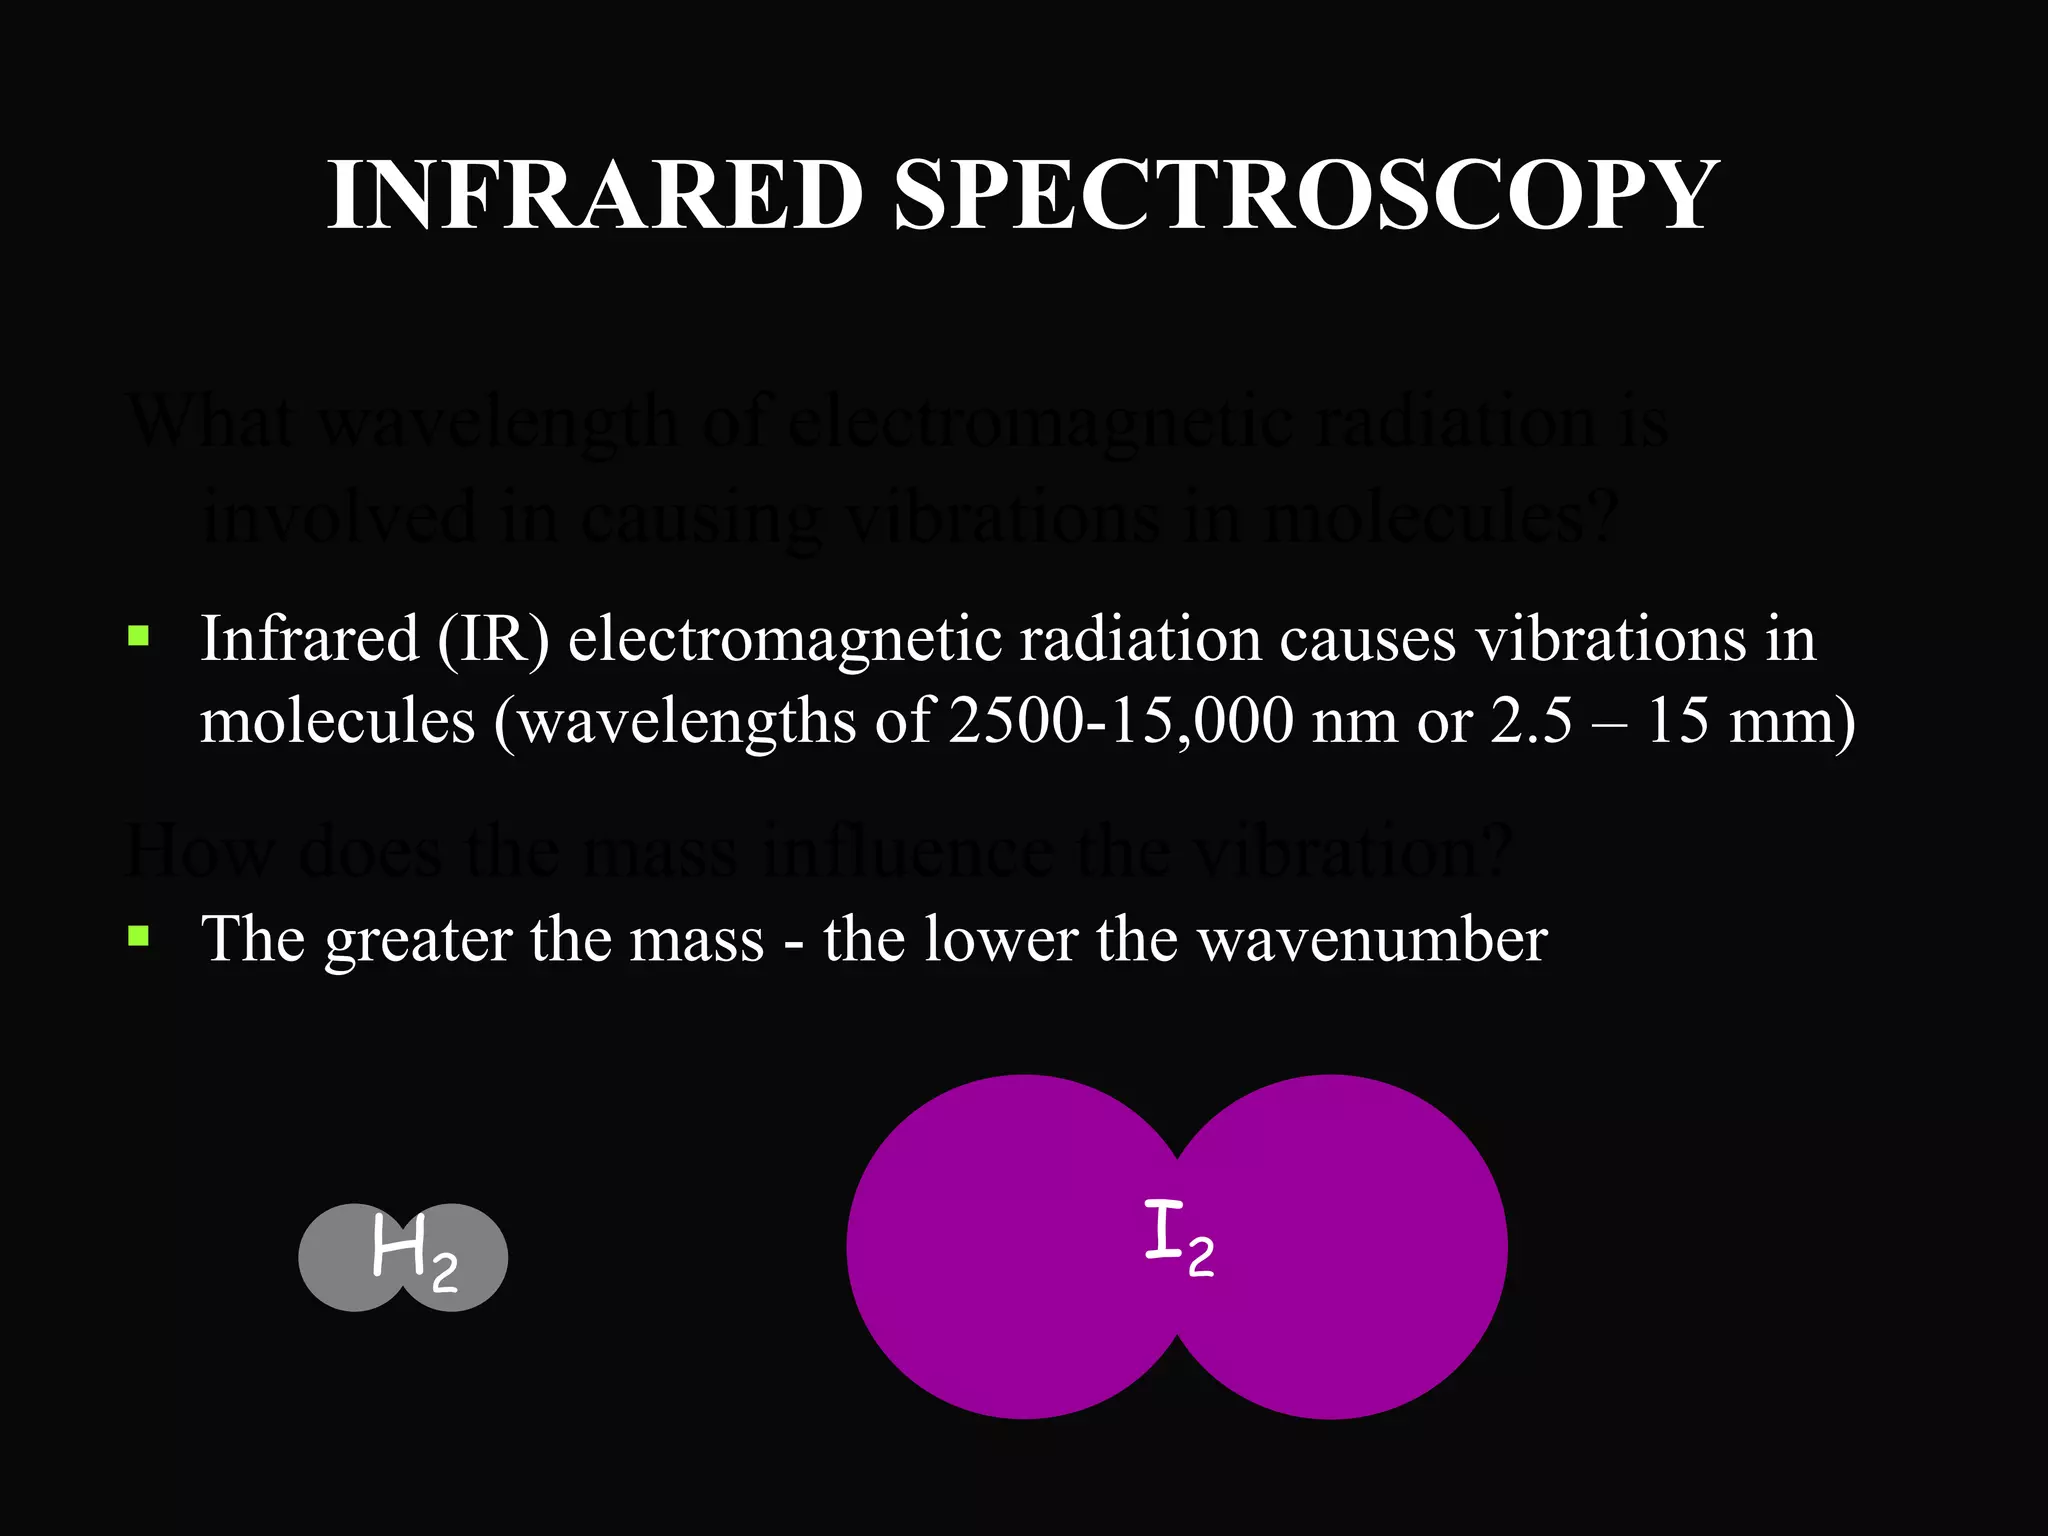
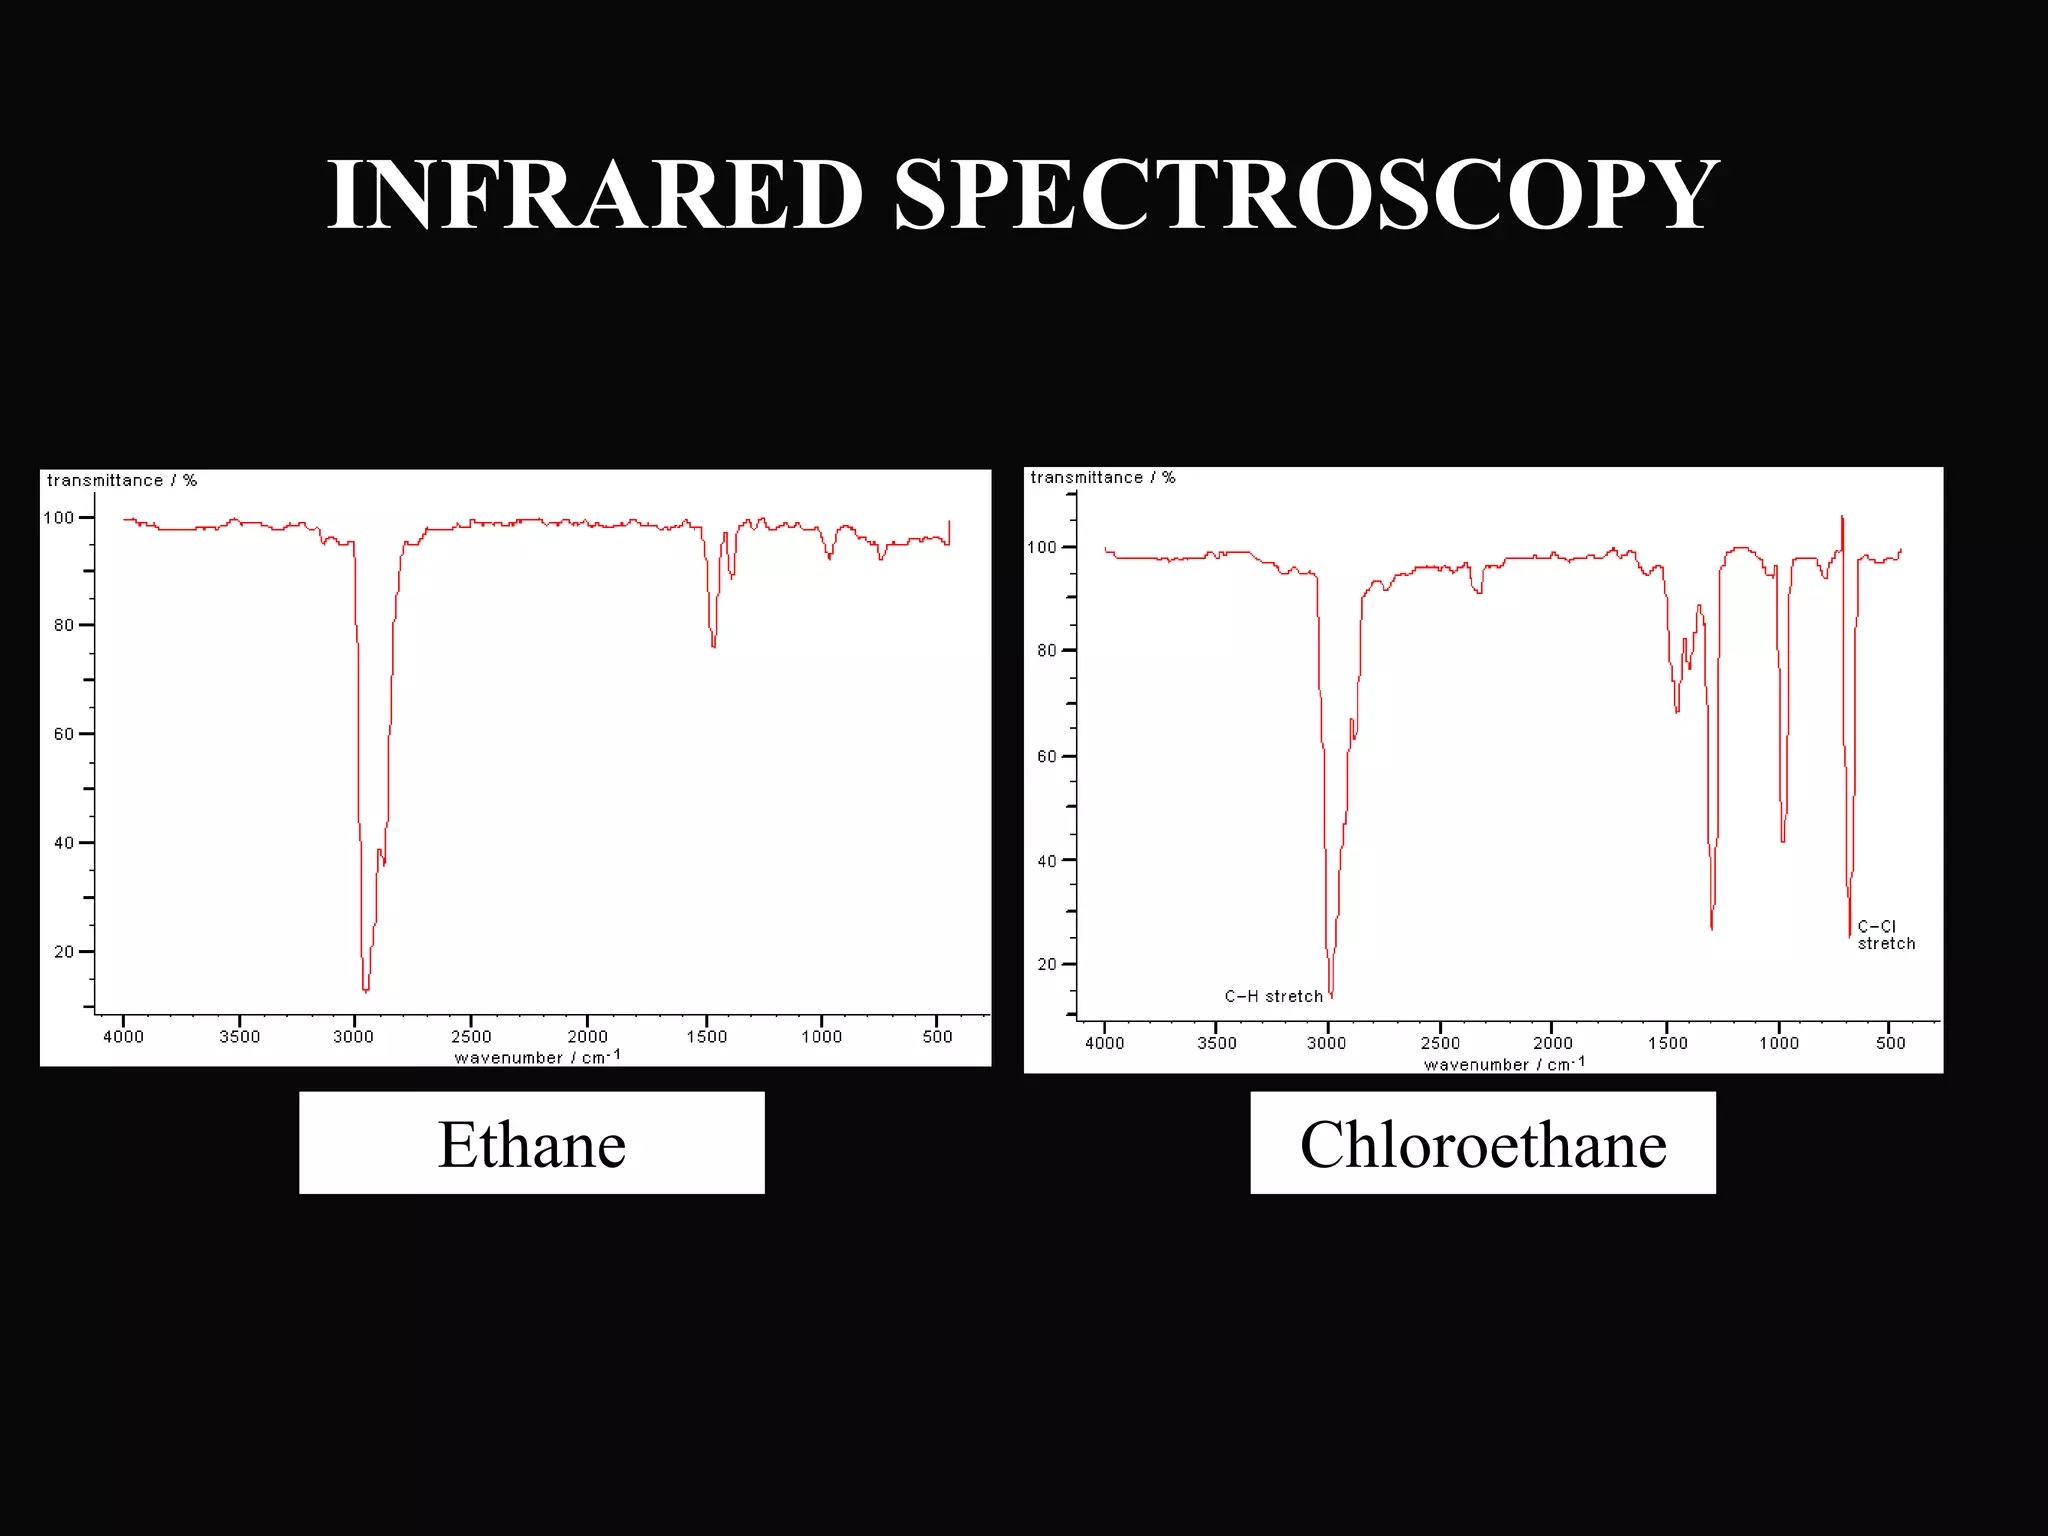
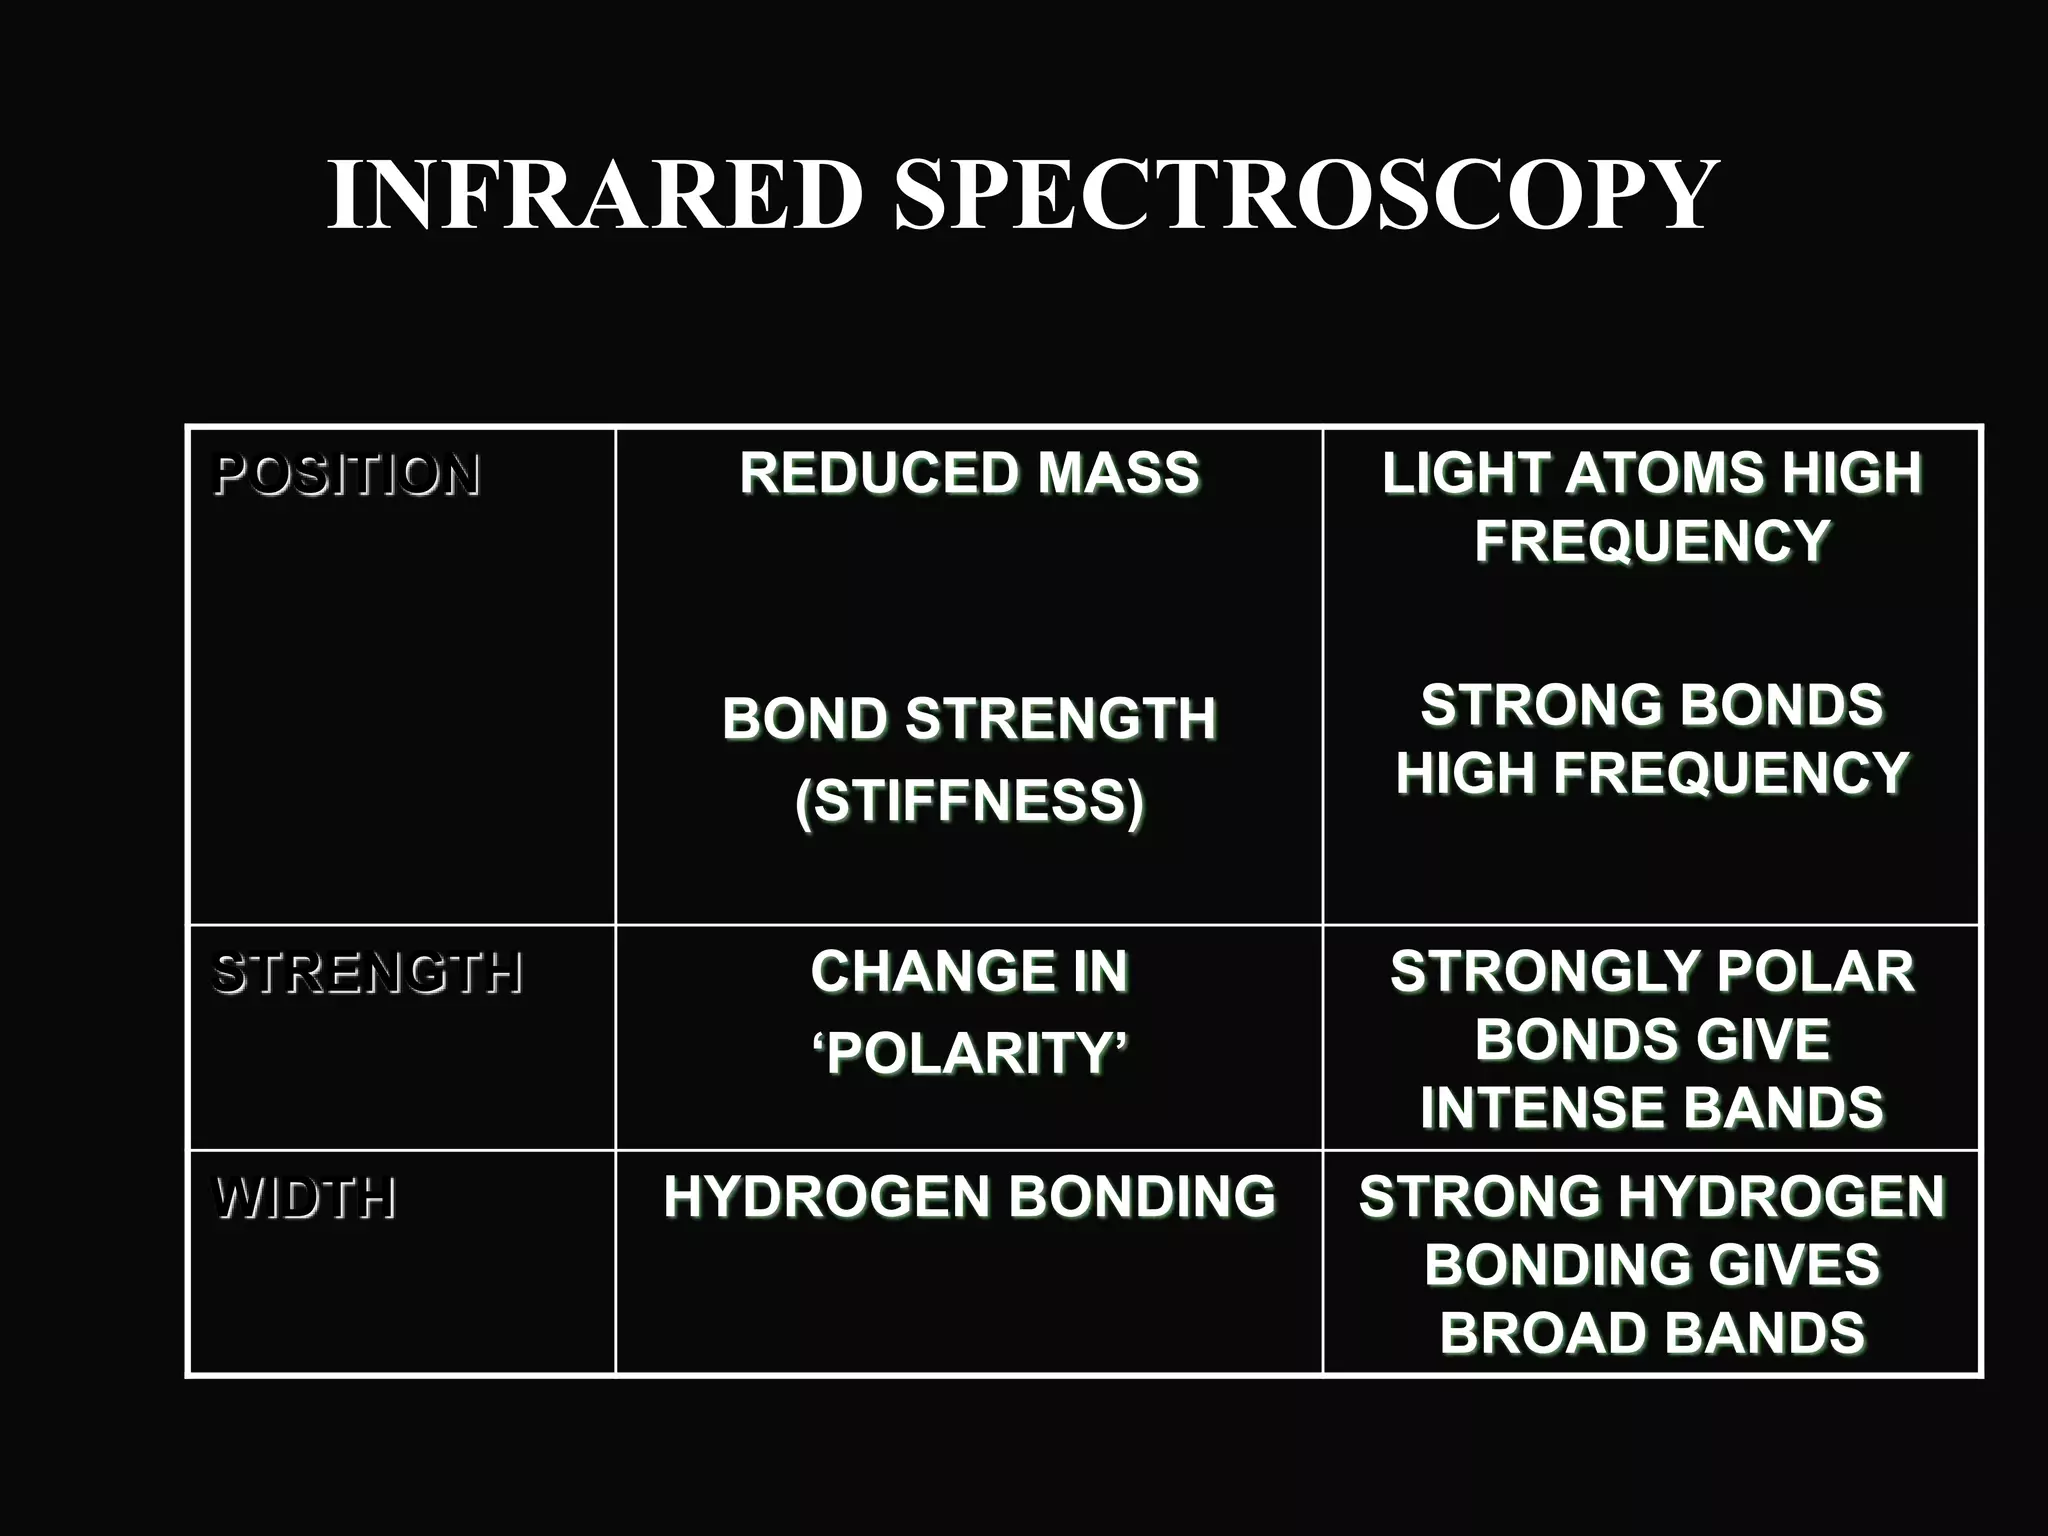
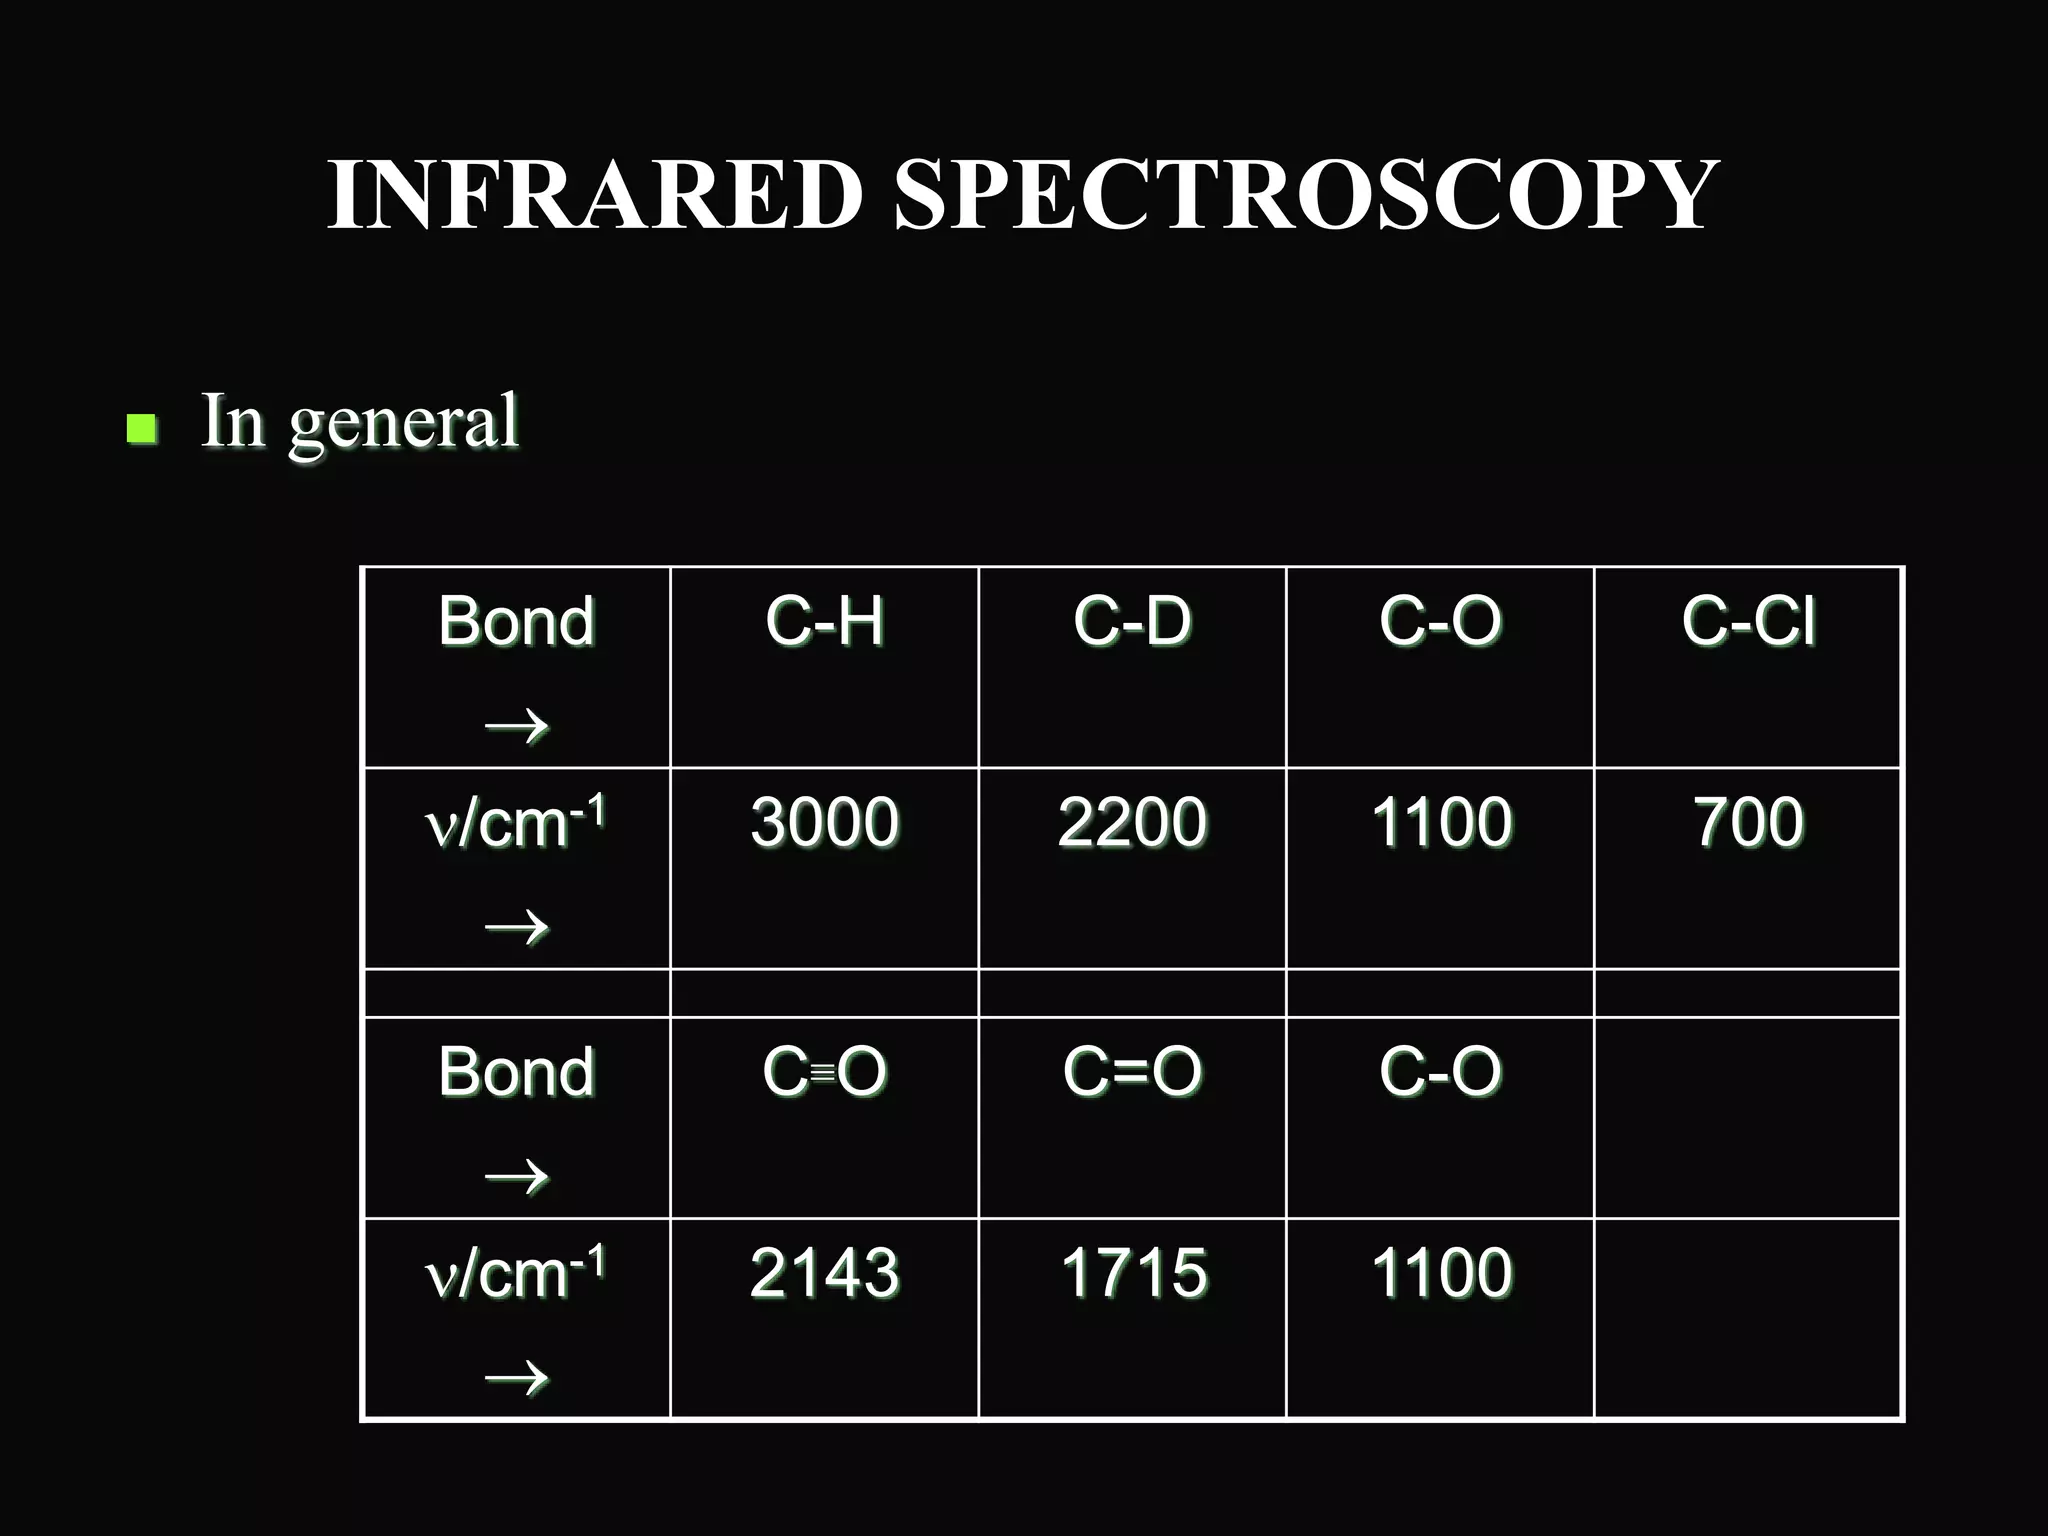
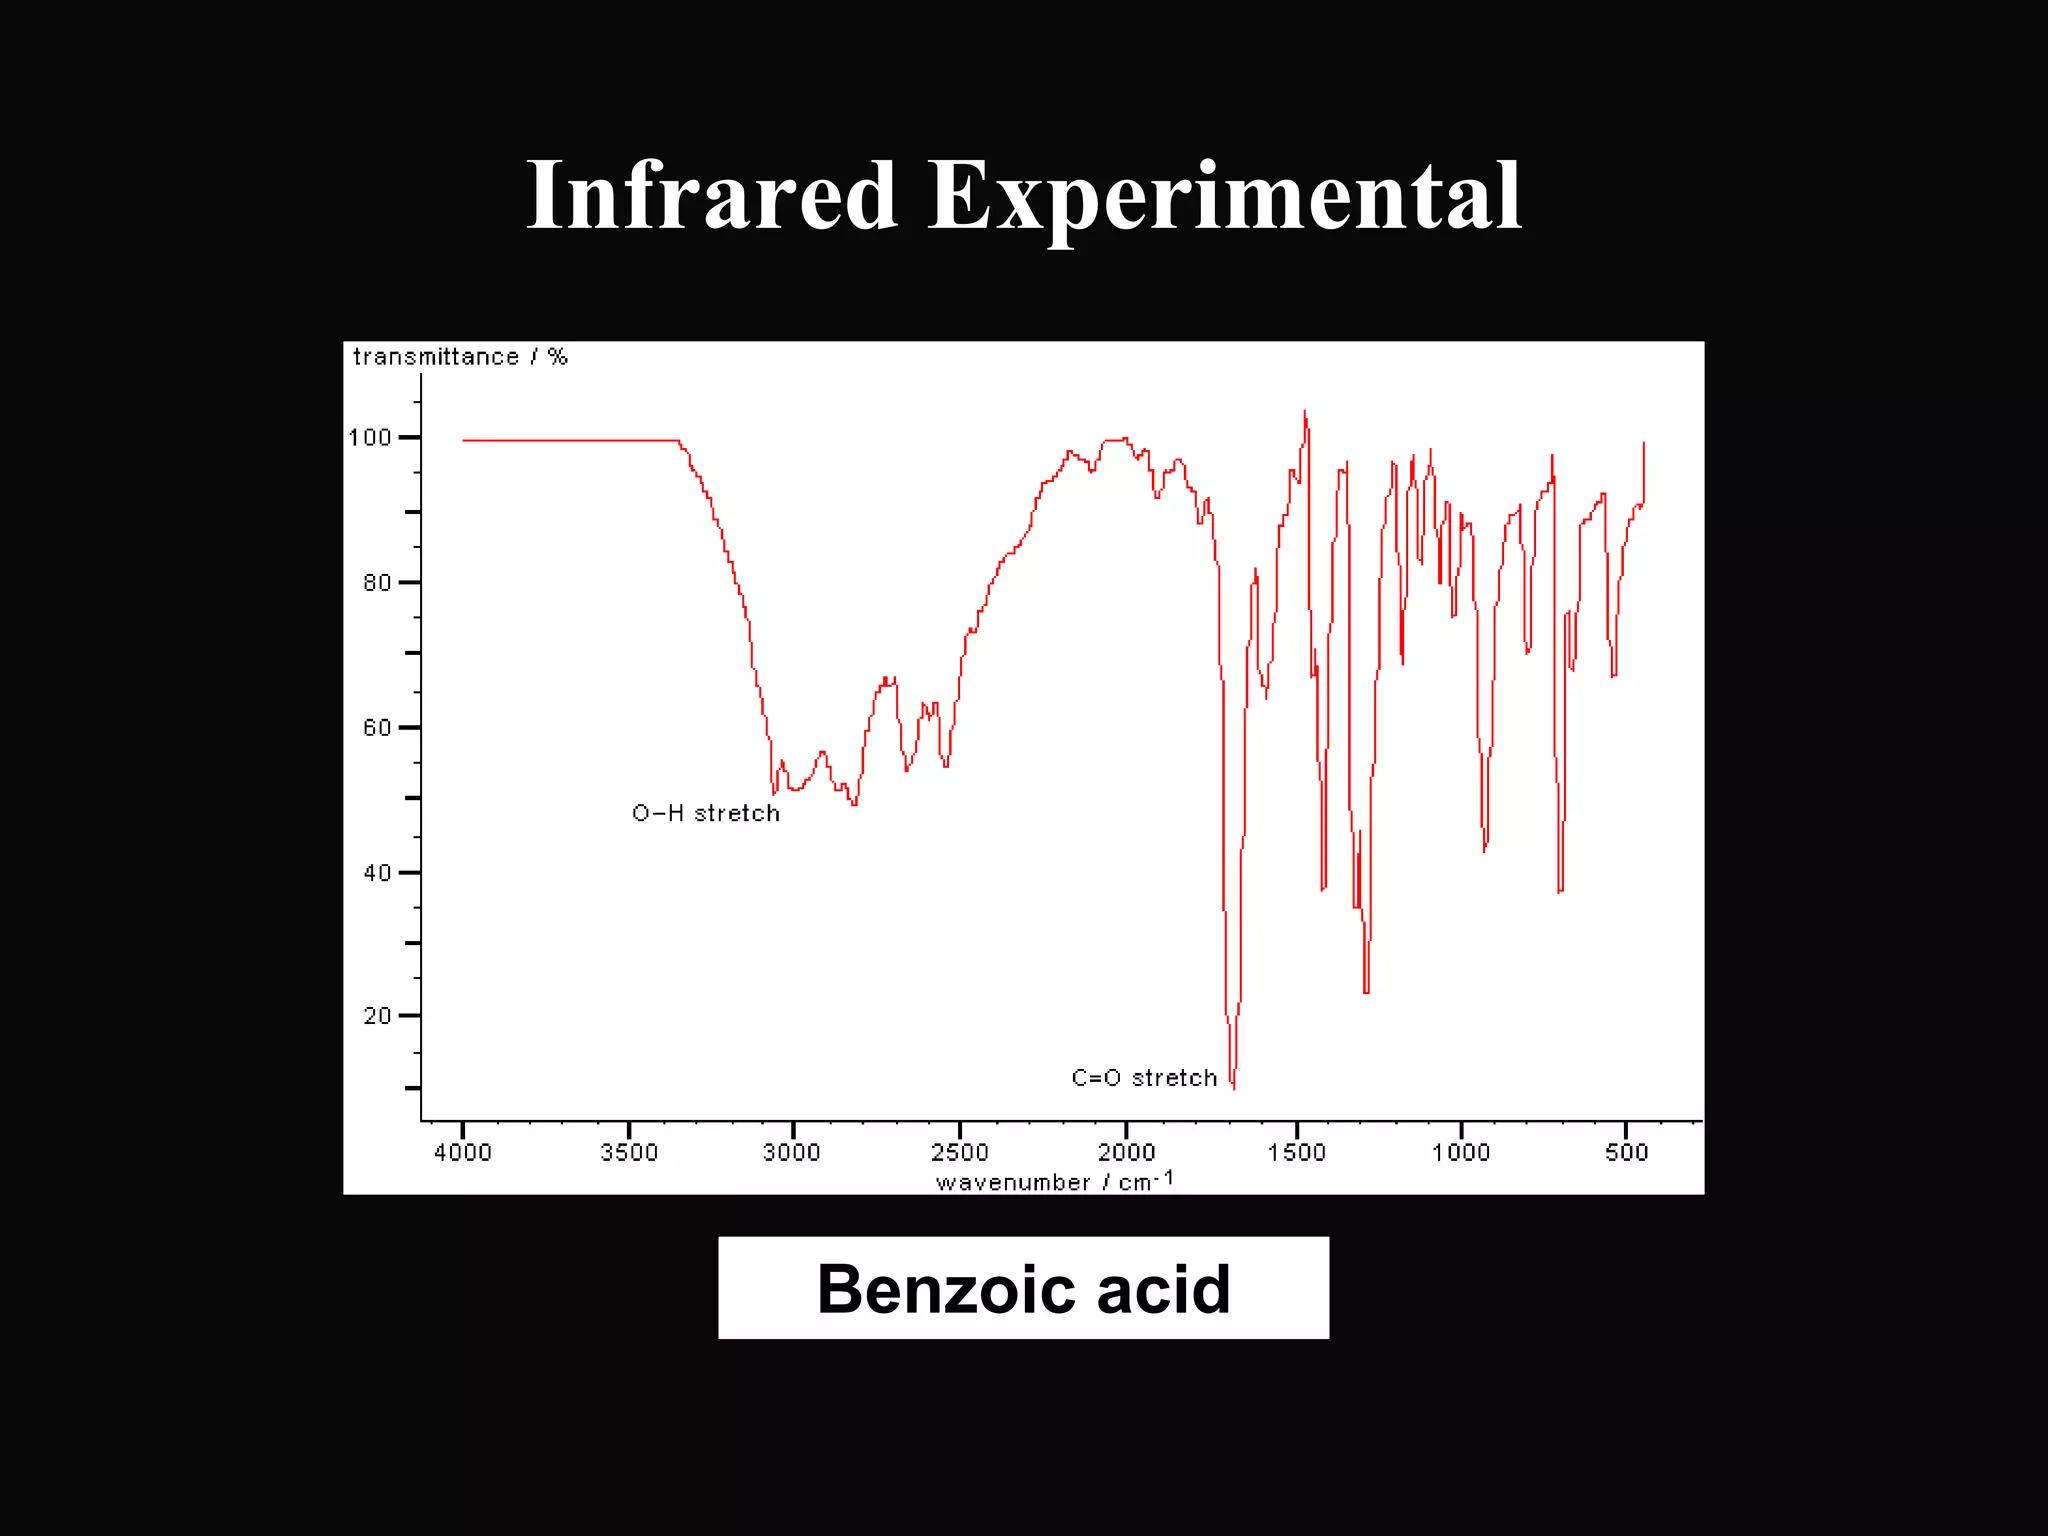
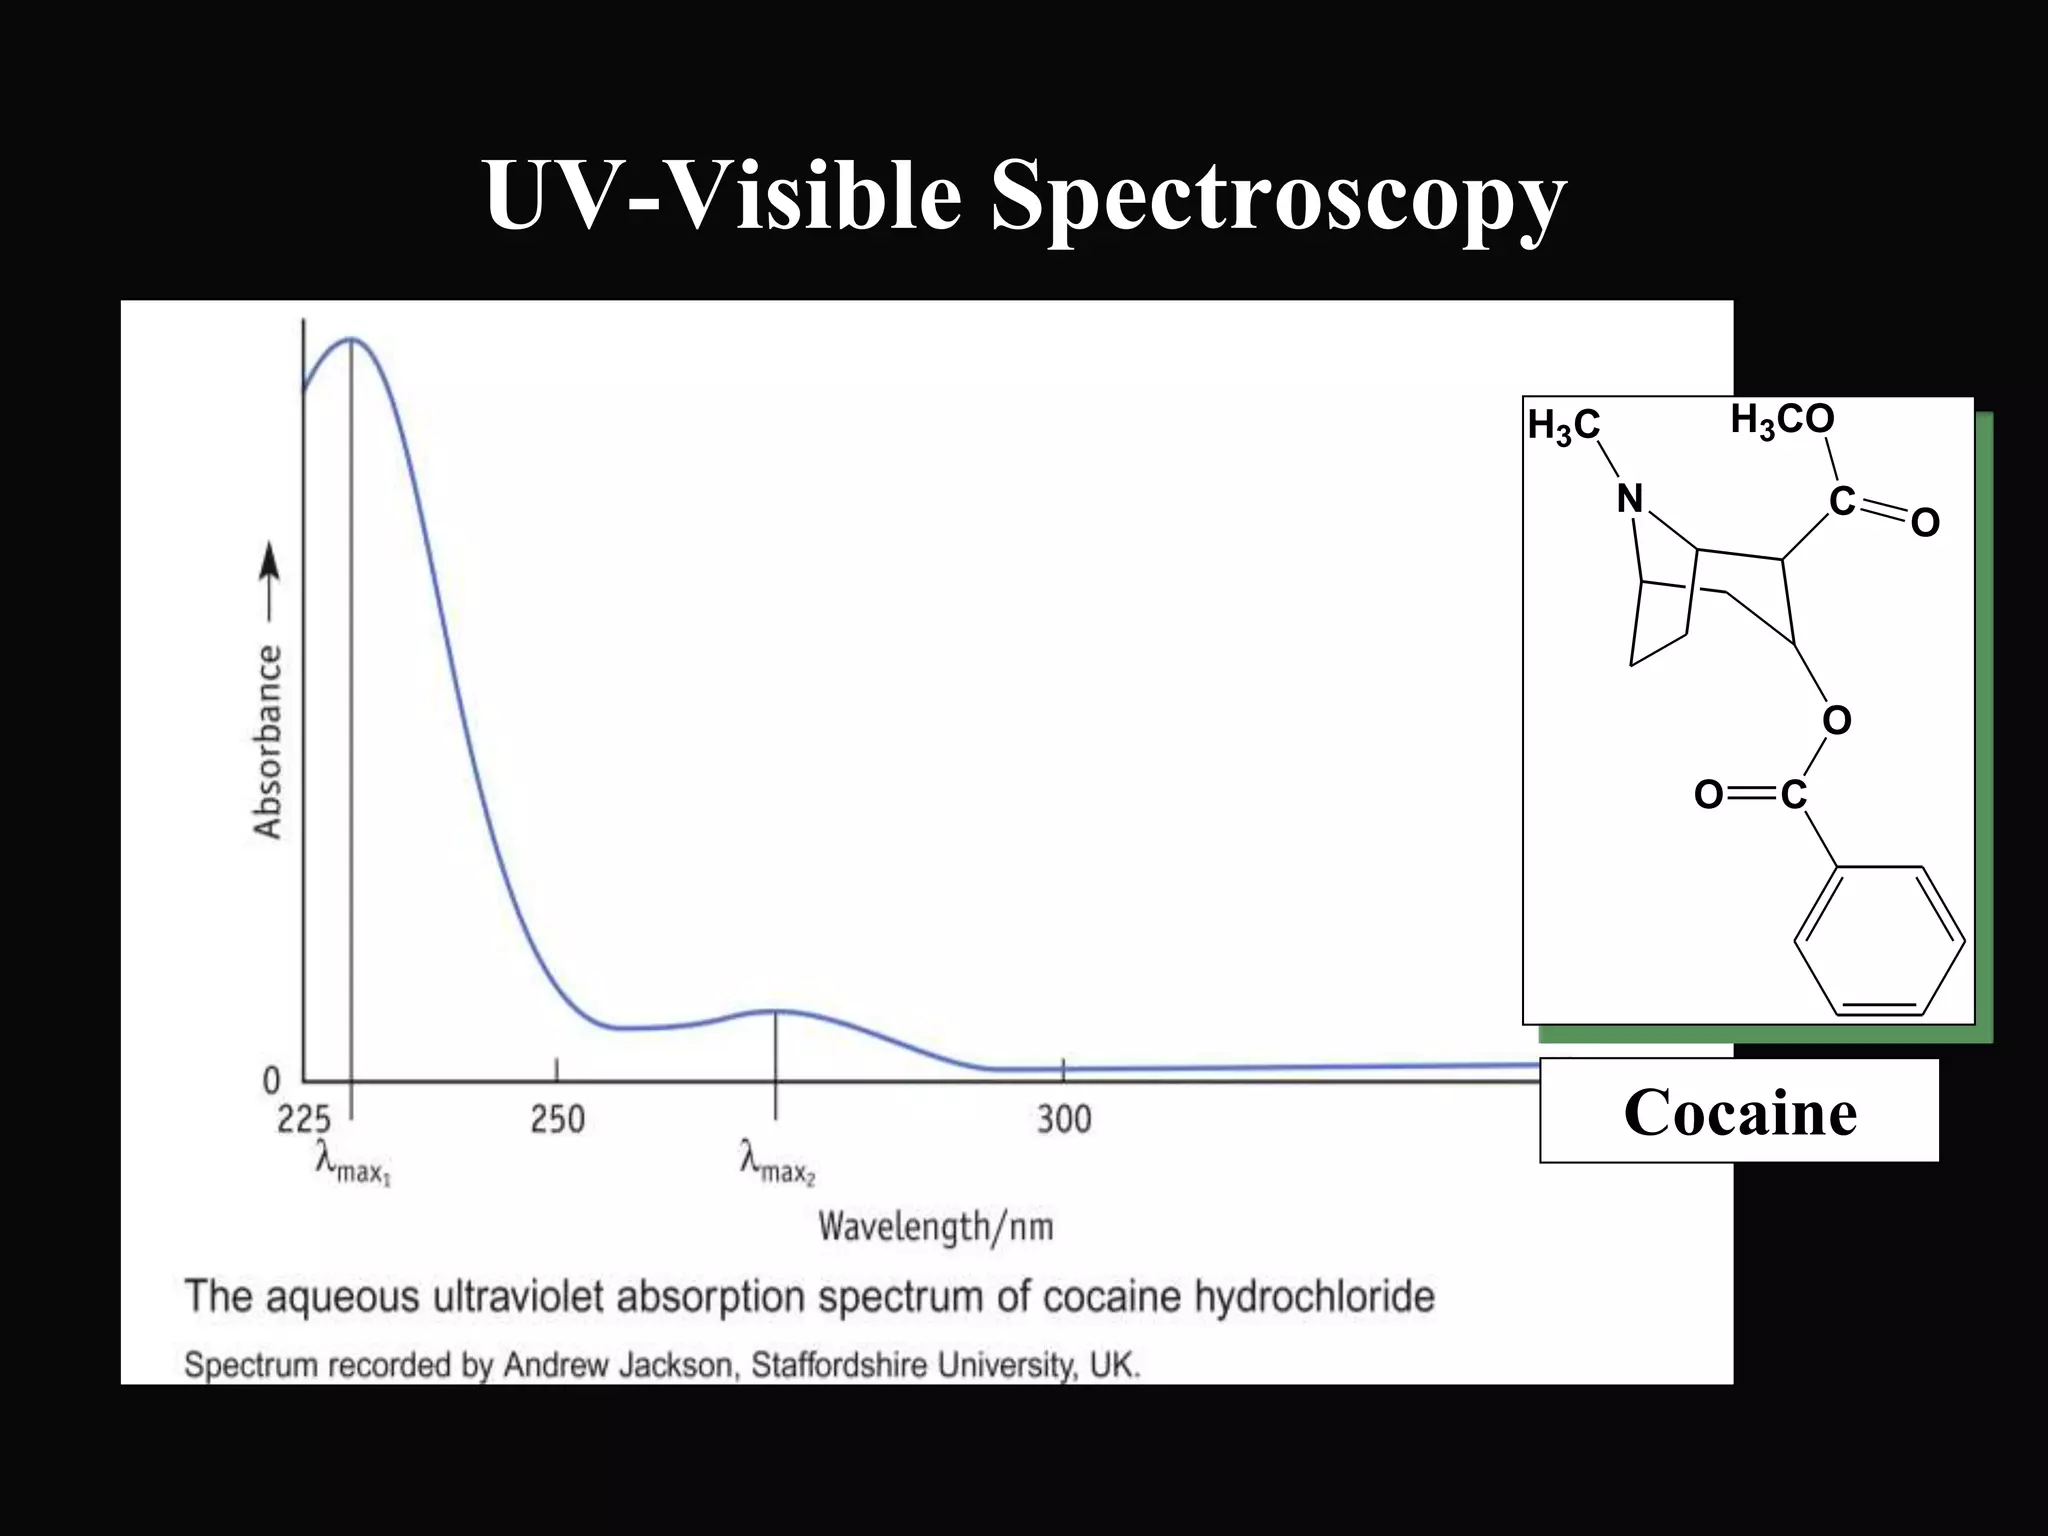


The document provides an overview of infrared and UV-visible spectroscopy, explaining the principles, methods, and applications of both techniques. It includes details on how electromagnetic radiation interacts with matter, the significance of vibrational and electronic transitions, and the interpretation of spectra through various spectroscopic methods. Additionally, the document discusses instrumentation and practical aspects of conducting experiments in these fields.


