Downloaded 25 times


![Resolution
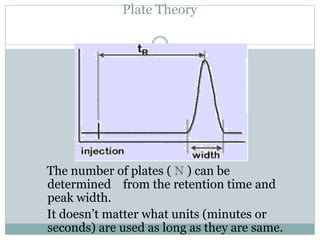
R = 2Z = 2[(tR) B (tR) A]
WA + WB WA + WB](https://image.slidesharecdn.com/columnchr-200504200553/85/Column-chromatography-50-320.jpg)


The document provides an extensive overview of column chromatography, detailing its principles, including the separation of components in a mixture based on their properties through the distribution between stationary and mobile phases. Key concepts such as partition coefficients, chromatograms, retention times, and factors influencing resolution are discussed, along with theories regarding plate efficiency and band broadening. The document emphasizes methods to optimize chromatographic separations and improve resolution in analytical processes.


![Human Reproduction [ Reproductive System ] Notes @irfanullah_mehar Irfanullah...](https://cdn.slidesharecdn.com/ss_thumbnails/humanreproductionreproductivesystemnotesirfanullahmeharirfanullahmeharjanantantra-260111172350-56e85778-thumbnail.jpg?width=640&height=640&fit=bounds)


