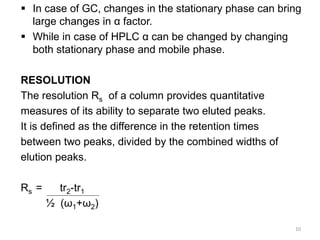
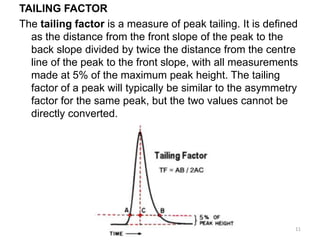
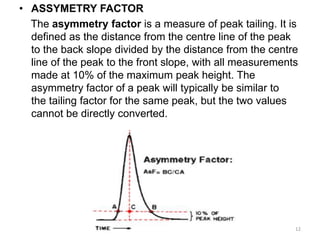
Chromatography is an analytical technique used to separate, identify, and quantify components in complex mixtures. It involves a stationary phase and mobile phase. Components are carried through the stationary phase by the flow of the mobile phase, with separation occurring due to differences in migration rates. Key terms in chromatography include the plate height and number of theoretical plates, which reflect separation efficiency. The Van Deemter equation models how the plate height relates to factors like diffusion and mass transfer between phases, allowing optimization of separation conditions. Chromatography has applications in qualitative and quantitative analysis of sample components.


![Rate Theory
In the rate theory, a number of different peak dispersion
processes were proposed and expressions were developed
that described
• the contribution of each of the processes to the total
variance of the eluted peak
• the final equation that gave an expression for the variance
per unit length of the column
The rate theory has resulted in a number of different equations
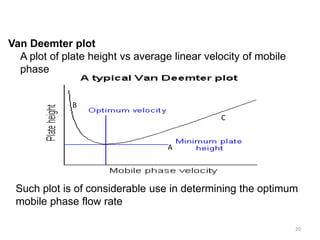
All such equations give a type of hyperbolic function that predicts
a minimum plate height at an optimum velocity and, thus, a
maximum efficiency. At normal operating velocities it has been
demonstrated that the Van Deemter equation gives the best fit
to experimental data
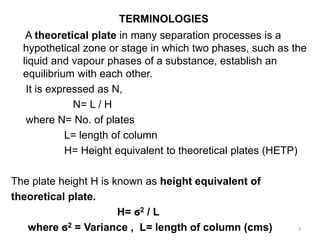
The Van Deemter Equation
H = A + B/u + u [CM + CS] 13](https://image.slidesharecdn.com/chromatography-150912163040-lva1-app6892/85/Chromatography-Basics-13-320.jpg)
![H = A + B/u + u [CM +CS]
Van Deemter model
u = L/ tM
A: random movement through stationary phase
B: diffusion in mobile phase
C: interaction with stationary phase
H: plate height
u: average linear velocity
14](https://image.slidesharecdn.com/chromatography-150912163040-lva1-app6892/85/Chromatography-Basics-14-320.jpg)
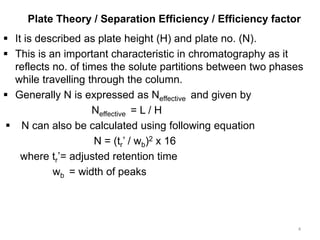
![Term A
- molecules may travel
unequal distances
- independent of u
- depends on size of
stationary particles or
coating (TLC)
H = A + B/u + u [CM +CS]
Van Deemter model
time
Eddy diffusion
MP moves through the column
which is packed with stationary
phase. Solute molecules will take
different paths through the
stationary phase at random. This
will cause broadening of the solute
band, because different paths are
of different lengths.
15](https://image.slidesharecdn.com/chromatography-150912163040-lva1-app6892/85/Chromatography-Basics-15-320.jpg)
![Term B
H = A + B/u + u [CM +CS]
Van Deemter model
Longitudinal diffusion
B = 2γ DM
γ: Impedance factor due to
packing
DM: molecular diffusion
coefficient
B term dominates at low u, and
is more important in GC than LC
since DM(gas) > 104 DM(liquid)
One of the main causes
of band spreading is
DIFFUSION
The diffusion coefficient
measures the ratio at
which a substance
moves randomly from a
region of higher
concentration to a region
of lower concentration
16](https://image.slidesharecdn.com/chromatography-150912163040-lva1-app6892/85/Chromatography-Basics-16-320.jpg)
![Term B
H = A + B/u + u [CM +CS]
Van Deemter model
Longitudinal diffusion
B = 2γ DM
γ: Impedance factor due to
packing
DM: molecular diffusion
coefficient
B term dominates at low u and
is more important in GC than LC
since DM(gas) > 104 DM(liquid)
B - Longitudinal diffusion
The concentration of analyte is less
at the edges of the band than at the
centre. Analyte diffuses out from the
centre to the edges. This causes
band broadening. If the velocity of
the mobile phase is high then the
analyte spends less time in the
column, which decreases the effects
of longitudinal diffusion.
17](https://image.slidesharecdn.com/chromatography-150912163040-lva1-app6892/85/Chromatography-Basics-17-320.jpg)
![Cs: stationary phase-mass transfer
Cs = [(df)2]/Ds
df: stationary phase film thickness
Ds: diffusion coefficient of analyte in SP
CM: mobile phase–mass transfer
CM = [(dP)2]/DM packed columns
CM = [(dC)2]/DM open columns
H = A + B/u + u [CM +CS]
Van Deemter model
Term C
dP: particle diameter
dC: column diameter
Bandwidth
Stationary
phase
Mobile
phase
Elution
Broadened bandwidth
Slow
equilibration
18](https://image.slidesharecdn.com/chromatography-150912163040-lva1-app6892/85/Chromatography-Basics-18-320.jpg)
![H = A + B/u + u [CM +CS]
Van Deemter model
Term C (Resistance to mass transfer) Bandwidth
Stationary
phase
Mobile
phase
Elution
Broadened bandwidth
Slow
equilibration
The analyte takes a certain amount of time to equilibrate
between the stationary and mobile phase. If the velocity of the
mobile phase is high, and the analyte has a strong affinity for
the stationary phase, then the analyte in the mobile phase will
move ahead of the analyte in the stationary phase. The band
of analyte is broadened. The higher the velocity of mobile
phase, the worse the broadening becomes. 19](https://image.slidesharecdn.com/chromatography-150912163040-lva1-app6892/85/Chromatography-Basics-19-320.jpg)