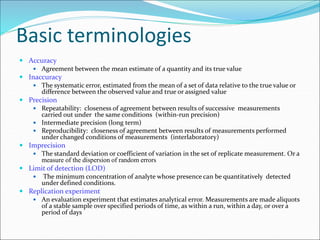
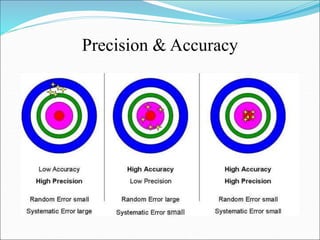
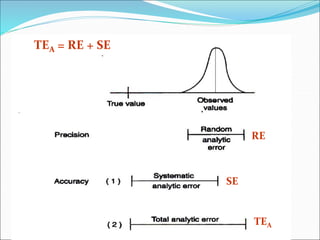
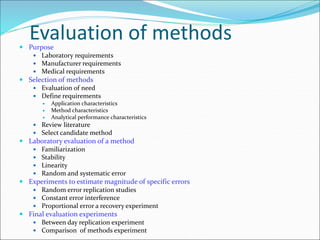
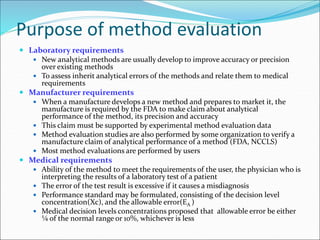
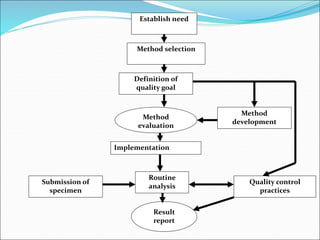
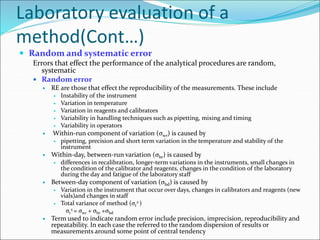
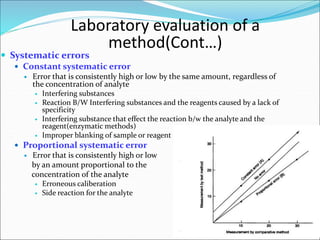
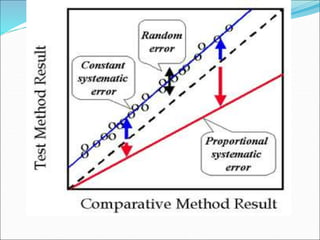
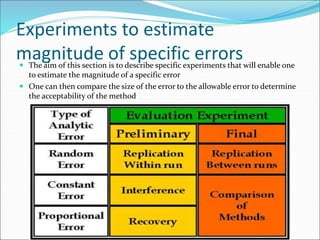
3. Basic terminologies
Accuracy
Agreement between the mean estimate of a quantity and its true value
Inaccuracy
The systematic error, estimated from the mean of a set of data relative to the true value or
difference between the observed value and true or assigned value
Precision
Repeatability: closeness of agreement between results of successive measurements
carried out under the same conditions (within-run precision)
Intermediate precision (long term)
Reproducibility: closeness of agreement between results of measurements performed
under changed conditions of measurements (interlaboratory)
Imprecision
The standard deviation or coefficient of variation in the set of replicate measurement. Or a
measure of the dispersion of random errors
Limit of detection (LOD)
The minimum concentration of analyte whose presence can be quantitatively detected
under defined conditions.
Replication experiment
An evaluation experiment that estimates analytical error. Measurements are made aliquots
of a stable sample over specified periods of time, as within a run, within a day, or over a
period of days
5. Basic terminologies(Cont…)
Bias
The difference between two quantities or a measure of inaccuracy
Constant systematic error
An error which is always in the same direction and magnitude, even as the concentration of analyte
changes
Interference
The effect of a component on the accuracy of measurement of the desired analyte
Interference experiment
An evaluation experiment that estimates the systematic error in a method resulting from interference or
lack of specificity
Linear regression
An approach to choose a single line that best subscribe the relation between two subsets of two methods
Proportional systematic error
An error that is always in one direction and whose magnitude is a percentage of the concentration of
analyte being measured
Recovery Experiment
An evaluation experiment that estimates proportional systematic error. The amount of analyte recovered
is divided by the amount of analyte added to a sample, and the ratio is expressed as the percentage of
recovery. The deviation of the percentage of recovery from 100% is the proportional error
Comparative method
The analytical method to which the test method is compared
Comparison of methods experiment
An evaluation experiment in method which a series of patient samples are analyzed by both the test
method and comparative method. The results are assessed to determine whether differences exist
between the two methods.
6. Basic terminologies(Cont…)
Total error
Random + Systematic analytical error
Allowable error(EA)____5%
The amount of error that can be tolerated without
invalidating the medical usefulness of the analytical
result
Medical decision level(Xc)
A concentration of analyte at which some medical
action is indicated
8. Evaluation of methods
Purpose
Laboratory requirements
Manufacturer requirements
Medical requirements
Selection of methods
Evaluation of need
Define requirements
Application characteristics
Method characteristics
Analytical performance characteristics
Review literature
Select candidate method
Laboratory evaluation of a method
Familiarization
Stability
Linearity
Random and systematic error
Experiments to estimate magnitude of specific errors
Random error replication studies
Constant error interference
Proportional error a recovery experiment
Final evaluation experiments
Between day replication experiment
Comparison of methods experiment
9. Purpose of method evaluation
Laboratory requirements
New analytical methods are usually develop to improve accuracy or precision
over existing methods
To assess inherit analytical errors of the methods and relate them to medical
requirements
Manufacturer requirements
When a manufacture develops a new method and prepares to market it, the
manufacture is required by the FDA to make claim about analytical
performance of the method, its precision and accuracy
This claim must be supported by experimental method evaluation data
Method evaluation studies are also performed by some organization to verify a
manufacture claim of analytical performance of a method (FDA, NCCLS)
Most method evaluations are performed by users
Medical requirements
Ability of the method to meet the requirements of the user, the physician who is
interpreting the results of a laboratory test of a patient
The error of the test result is excessive if it causes a misdiagnosis
Performance standard may be formulated, consisting of the decision level
concentration(Xc), and the allowable error(EA )
Medical decision levels concentrations proposed that allowable error be either
¼ of the normal range or 10%, whichever is less
10. Establish need
Method selection
Definition of
quality goal
Method
evaluation
Method
development
Implementation
Routine
analysis
Quality control
practices
Submission of
specimen
Result
report
11. Selection of methods
Evaluation of need
Medical requirement for a new test
Advances in laboratory practice
Age and lack of operational reliability of the present analyzer
Define requirements
Application characteristics
Practical features required of the method
Sample size, turnaround time, sample throughput rate, specimen type, automated
calibration, online quality control review, self diagnostics, laboratory space required,
reagent storage facility required, availability and skill of lab staff, time available, cost per
test, safety and environmental hazards
Method characteristics
Chemical specificity
Chemical sensitivity
To use primary aqueous standards for calibration
The choice of reagents temperature, reaction time, measurement time, measurement
approach
A source of recommended principal method has been developed by NCCLS
Analytical performance characteristics
Overall goals for analytical performance have been discussed in terms of
Allowable error, working range of a method(linearity), stability of the reagents, ability
of the analyzer to detect reagent depletion in the case of enzyme substrates, expected
reference range, amount of error caused by interfering substances, precision and
accuracy of the method
Review literature
Select candidate method
17. Laboratory evaluation of a method
Familiarization
Stability
Reagents, calibrators and control material
Expiry dates
One should perform preliminary studies with crossover analysis
One can test the observed difference by use of a t test
Linearity
The range of concentration or other quantity in the specimen over
which the method is applicable without modification
The absolute minimum no of different concentrations that must be
measured is 3, better is 5
Duplicate measurement should be made on each concentration sample
Construct a dilution series
Each sample should be prepared by direct dilution from the original
high sample pool
Data points should be plotted for visual inspection of linear
performance
18. Laboratory evaluation of a
method(Cont…)
Random and systematic error
Errors that effect the performance of the analytical procedures are random,
systematic
Random error
RE are those that effect the reproducibility of the measurements. These include
Instability of the instrument
Variation in temperature
Variation in reagents and calibrators
Variability in handling techniques such as pipetting, mixing and timing
Variability in operators
Within-run component of variation (σwr) is caused by
pipetting, precision and short term variation in the temperature and stability of the
instrument
Within-day, between-run variation (σbr) is caused by
differences in recalibration, longer-term variations in the instruments, small changes in
the condition of the calibrator and reagents, changes in the condition of the laboratory
during the day and fatigue of the laboratory staff
Between-day component of variation (σbd) is caused by
Variation in the instrument that occur over days, changes in calibrators and reagents (new
vials)and changes in staff
Total variance of method (σt
2 )
σt
2 = σwr + σbr +σbd
Term used to indicate random error include precision, imprecision, reproducibility and
repeatability. In each case the referred to the random dispersion of results or
measurements around some point of central tendency
19. Total Variance of a Method (t
2)
t
2 = wr
2 + br
2 + bd
2
RE = t
20. Systematic errors
Constant systematic error
Error that is consistently high or low by the same amount, regardless of
the concentration of analyte
Interfering substances
Reaction B/W Interfering substances and the reagents caused by a lack of
specificity
Interfering substance that effect the reaction b/w the analyte and the
reagent(enzymatic methods)
Improper blanking of sample or reagent
Proportional systematic error
Error that is consistently high or low
by an amount proportional to the
concentration of the analyte
Erroneous caliberation
Side reaction for the analyte
Laboratory evaluation of a
method(Cont…)
21.
22. Experiments to estimate
magnitude of specific errors
The aim of this section is to describe specific experiments that will enable one
to estimate the magnitude of a specific error
One can then compare the size of the error to the allowable error to determine
the acceptability of the method
23. Experiments to estimate magnitude
of specific errors(Cont…)
Random error estimated from REPLICATION
STUDIES
Within-run replication experiment
Assessment of precision
Short term performance
Replication study should be performed with
Aqueous solution of calibrator and then repeat with samples
whose matrices is as similar as possible to that of the intended
patients sample
Concentration should be near the medical concentration
Repeated analysis of the same specimen
If the estimate of the random error is less than allowable error,
it is acceptable
24. Experiments to estimate magnitude
of specific errors(Cont…)
Constant error estimated from INTERFERENCE STUDIES
The interference study measures the constant error caused by the
presence of a substance suspected of interfering with the test method
A sample is spiked with the substance suspected of interfering . To
compensate for the dilution of the spiked sample a baseline sample
should be prepared by addition of the solvent used for the interferent,
to another aliquot of the sample. The 2 samples should be analyzed at
least in duplicate the difference b/w the results in the 2 samples is
attributable to an interference caused by the added substance
Example of the Interfering substances are haemolysed, lipemic and
icteric samples
If the error is too large at the maximum concentration of interfering
substance it may be appropriate to test the interference at lower
concentration
The overall average difference(bias) is called a constant error because it
is independent of the analyte conc.
If the constant error is less than the allowable error the constant error
caused by the interference is judged acceptable
25. Experiments to estimate magnitude
of specific errors(Cont…)
Proportional error estimated from a RECOVERY
EXPERIMENT
Sample is divided into two aliquot 1 is spiked with analyte and
equivalent amount of diluent is added to the second(baseline
sample)
Two samples are then analyzed
The difference b/w the spiked sample and the baseline sample
indicates the amount of analyte “recovered”
The volume of the analyte added to the sample should be less than
10 % to avoid major disruption
Analysis of this sample with the comparison method is
recommended
The ratio of the amount recovered to the amount added and is given
as percentage the difference b/w the calculated percentage of
recovery and 100% recovery is the percentage of the proportional
error, the standard deviation of the percentage of the recovery is a
measure of the uncertainty of percentage of proportional error
If the proportional error is less than the allowable error, the
proportional error is acceptable
26. Final evaluation experiments
B/w-day replication experiment
Expansion of the within-run experiment over many days usually 20
Comparison of methods experiment
Systematic error of the test method and a comparative method
A group of patient specimens are analyzed by both the test method and a comparative
method
Systematic differences b/w the two methods are interpreted as the error of the test method
Methods may be classified in terms of the quality of their performance
Definitive, reference or routine methods
Comparative method Should be of the highest quality possible
At least 40 and preferably 100 specimens should be analyzed
Analyte concentration throughout the analytical range
Specimens are analyzed for duplicate in each method
The test and comparative method should be run at the same time or as closely in time to
each other as possible
The comparison of method experiment is usually combined with the b/w-day replication
experiment
Patients specimens should be evenly spread over atleast 5 runs and preferably all 20 runs
Both methods must be maintained in acceptable quality control during the period
27. Final evaluation experiments(Cont..)
Comparison of methods experiment(Cont..)
t-Test statistics
Bias
Systematic differences b/w the test and the comparative methods are most easily
estimated from the comparison of method data by the bias
Bias is the difference b/w the average result by the test method and the average result
by the comparative method or is the magnitude of the systematic error b/w the two
methods
Bias= ∑(yi-xi)
N
yi and xi are the analyte concentrations of the individuals specimens by the test method
and comparative method respectively and N is the no of paired results compared
Standard deviation
SD = ∑(yi-xi -Bias)2
N-1
t-Test
The statistical significance of the bias, that is weather it really differs from 0 or no bias,
is determine by the use of t value
t value is the ratio of the systematic error term(bias) to a random error term (SD)
t= bias N
SD
28. Comparison of methods experiment(Cont..)
t-Test statistics
If the calculated t value exceeds the critical t value(t table), statistically real bias
exist b/w the two methods
If bias is less than allowable error the systematic error is acceptable
Final evaluation
experiments(Cont..)
29. Recommended Minimum Studies for comparison of
methods experiment.
1. Select 40 patient specimens to cover the full working
range of the method.
2. Analyze 8 specimens a day within 2 hours by the test and
comparative methods.
3. Graph results immediately on a difference plot and
inspect for discrepancies.
4. Reanalyze specimens that give discrepant results.
5. Continue the experiment for 5 days if no discrepant
results are observed.
30. Recommended Minimum Studies for comparison of methods
experiment.
6. Continue for another 5 days if discrepancies are observed
during the first 5 days.
7. Prepare a comparison plot of all the data to assess the
range, outliers, and linearity.
8. Calculate the correlation coefficient and if 0.99 or greater,
calculate simple linear regression statistics and estimate
the systematic error at medical decision concentrations.
9. Use the medical decision chart to combine the estimates of
SE and RE and make judgment on the total error observed
for the method.