Downloaded 162 times
![Validation of Analytical Methods
Mr. Sagar Kishor Savale
M. Pharm [Pharmaceutics]
Mr. Sagar Kishor Savale](https://image.slidesharecdn.com/validationofanalyticalmethods-170914062209/75/Validation-of-analytical-methods-1-2048.jpg)
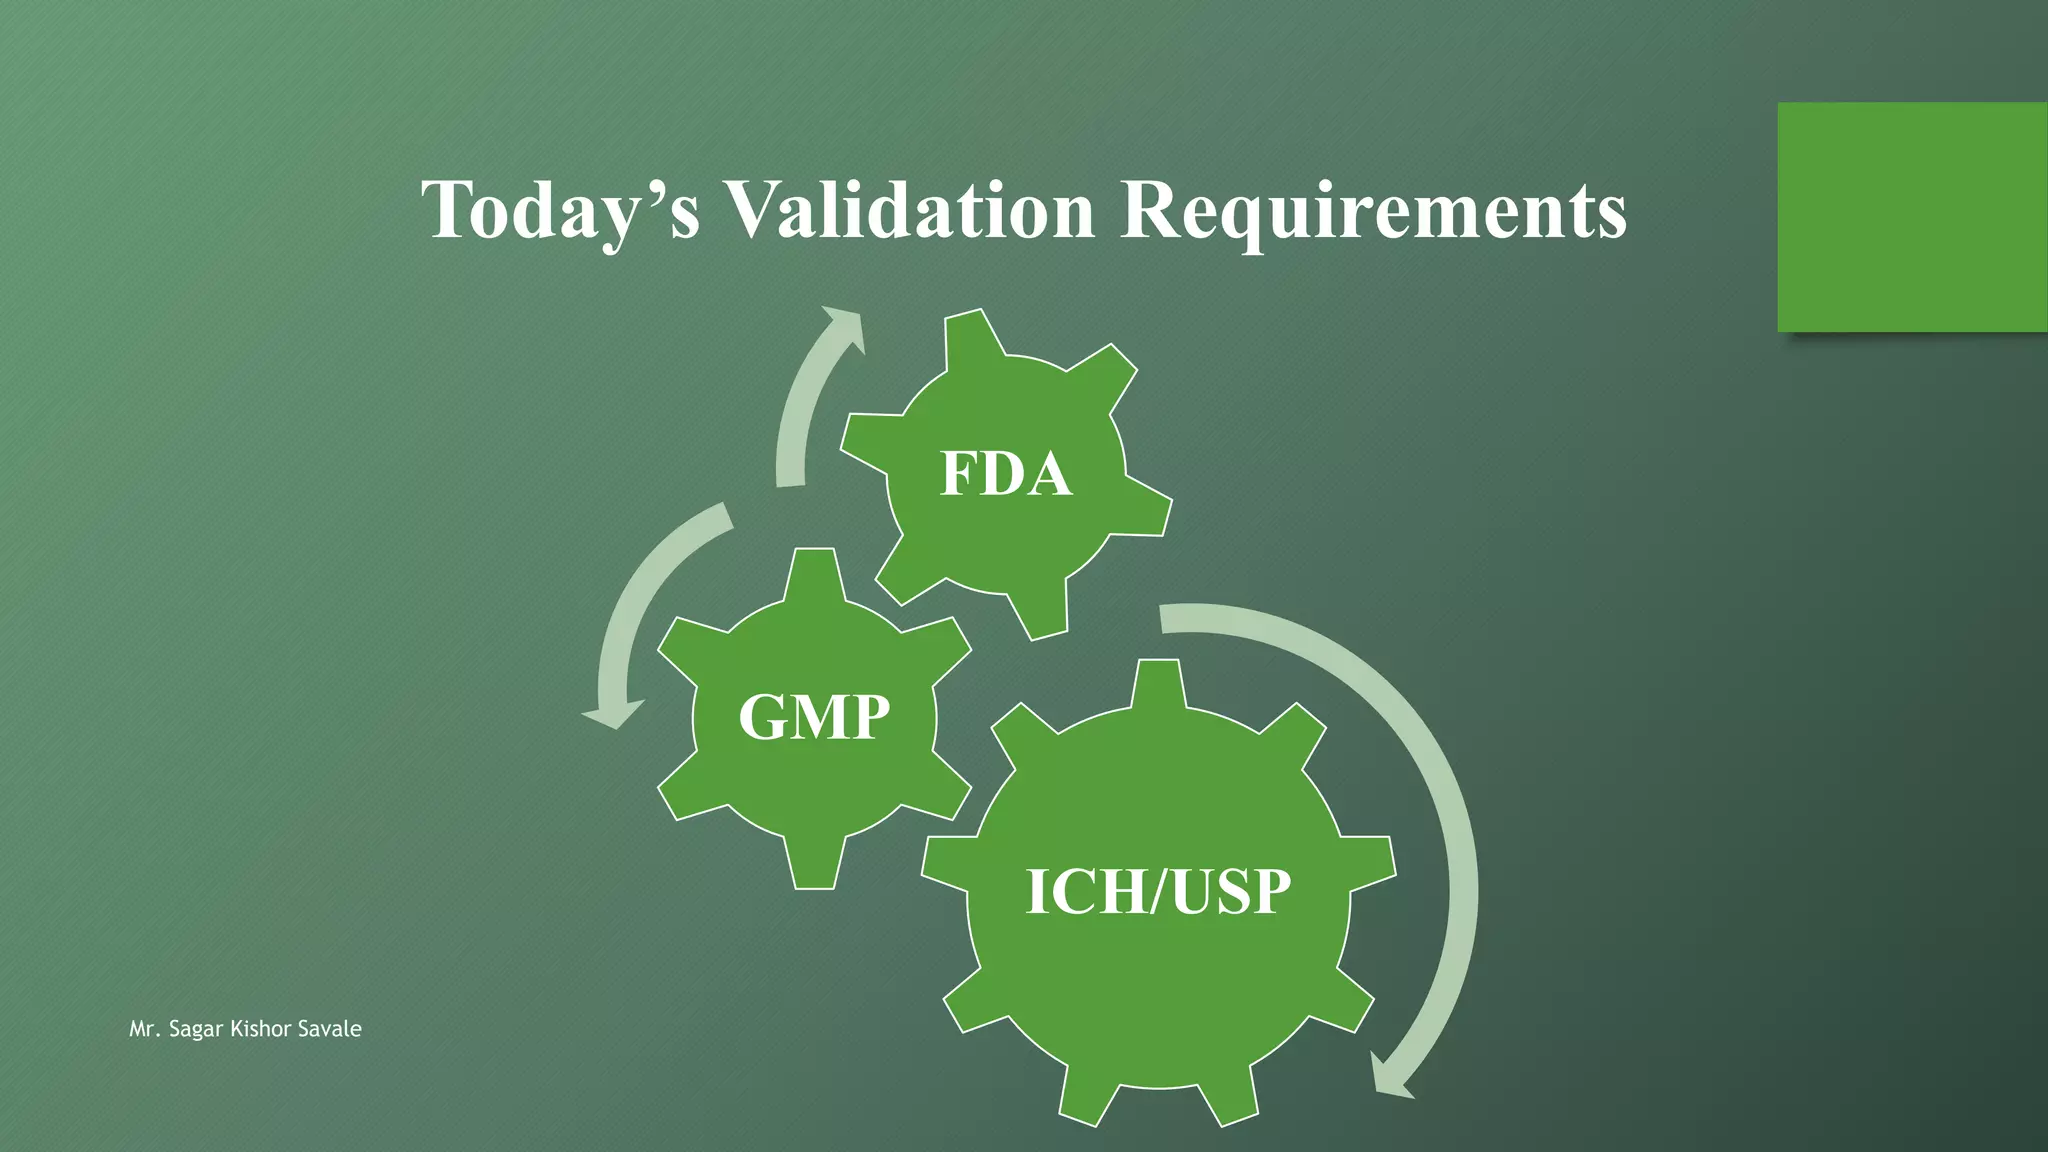
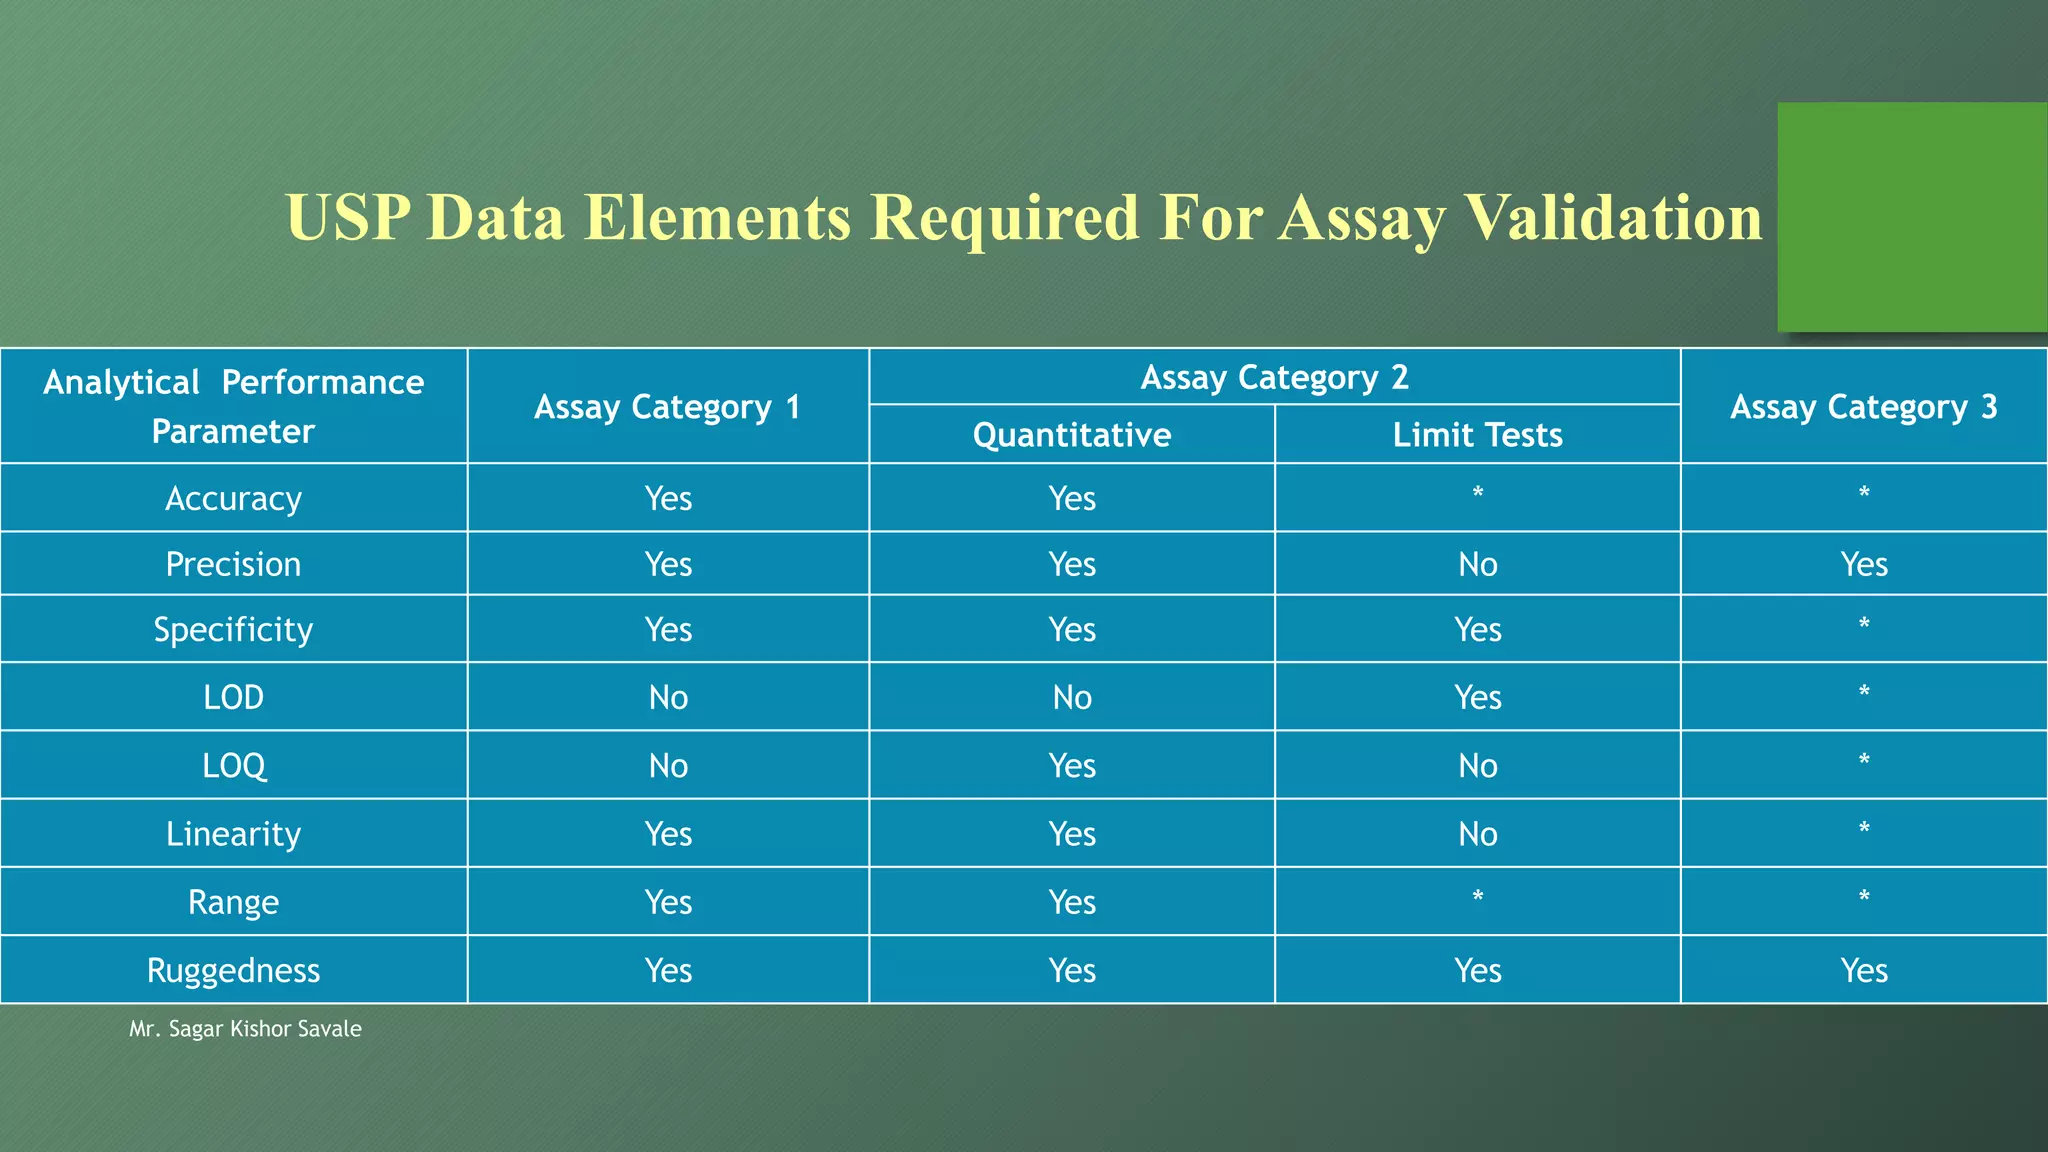
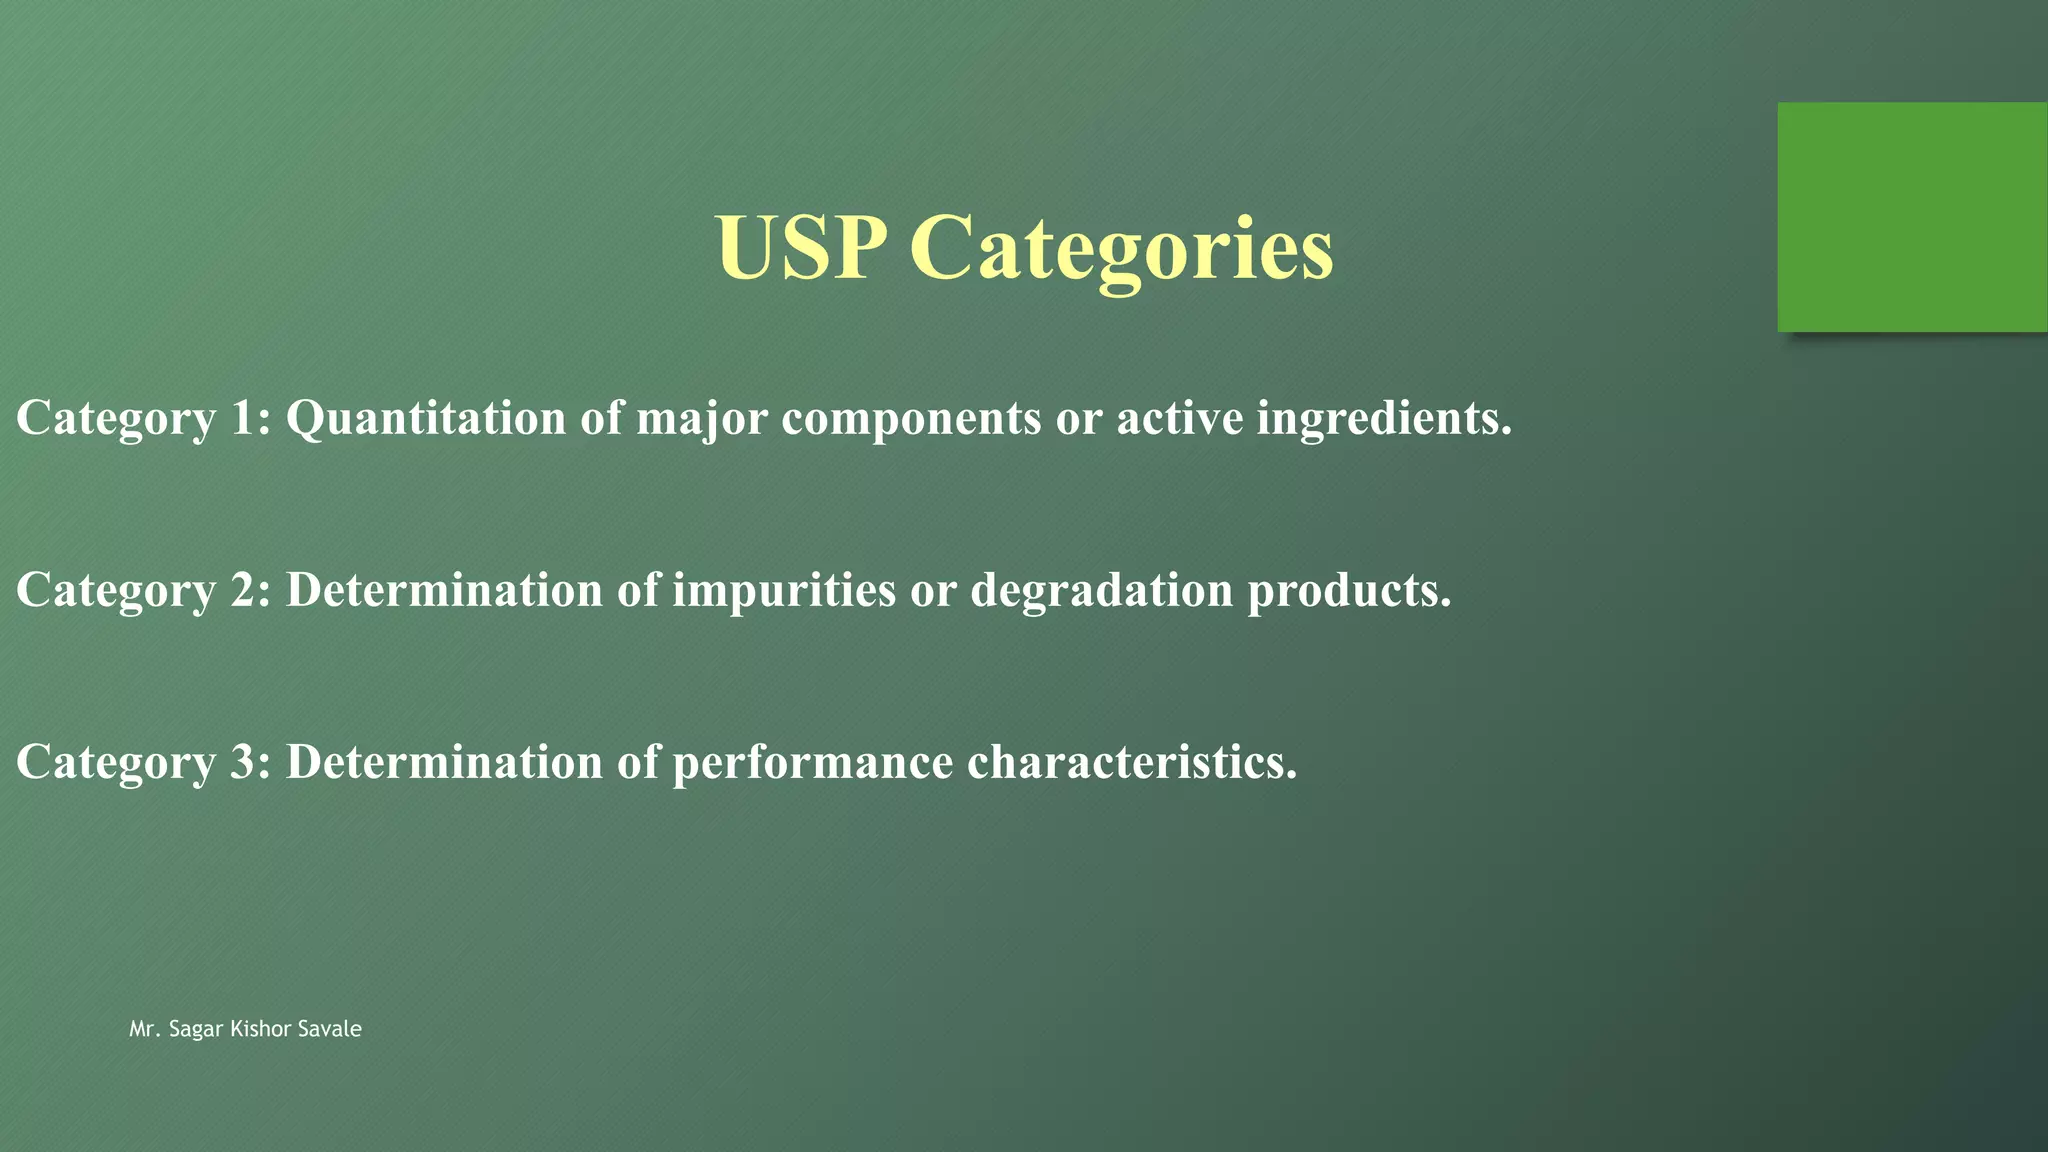
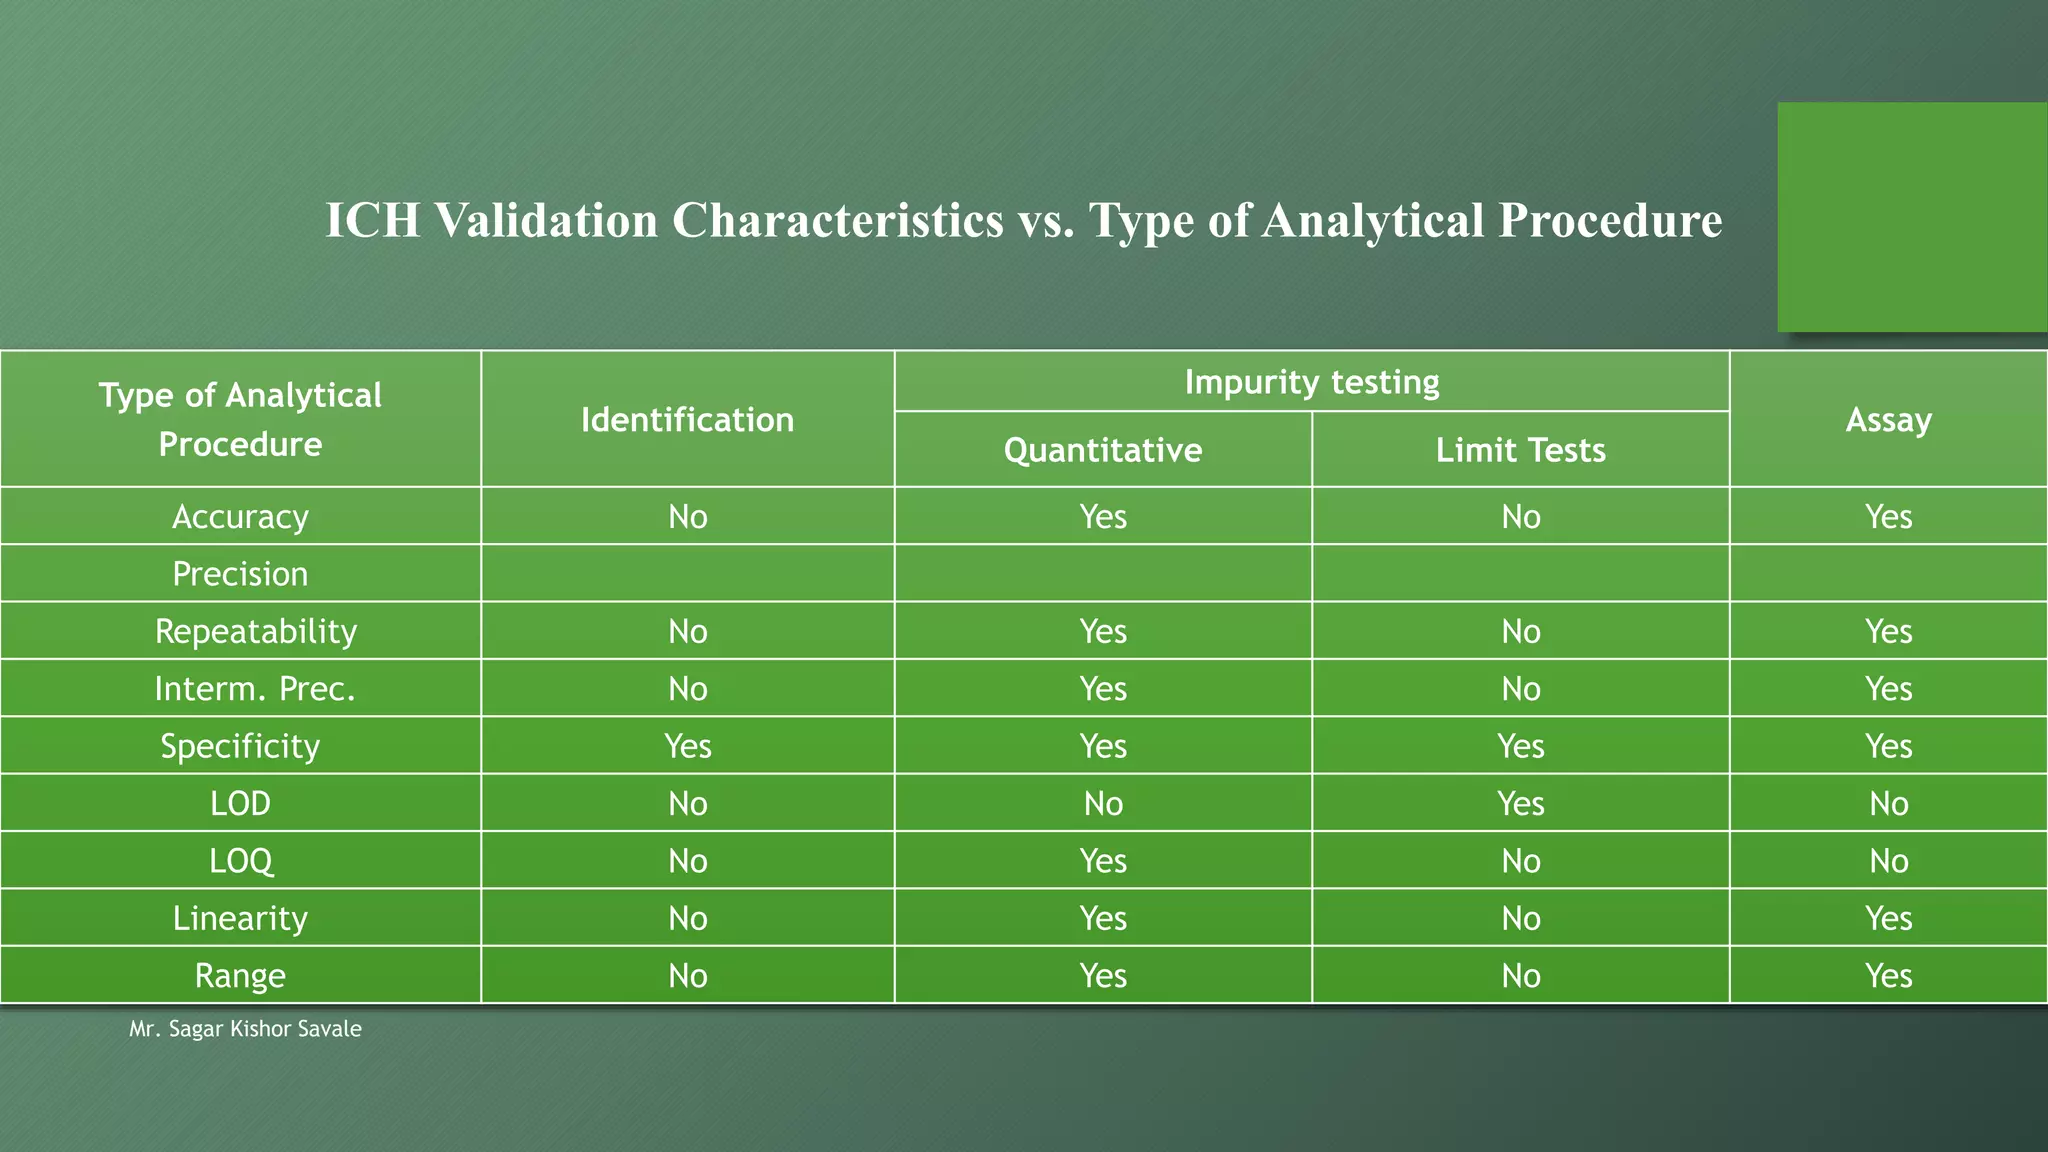
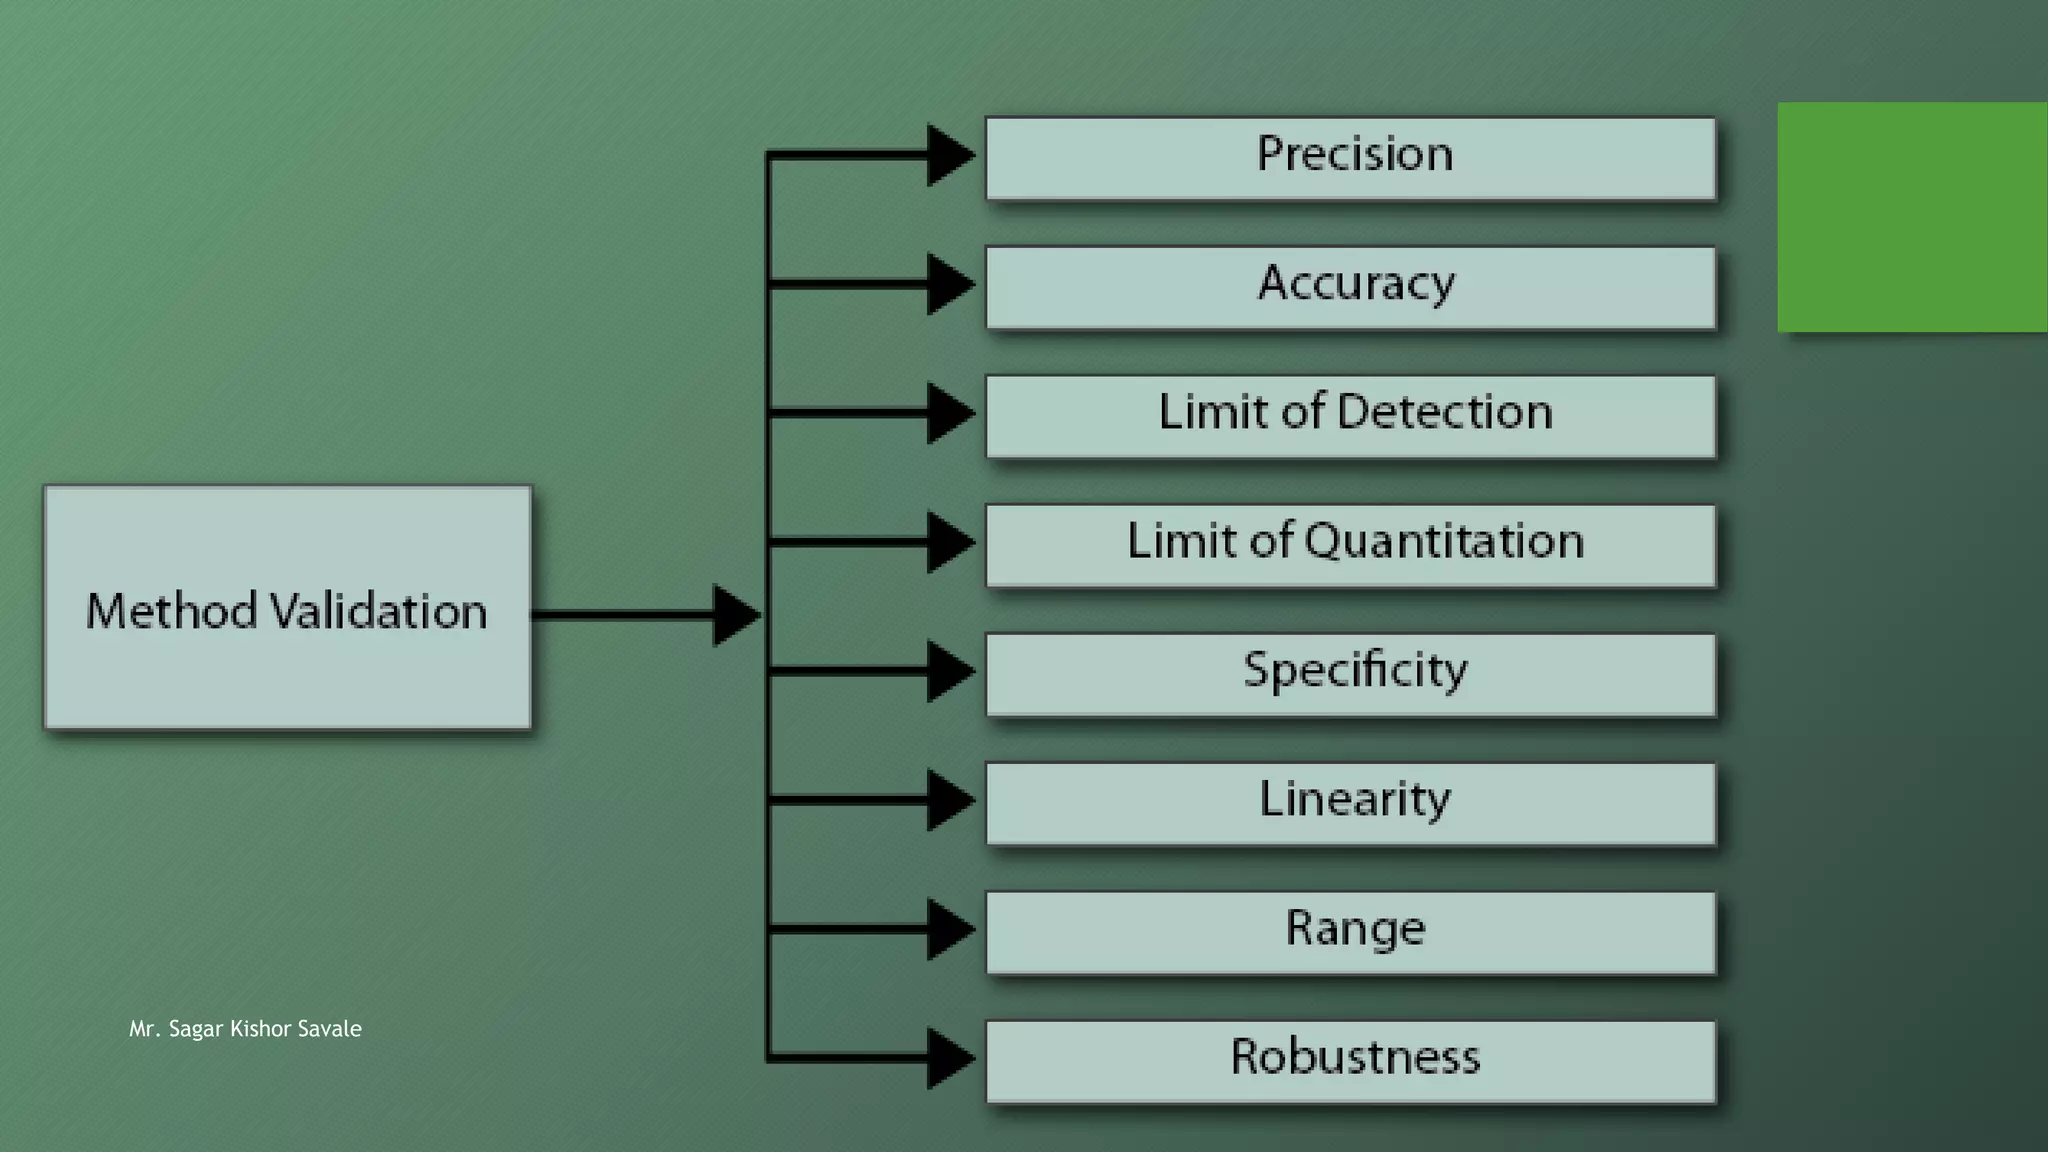
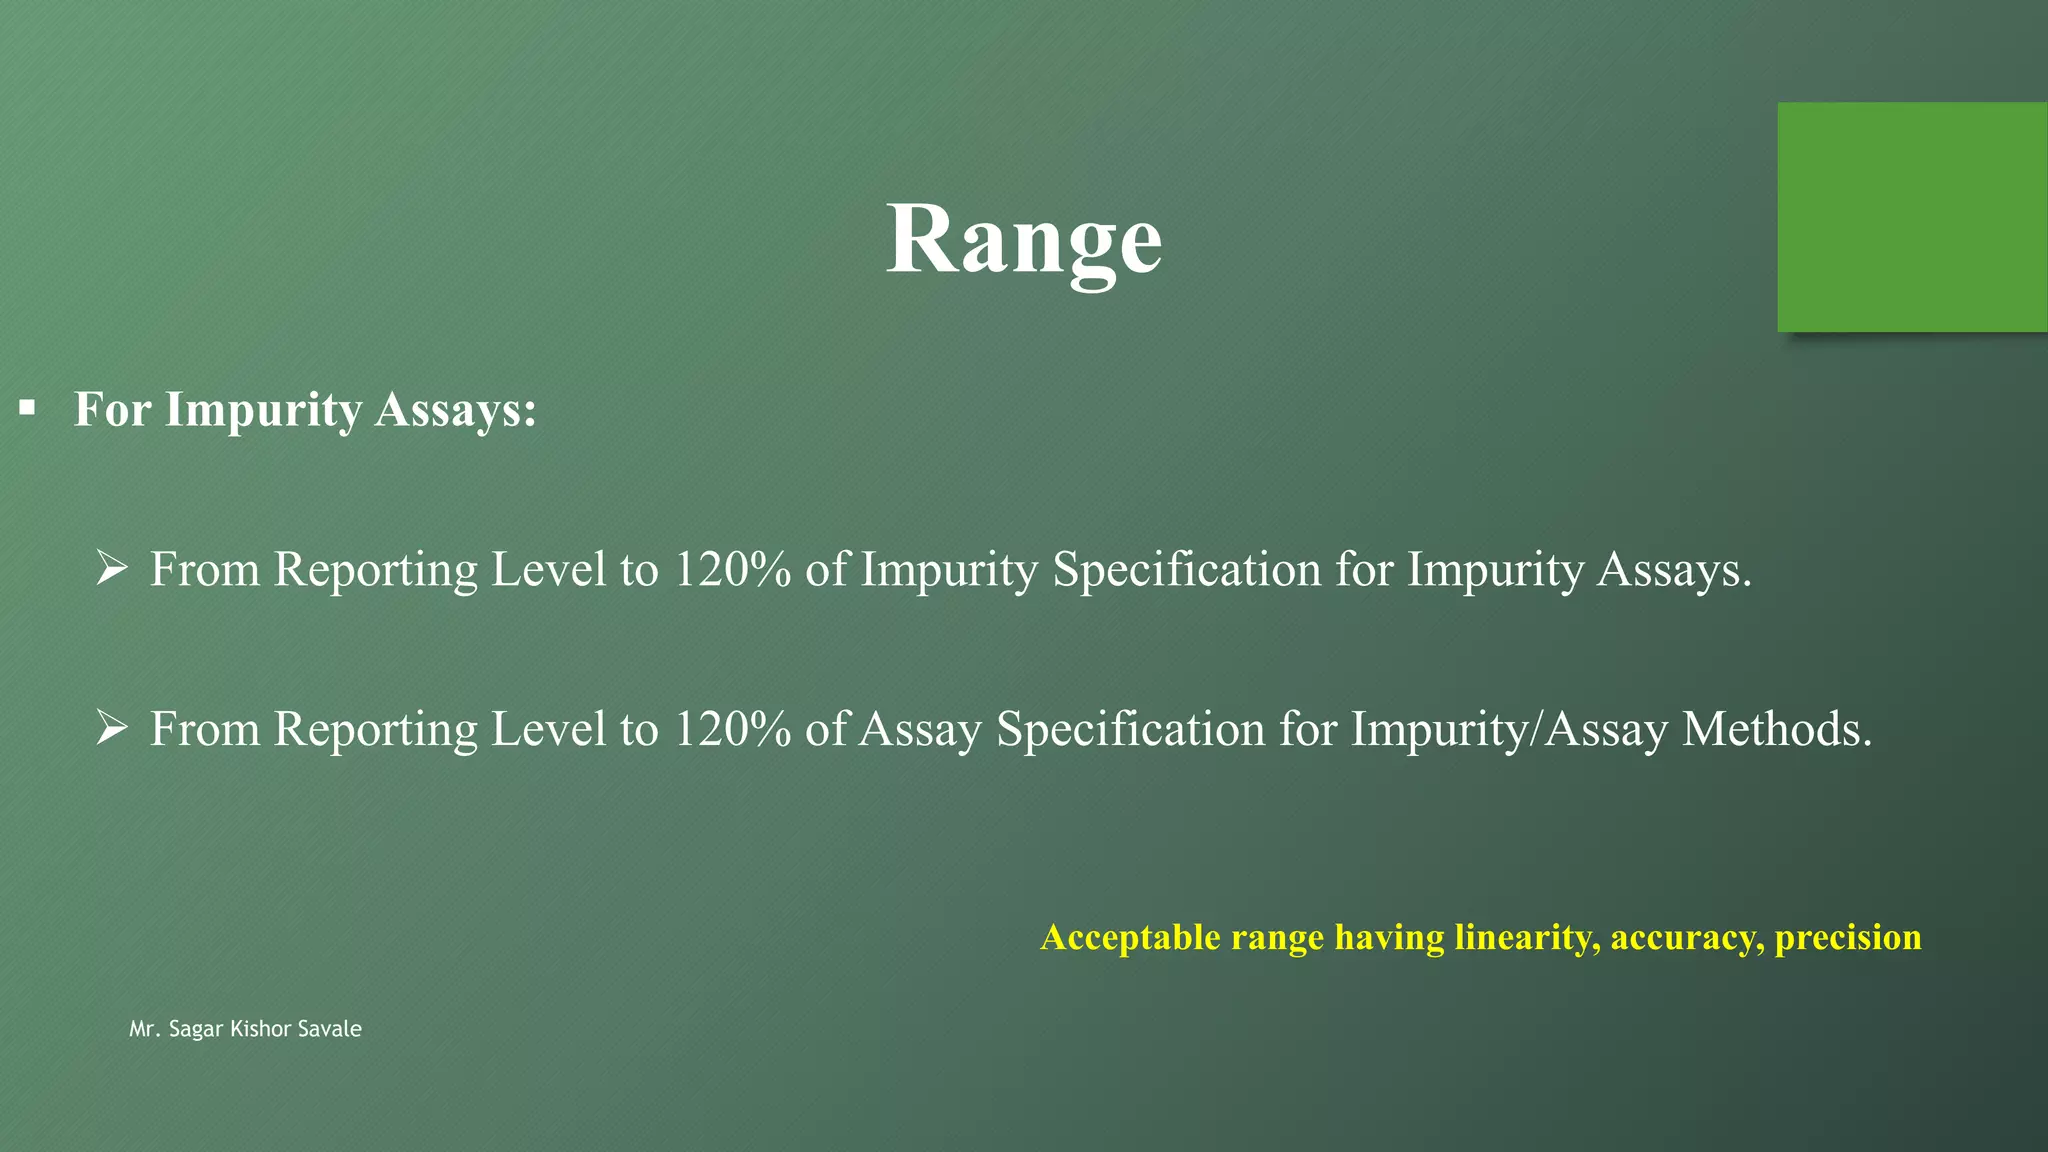
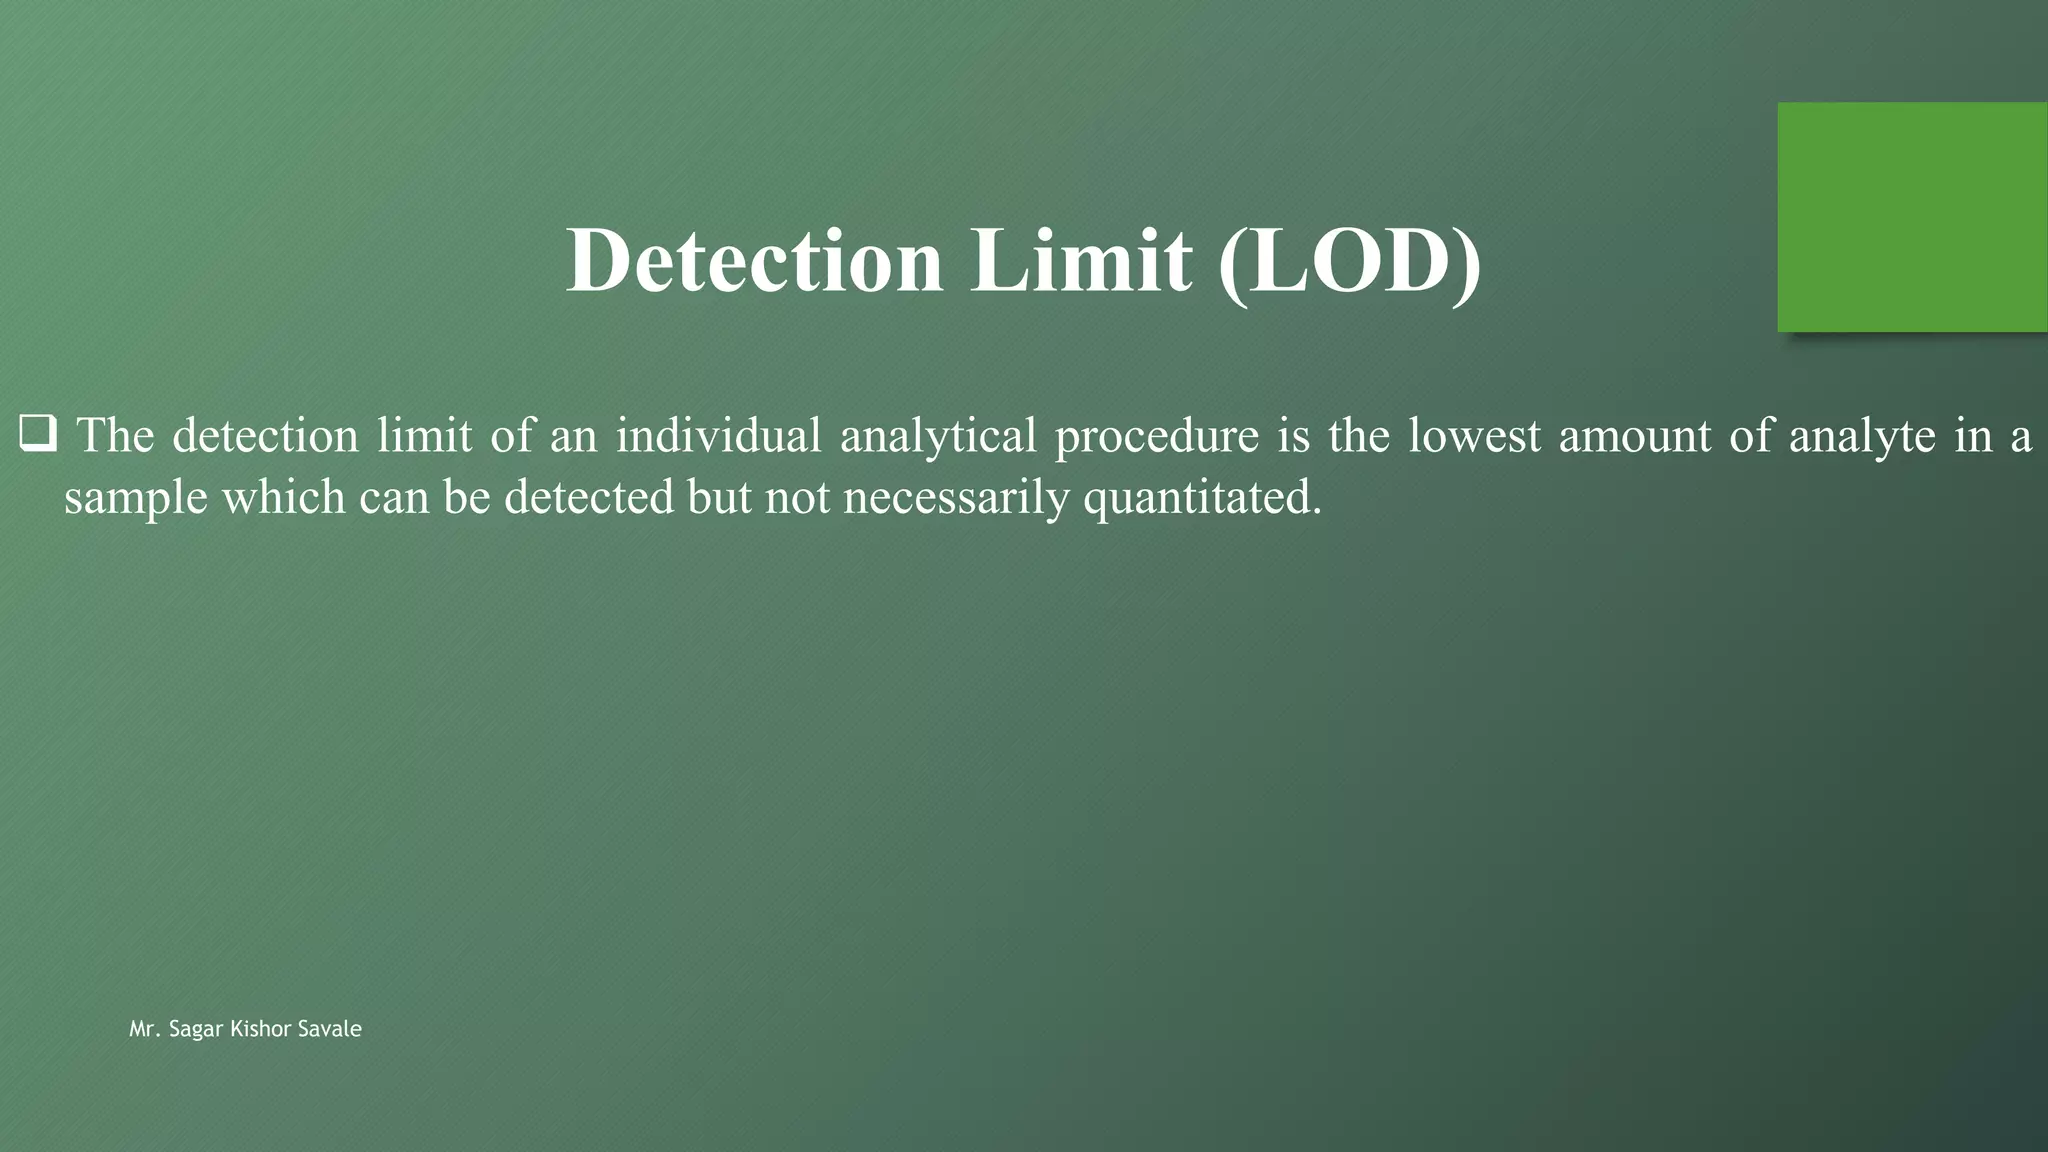
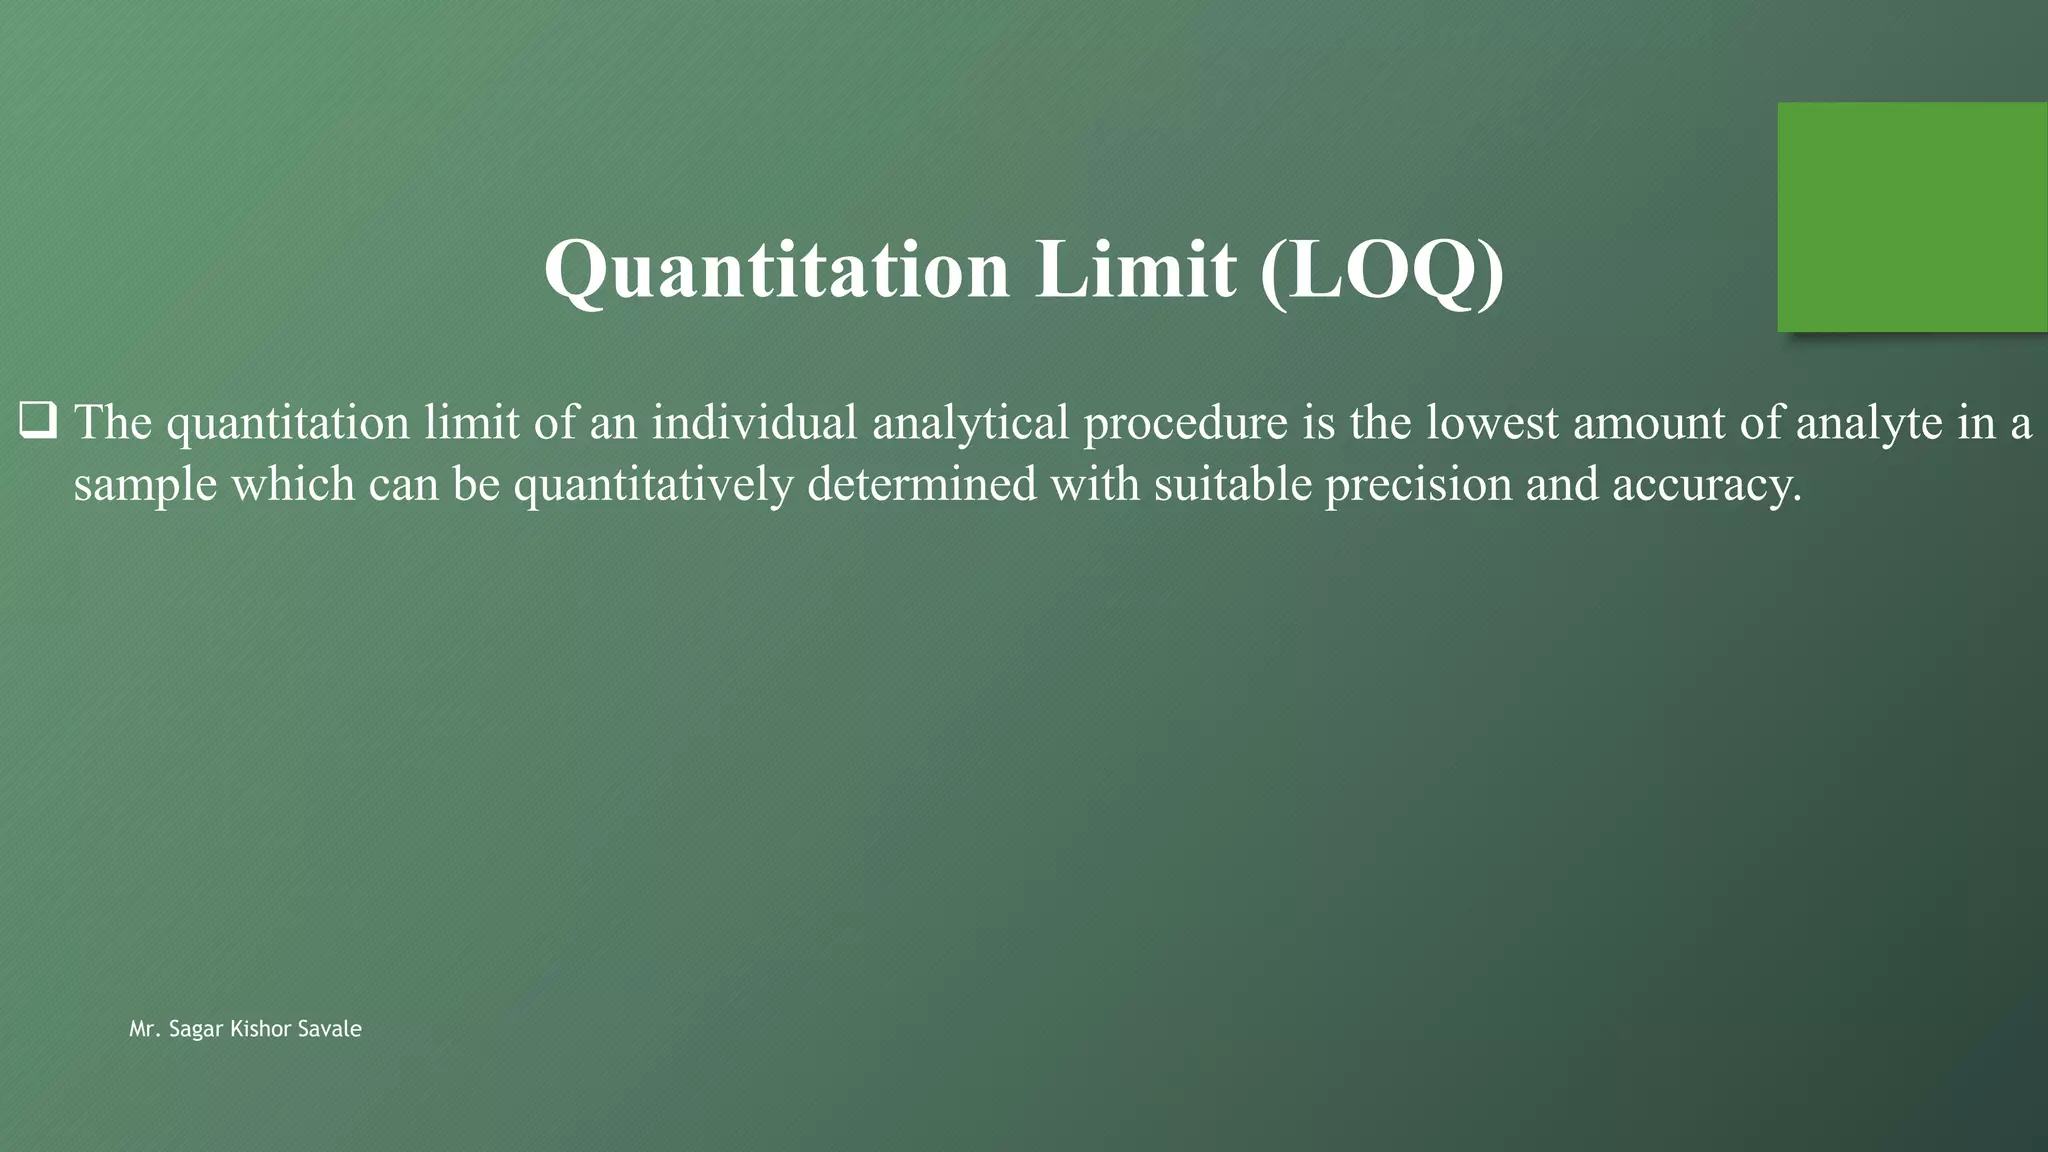
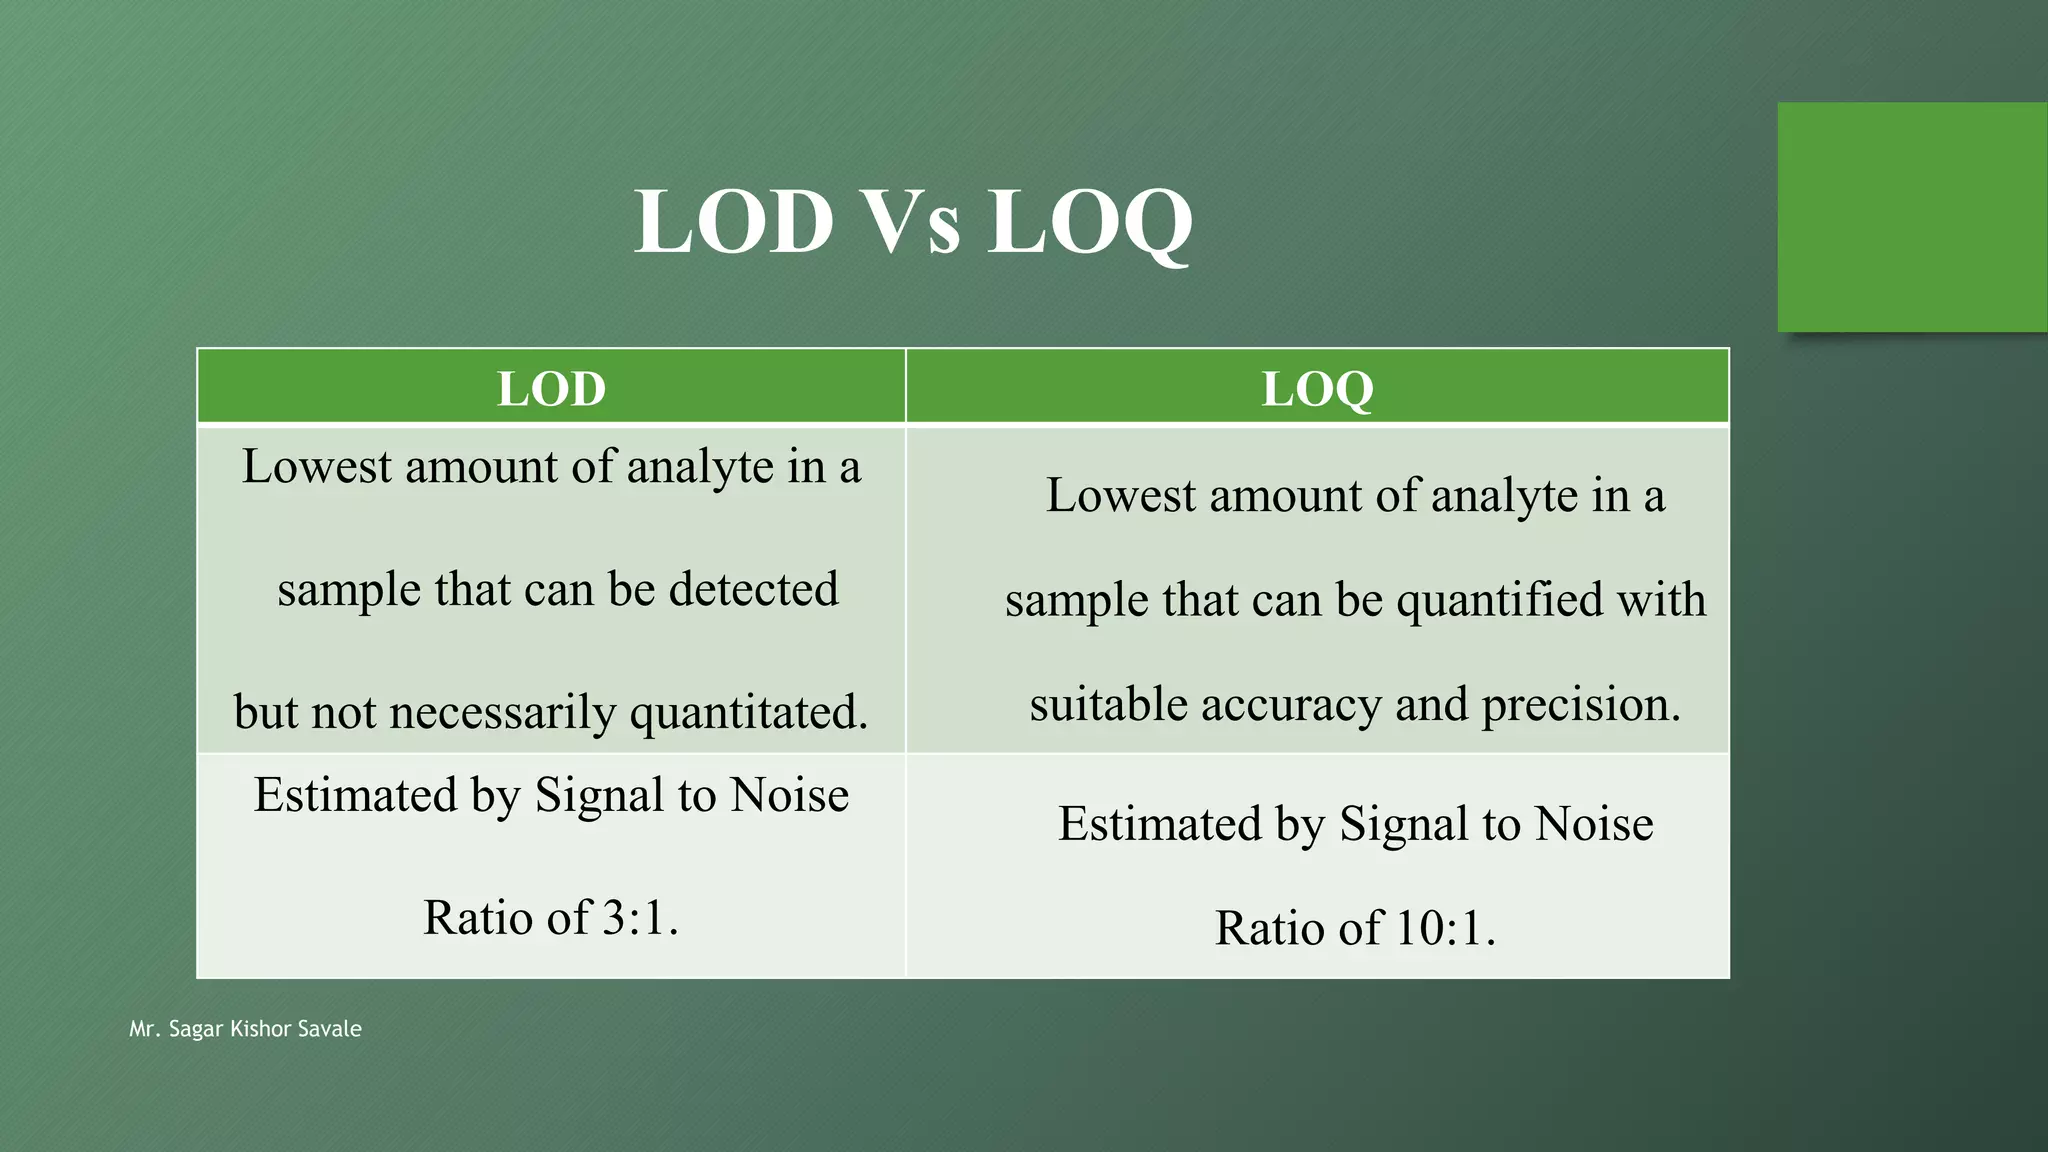
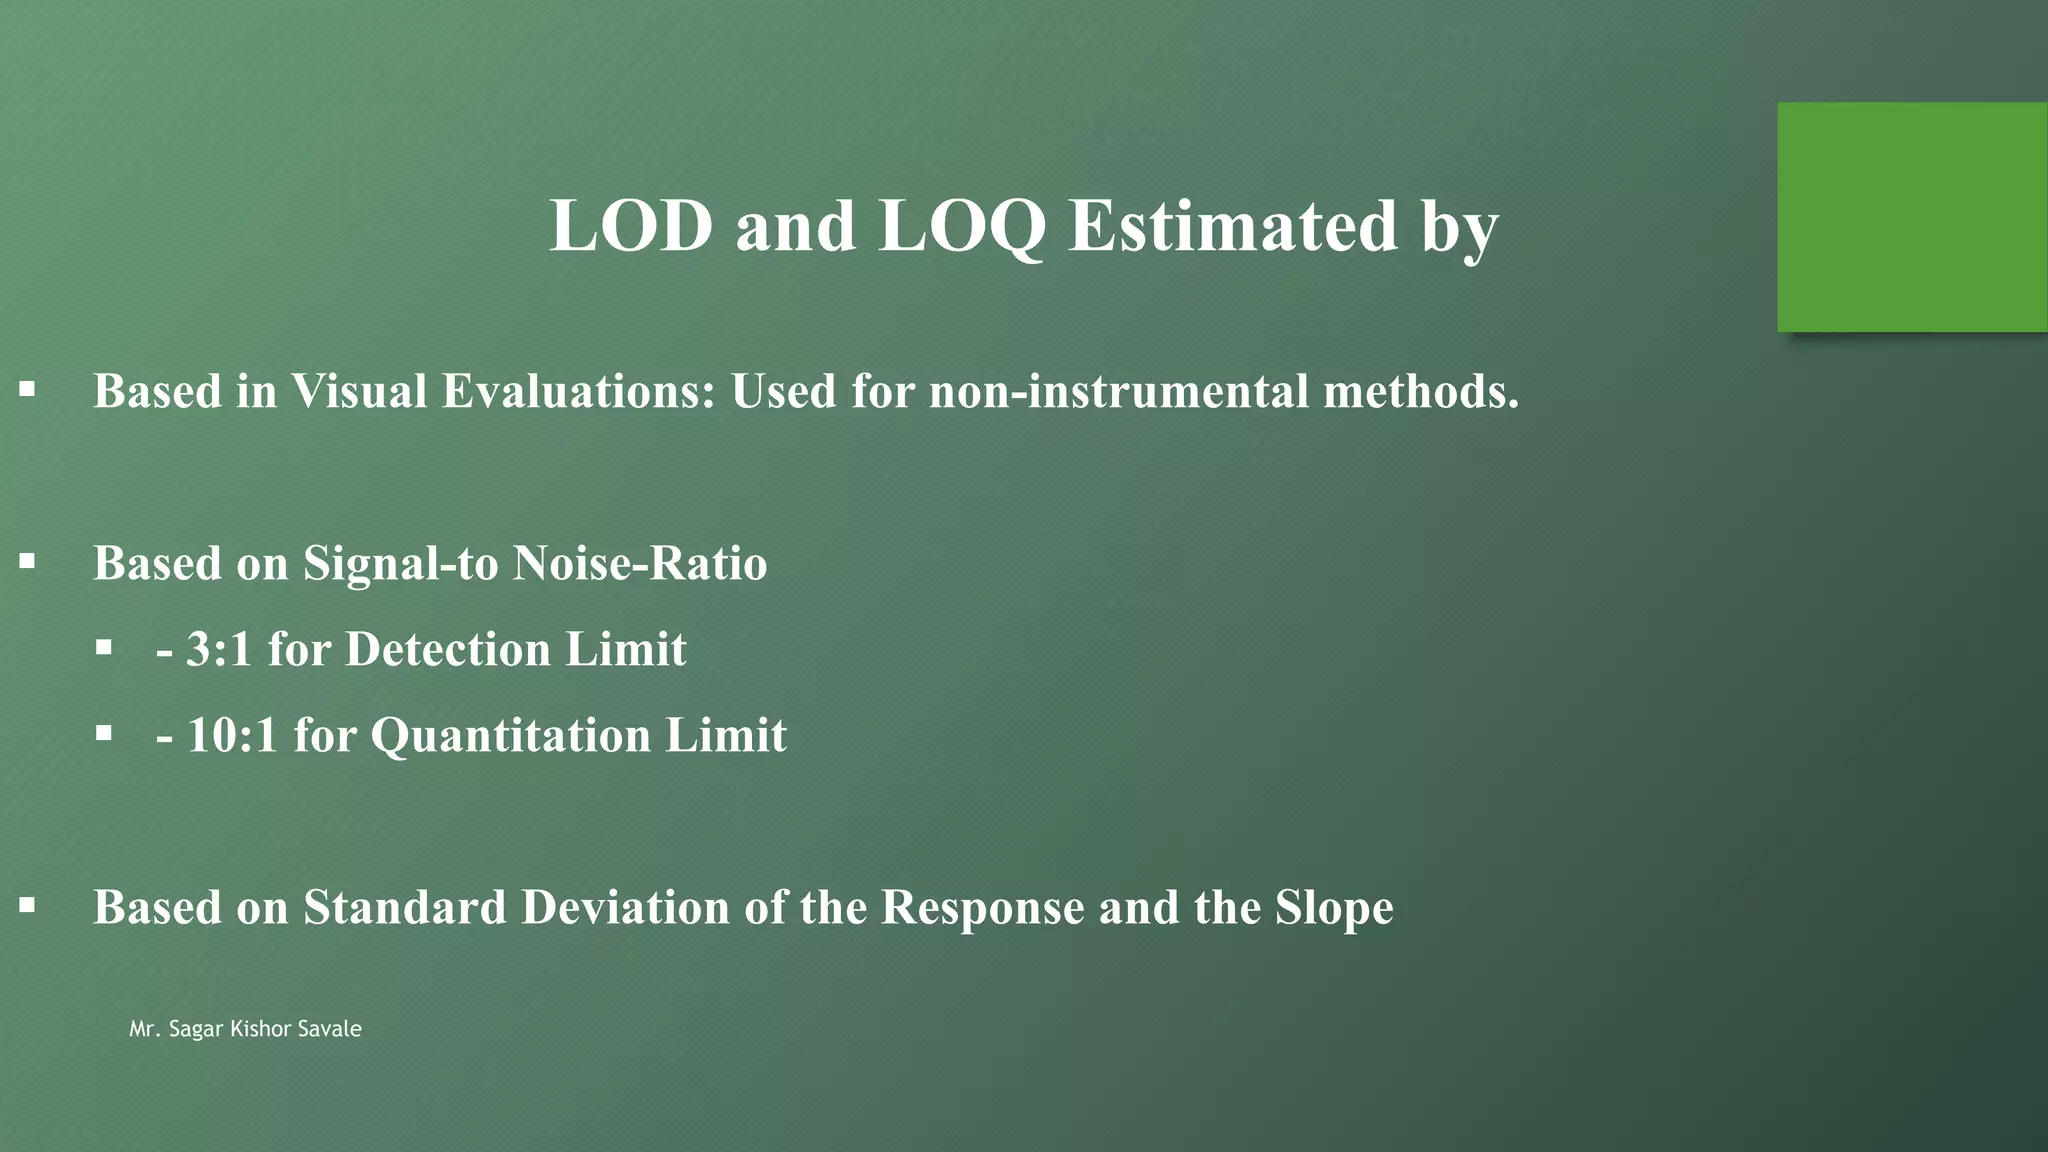
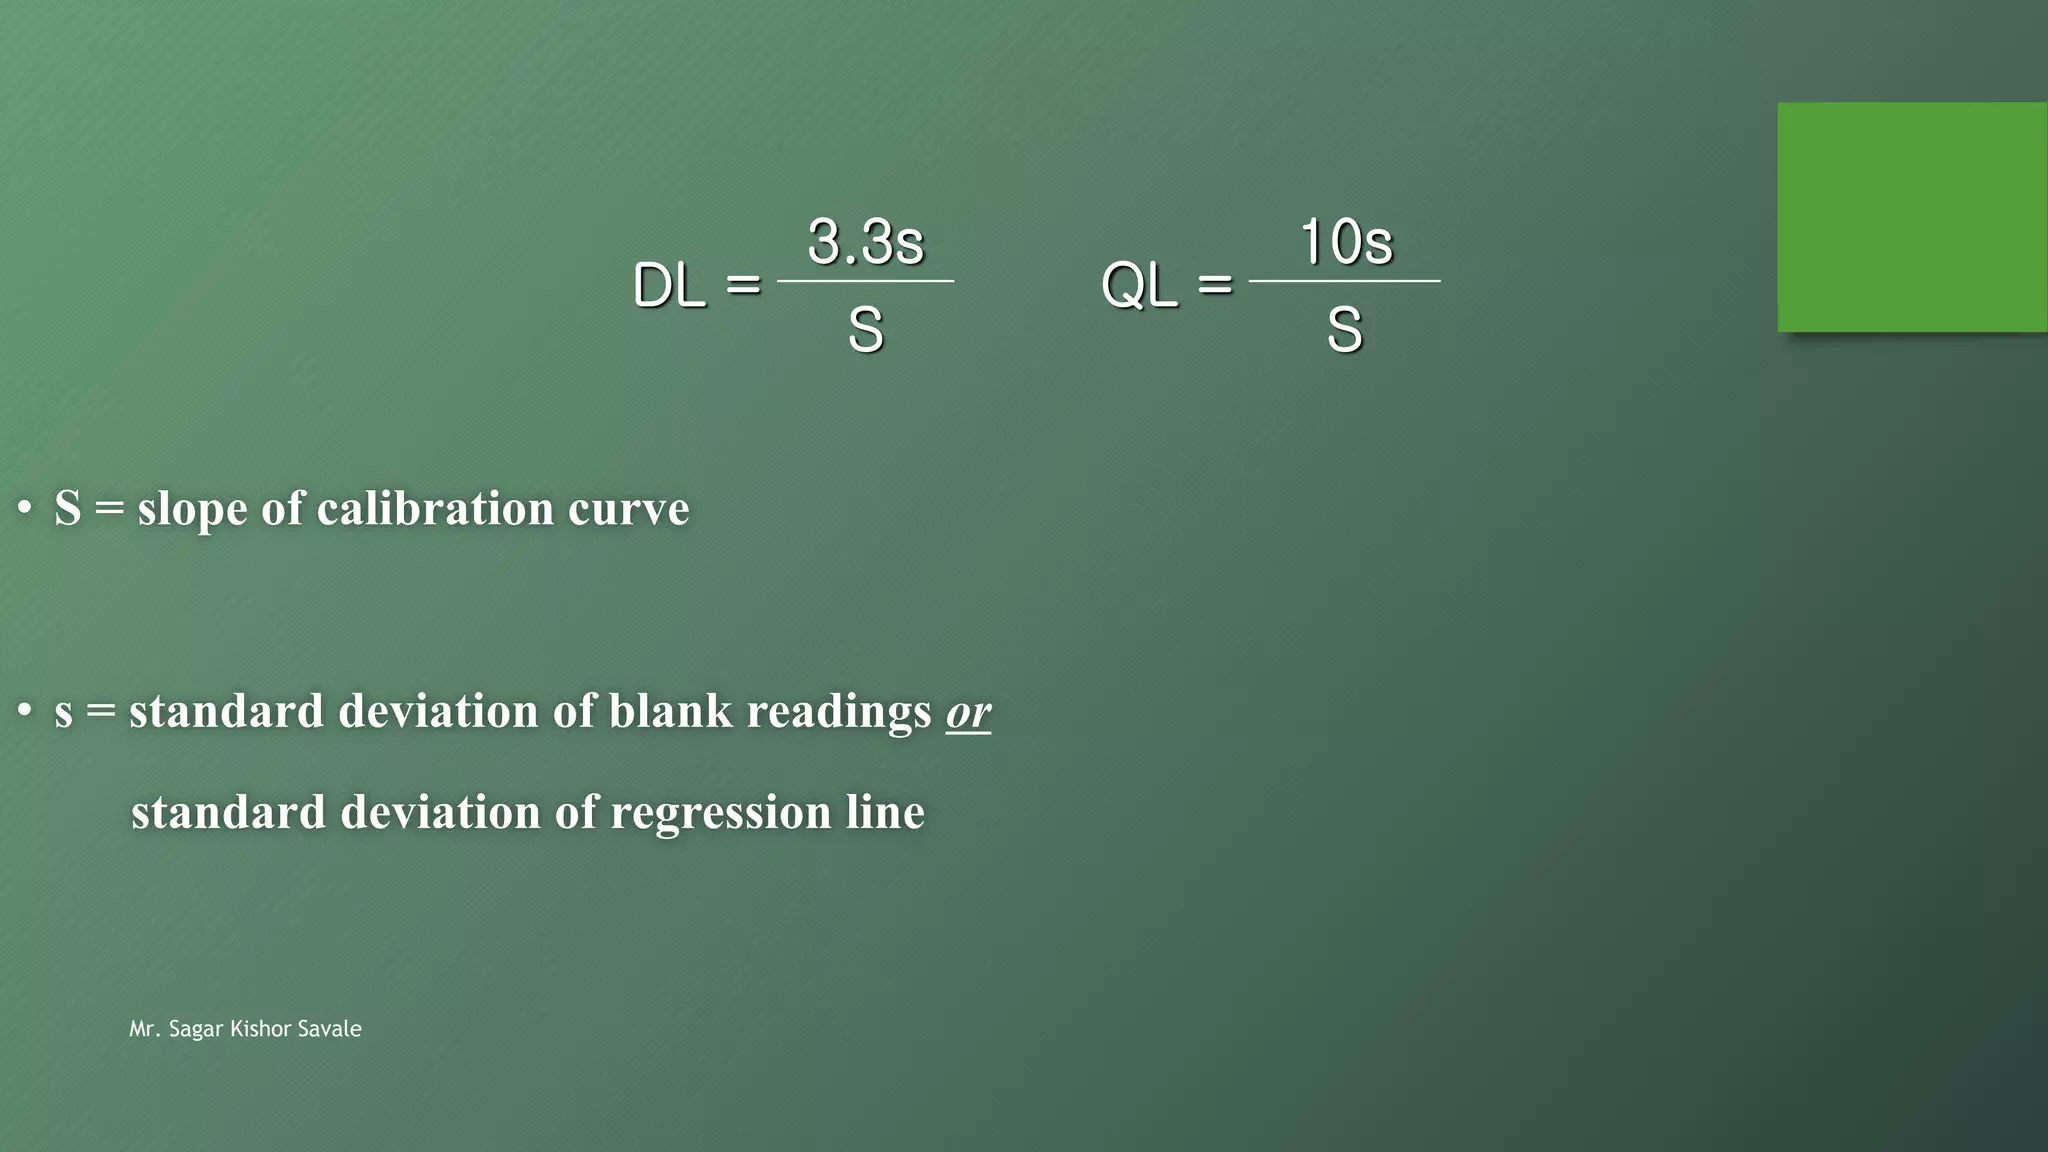


The document outlines the critical role of analytical method validation in drug development, emphasizing its necessity for ensuring accuracy, precision, and reliability in results. It details the validation process, considerations, and various parameters like accuracy, precision, specificity, linearity, and ranges alongside published guidelines from regulatory authorities. Additionally, it discusses concepts like limit of detection (LOD), limit of quantitation (LOQ), robustness, and the importance of appropriate training and documentation.