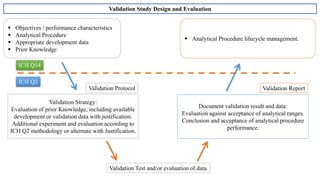
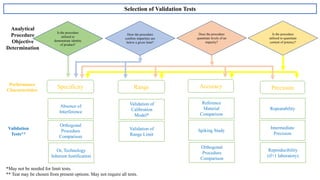
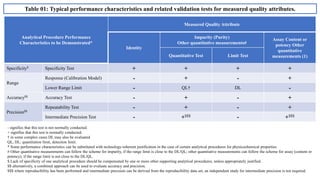
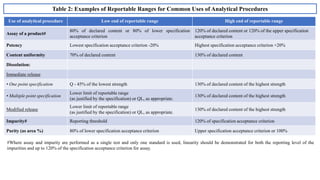
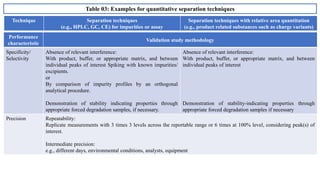
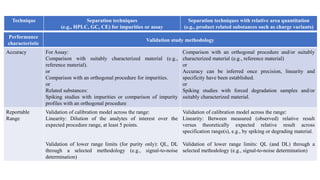
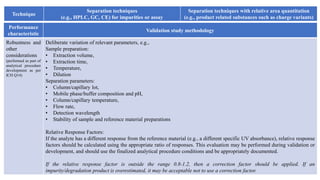
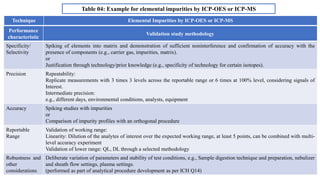
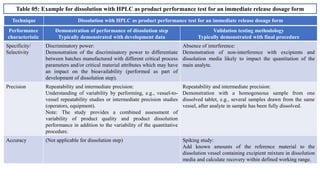
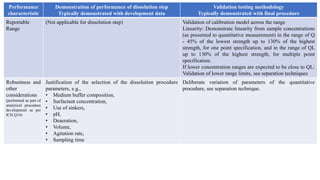
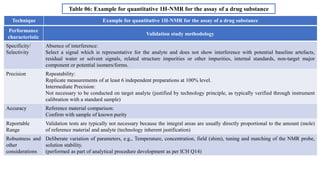
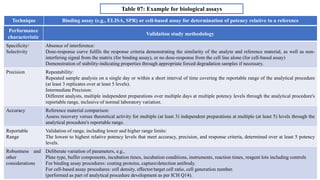
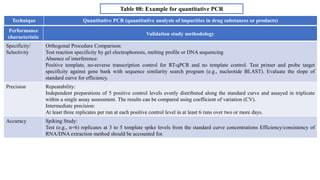
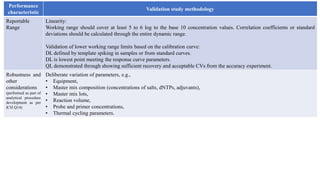
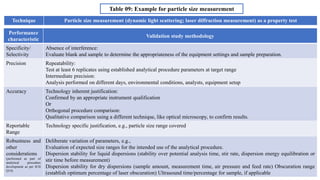
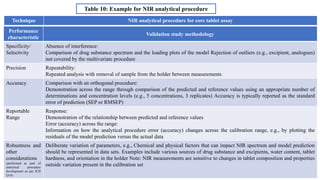
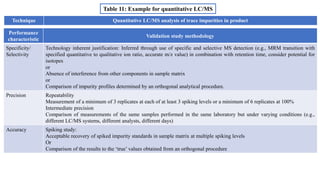
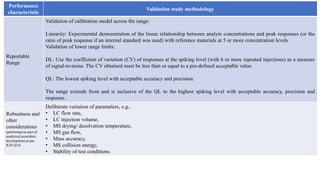
SlideShare a Scribd company logo
1 of 20
INTERNATIONAL COUNCIL FOR HARMONISATION OF TECHNICAL REQUIREMENTS
FOR PHARMACEUTICALS FOR HUMAN USE ICH HARMONISED GUIDELINE
Chandra Prakash Singh
VALIDATION OF ANALYTICAL PROCEDURES
Q2(R2)
Validation Study Design and Evaluation
 Objectives / performance characteristics
 Analytical Procedure
 Appropriate development data
 Prior Knowledge
 Analytical Procedure lifecycle management.
ICH Q14
ICH Q2
Validation Strategy:
Evaluation of prior Knowledge, including available
development or validation data with justification.
Additional experiment and evaluation according to
ICH Q2 methodology or alternate with Justification.
Document validation result and data:
Evaluation against acceptance of analytical ranges.
Conclusion and acceptance of analytical procedure
performance.
Validation Protocol Validation Report
Validation Test and/or evaluation of data
Is the procedure
utilized to
demonstrate identity
of product?
Dose the procedure
confirm impurities are
below a given limit?
Selection of Validation Tests
Does the procedure
quantitate levels of an
impurity?
Is the procedure
utilized to quantitate
content of potency?
Analytical
Procedure
Objective
Determination
Performance
Characteristics
Validation
Tests**
*May not be needed for limit tests.
** Teat may be chosen from present options. May not require all tests.
Specificity Range Accuracy Precision
Absence of
Interference
Orthogonal
Procedure
Comparison
Or, Technology
Inherent Justification
Validation of
Calibration
Model*
Validation of
Range Limit
Reference
Material
Comparison
Spiking Study
Orthogonal
Procedure
Comparison
Repeatability
Intermediate
Precision
Reproducibility
(if>1 laboratory)
Table 01: Typical performance characteristics and related validation tests for measured quality attributes.
Analytical Procedure Performance
Characteristics to be Demonstrated*
Measured Quality Attribute
Identity
Impurity (Purity)
Other quantitative measurements#
Assay Content or
potency Other
quantitative
measurements (1)
Quantitative Test Limit Test
Specificity$ Specificity Test + + + +
Range
Response (Calibration Model) - + - +
Lower Range Limit - QL† DL -
Accuracy$$ Accuracy Test - + - +
Precision$$
Repeatability Test - + - +
Intermediate Precision Test - +$$$ - +$$$
- signifies that this test is not normally conducted.
+ signifies that this test is normally conducted.
† in some complex cases DL may also be evaluated
QL, DL: quantitation limit, detection limit.
* Some performance characteristics can be substituted with technology-inherent justification in the case of certain analytical procedures for physicochemical properties.
# Other quantitative measurements can follow the scheme for impurity, if the range limit is close to the DL/QL; other quantitative measurements can follow the scheme for assay (content or
potency), if the range limit is not close to the DL/QL.
$ Lack of specificity of one analytical procedure should be compensated by one or more other supporting analytical procedures, unless appropriately justified.
$$ alternatively, a combined approach can be used to evaluate accuracy and precision.
$$$ where reproducibility has been performed and intermediate precision can be derived from the reproducibility data set, an independent study for intermediate precision is not required.
Table 2: Examples of Reportable Ranges for Common Uses of Analytical Procedures
Use of analytical procedure Low end of reportable range High end of reportable range
Assay of a product#
80% of declared content or 80% of lower specification
acceptance criterion
120% of declared content or 120% of the upper specification
acceptance criterion
Potency Lowest specification acceptance criterion -20% Highest specification acceptance criterion +20%
Content uniformity 70% of declared content 130% of declared content
Dissolution:
Immediate release
• One point specification Q - 45% of the lowest strength 130% of declared content of the highest strength
• Multiple point specification
Lower limit of reportable range
(as justified by the specification) or QL, as appropriate.
130% of declared content of the highest strength
Modified release
Lower limit of reportable range
(as justified by the specification) or QL, as appropriate.
130% of declared content of the highest strength
Impurity# Reporting threshold 120% of specification acceptance criterion
Purity (as area %) 80% of lower specification acceptance criterion Upper specification acceptance criterion or 100%
#Where assay and impurity are performed as a single test and only one standard is used, linearity should be demonstrated for both the reporting level of the
impurities and up to 120% of the specification acceptance criterion for assay.
Performance
characteristic
Validation study methodology
Specificity/
Selectivity
Absence of relevant interference:
With product, buffer, or appropriate matrix, and between
individual peaks of interest Spiking with known impurities/
excipients.
or
By comparison of impurity profiles by an orthogonal
analytical procedure.
Demonstration of stability indicating properties through
appropriate forced degradation samples, if necessary.
Absence of relevant interference:
With product, buffer, or appropriate matrix, and between
individual peaks of interest
Demonstration of stability-indicating properties through
appropriate forced degradation samples if necessary
Precision Repeatability:
Replicate measurements with 3 times 3 levels across the reportable range or 6 times at 100% level, considering peak(s) of
interest.
Intermediate precision:
e.g., different days, environmental conditions, analysts, equipment
Technique Separation techniques
(e.g., HPLC, GC, CE) for impurities or assay
Separation techniques with relative area quantitation
(e.g., product related substances such as charge variants)
Table 03: Examples for quantitative separation techniques
Performance
characteristic
Validation study methodology
Accuracy For Assay:
Comparison with suitably characterized material (e.g.,
reference material).
or
Comparison with an orthogonal procedure for impurities.
or
Related substances:
Spiking studies with impurities or comparison of impurity
profiles with an orthogonal procedure
Comparison with an orthogonal procedure and/or suitably
characterized material (e.g., reference material)
or
Accuracy can be inferred once precision, linearity and
specificity have been established.
or
Spiking studies with forced degradation samples and/or
suitably characterized material.
Reportable
Range
Validation of calibration model across the range:
Linearity: Dilution of the analytes of interest over the
expected procedure range, at least 5 points.
Validation of lower range limits (for purity only): QL, DL
through a selected methodology (e.g., signal-to-noise
determination)
Validation of calibration model across the range:
Linearity: Between measured (observed) relative result
versus theoretically expected relative result across
specification range(s), e.g., by spiking or degrading material.
Validation of lower range limits: QL (and DL) through a
selected methodology (e.g., signal-to-noise determination)
Technique Separation techniques
(e.g., HPLC, GC, CE) for impurities or assay
Separation techniques with relative area quantitation
(e.g., product related substances such as charge variants)
Performance
characteristic
Validation study methodology
Robustness and
other
considerations
(performed as part of
analytical procedure
development as per
ICH Q14)
Deliberate variation of relevant parameters, e.g.,
Sample preparation:
• Extraction volume,
• Extraction time,
• Temperature,
• Dilution
Separation parameters:
• Column/capillary lot,
• Mobile phase/buffer composition and pH,
• Column/capillary temperature,
• Flow rate,
• Detection wavelength
• Stability of sample and reference material preparations
Relative Response Factors:
If the analyte has a different response from the reference material (e.g., a different specific UV absorbance), relative response
factors should be calculated using the appropriate ratio of responses. This evaluation may be performed during validation or
development, and should use the finalized analytical procedure conditions and be appropriately documented.
If the relative response factor is outside the range 0.8-1.2, then a correction factor should be applied. If an
impurity/degradation product is overestimated, it may be acceptable not to use a correction factor.
Technique
Separation techniques
(e.g., HPLC, GC, CE) for impurities or assay
Separation techniques with relative area quantitation
(e.g., product related substances such as charge variants)
Performance
characteristic
Validation study methodology
Specificity/
Selectivity
Spiking of elements into matrix and demonstration of sufficient noninterference and confirmation of accuracy with the
presence of components (e.g., carrier gas, impurities, matrix).
or
Justification through technology/prior knowledge (e.g., specificity of technology for certain isotopes).
Precision Repeatability:
Replicate measurements with 3 times 3 levels across the reportable range or 6 times at 100% level, considering signals of
Interest.
Intermediate precision:
e.g., different days, environmental conditions, analysts, equipment
Accuracy Spiking studies with impurities
or
Comparison of impurity profiles with an orthogonal procedure
Reportable
Range
Validation of working range:
Linearity: Dilution of the analytes of interest over the expected working range, at least 5 points, can be combined with multi-
level accuracy experiment
Validation of lower range: QL, DL through a selected methodology
Robustness and
other
considerations
Deliberate variation of parameters and stability of test conditions, e.g., Sample digestion technique and preparation, nebulizer
and sheath flow settings, plasma settings.
(performed as part of analytical procedure development as per ICH Q14)
Technique Elemental Impurities by ICP-OES or ICP-MS
Table 04: Example for elemental impurities by ICP-OES or ICP-MS
Performance
characteristic
Demonstration of performance of dissolution step
Typically demonstrated with development data
Validation testing methodology
Typically demonstrated with final procedure
Specificity/
Selectivity
Discriminatory power:
Demonstration of the discriminatory power to differentiate
between batches manufactured with different critical process
parameters and/or critical material attributes which may have
an impact on the bioavailability (performed as part of
development of dissolution step).
Absence of interference:
Demonstration of non-interference with excipients and
dissolution media likely to impact the quantitation of the
main analyte.
Precision Repeatability and intermediate precision:
Understanding of variability by performing, e.g., vessel-to-
vessel repeatability studies or intermediate precision studies
(operators, equipment).
Note: The study provides a combined assessment of
variability of product quality and product dissolution
performance in addition to the variability of the quantitative
procedure.
Repeatability and intermediate precision:
Demonstration with a homogeneous sample from one
dissolved tablet, e.g., several samples drawn from the same
vessel, after analyte in sample has been fully dissolved.
Accuracy (Not applicable for dissolution step) Spiking study:
Add known amounts of the reference material to the
dissolution vessel containing excipient mixture in dissolution
media and calculate recovery within defined working range.
Technique Dissolution with HPLC as product performance test for an immediate release dosage form
Table 05: Example for dissolution with HPLC as product performance test for an immediate release dosage form
Performance
characteristic
Demonstration of performance of dissolution step
Typically demonstrated with development data
Validation testing methodology
Typically demonstrated with final procedure
Reportable
Range
(Not applicable for dissolution step) Validation of calibration model across the range
Linearity: Demonstrate linearity from sample concentrations
(as presented to quantitative measurement) in the range of Q
- 45% of the lowest strength up to 130% of the highest
strength, for one point specification, and in the range of QL
up to 130% of the highest strength, for multiple point
specification.
If lower concentration ranges are expected to be close to QL:
Validation of lower range limits, see separation techniques
Robustness and
other
considerations
(performed as part of
analytical procedure
development as per
ICH Q14)
Justification of the selection of the dissolution procedure
parameters, e.g.,
• Medium buffer composition,
• Surfactant concentration,
• Use of sinkers,
• pH,
• Deaeration,
• Volume,
• Agitation rate,
• Sampling time
Deliberate variation of parameters of the quantitative
procedure, see separation technique.
Performance
characteristic
Validation study methodology
Specificity/
Selectivity
Absence of interference:
Select a signal which is representative for the analyte and does not show interference with potential baseline artefacts,
residual water or solvent signals, related structure impurities or other impurities, internal standards, non-target major
component or potential isomers/forms.
Precision Repeatability:
Replicate measurements of at least 6 independent preparations at 100% level.
Intermediate Precision:
Not necessary to be conducted on target analyte (justified by technology principle, as typically verified through instrument
calibration with a standard sample)
Accuracy Reference material comparison:
Confirm with sample of known purity
Reportable
Range
Validation tests are typically not necessary because the integral areas are usually directly proportional to the amount (mole)
of reference material and analyte (technology inherent justification)
Robustness and
other
considerations
Deliberate variation of parameters, e.g., Temperature, concentration, field (shim), tuning and matching of the NMR probe,
solution stability.
(performed as part of analytical procedure development as per ICH Q14)
Technique Example for quantitative 1H-NMR for the assay of a drug substance
Table 06: Example for quantitative 1H-NMR for the assay of a drug substance
Performance
characteristic
Validation study methodology
Specificity/
Selectivity
Absence of interference:
Dose-response curve fulfils the response criteria demonstrating the similarity of the analyte and reference material, as well as non-
interfering signal from the matrix (for binding assay), or no dose-response from the cell line alone (for cell-based assay)
Demonstration of stability-indicating properties through appropriate forced degradation samples if necessary.
Precision Repeatability:
Repeated sample analysis on a single day or within a short interval of time covering the reportable range of the analytical procedure
(at least 3 replicates over at least 5 levels).
Intermediate Precision:
Different analysts, multiple independent preparations over multiple days at multiple potency levels through the analytical procedure's
reportable range, inclusive of normal laboratory variation.
Accuracy Reference material comparison:
Assess recovery versus theoretical activity for multiple (at least 3) independent preparations at multiple (at least 5) levels through the
analytical procedure's reportable range.
Reportable
Range
Validation of range, including lower and higher range limits:
The lowest to highest relative potency levels that meet accuracy, precision, and response criteria, determined over at least 5 potency
levels.
Robustness and
other
considerations
Deliberate variation of parameters, e.g.,
Plate type, buffer components, incubation times, incubation conditions, instruments, reaction times, reagent lots including controls
For binding assay procedures: coating proteins, capture/detection antibody.
For cell-based assay procedures: cell density, effector/target cell ratio, cell generation number.
(performed as part of analytical procedure development as per ICH Q14).
Technique Binding assay (e.g., ELISA, SPR) or cell-based assay for determination of potency relative to a reference
Table 07: Example for biological assays
Performance
characteristic
Validation study methodology
Specificity/
Selectivity
Orthogonal Procedure Comparison:
Test reaction specificity by gel electrophoresis, melting profile or DNA sequencing
Absence of interference:
Positive template, no-reverse transcription control for RT-qPCR and no template control. Test primer and probe target
specificity against gene bank with sequence similarity search program (e.g., nucleotide BLAST). Evaluate the slope of
standard curve for efficiency.
Precision Repeatability:
Independent preparations of 5 positive control levels evenly distributed along the standard curve and assayed in triplicate
within a single assay assessment. The results can be compared using coefficient of variation (CV).
Intermediate precision:
At least three replicates per run at each positive control level in at least 6 runs over two or more days.
Accuracy Spiking Study:
Test (e.g., n=6) replicates at 3 to 5 template spike levels from the standard curve concentrations Efficiency/consistency of
RNA/DNA extraction method should be accounted for.
Technique Quantitative PCR (quantitative analysis of impurities in drug substances or products)
Table 08: Example for quantitative PCR
Performance
characteristic
Validation study methodology
Reportable
Range
Linearity:
Working range should cover at least 5 to 6 log to the base 10 concentration values. Correlation coefficients or standard
deviations should be calculated through the entire dynamic range.
Validation of lower working range limits based on the calibration curve:
DL defined by template spiking in samples or from standard curves.
DL is lowest point meeting the response curve parameters.
QL demonstrated through showing sufficient recovery and acceptable CVs from the accuracy experiment.
Robustness and
other
considerations
(performed as part of
analytical procedure
development as per
ICH Q14)
Deliberate variation of parameters, e.g.,
• Equipment,
• Master mix composition (concentrations of salts, dNTPs, adjuvants),
• Master mix lots,
• Reaction volume,
• Probe and primer concentrations,
• Thermal cycling parameters.
Performance
characteristic
Validation study methodology
Specificity/
Selectivity
Absence of interference:
Evaluate blank and sample to determine the appropriateness of the equipment settings and sample preparation.
Precision Repeatability:
Test at least 6 replicates using established analytical procedure parameters at target range
Intermediate precision:
Analysis performed on different days, environmental conditions, analysts, equipment setup
Accuracy Technology inherent justification:
Confirmed by an appropriate instrument qualification
Or
Orthogonal procedure comparison:
Qualitative comparison using a different technique, like optical microscopy, to confirm results.
Reportable
Range
Technology specific justification, e.g., particle size range covered
Robustness and
other
considerations
(performed as part of
analytical procedure
development as per ICH
Q14)
Deliberate variation of parameters, e.g.,
Evaluation of expected size ranges for the intended use of the analytical procedure.
Dispersion stability for liquid dispersions (stability over potential analysis time, stir rate, dispersion energy equilibration or
stir time before measurement)
Dispersion stability for dry dispersions (sample amount, measurement time, air pressure and feed rate) Obscuration range
(establish optimum percentage of laser obscuration) Ultrasound time/percentage for sample, if applicable
Technique Particle size measurement (dynamic light scattering; laser diffraction measurement) as a property test
Table 09: Example for particle size measurement
Performance
characteristic
Validation study methodology
Specificity/
Selectivity
Absence of interference:
Comparison of drug substance spectrum and the loading plots of the model Rejection of outliers (e.g., excipient, analogues)
not covered by the multivariate procedure
Precision Repeatability:
Repeated analysis with removal of sample from the holder between measurements
Accuracy Comparison with an orthogonal procedure:
Demonstration across the range through comparison of the predicted and reference values using an appropriate number of
determinations and concentration levels (e.g., 5 concentrations, 3 replicates) Accuracy is typically reported as the standard
error of prediction (SEP or RMSEP)
Reportable
Range
Response:
Demonstration of the relationship between predicted and reference values
Error (accuracy) across the range:
Information on how the analytical procedure error (accuracy) changes across the calibration range, e.g., by plotting the
residuals of the model prediction versus the actual data
Robustness and
other
considerations
(performed as part of
analytical procedure
development as per ICH
Q14)
Deliberate variation of parameters, e.g., Chemical and physical factors that can impact NIR spectrum and model prediction
should be represented in data sets. Examples include various sources of drug substance and excipients, water content, tablet
hardness, and orientation in the holder Note: NIR measurements are sensitive to changes in tablet composition and properties
outside variation present in the calibration set
Technique NIR analytical procedure for core tablet assay
Table 10: Example for NIR analytical procedure
Performance
characteristic
Validation study methodology
Specificity/
Selectivity
Technology inherent justification: Inferred through use of specific and selective MS detection (e.g., MRM transition with
specified quantitative to qualitative ion ratio, accurate m/z value) in combination with retention time, consider potential for
isotopes
or
Absence of interference from other components in sample matrix
or
Comparison of impurity profiles determined by an orthogonal analytical procedure.
Precision Repeatability
Measurement of a minimum of 3 replicates at each of at least 3 spiking levels or a minimum of 6 replicates at 100%
Intermediate precision
Comparison of measurements of the same samples performed in the same laboratory but under varying conditions (e.g.,
different LC/MS systems, different analysts, different days)
Accuracy Spiking study:
Acceptable recovery of spiked impurity standards in sample matrix at multiple spiking levels
Or
Comparison of the results to the ‘true’ values obtained from an orthogonal procedure
Technique Quantitative LC/MS analysis of trace impurities in product
Table 11: Example for quantitative LC/MS
Performance
characteristic
Validation study methodology
Reportable
Range
Validation of calibration model across the range:
Linearity: Experimental demonstration of the linear relationship between analyte concentrations and peak responses (or the
ratio of peak response if an internal standard was used) with reference materials at 5 or more concentration levels
Validation of lower range limits:
DL: Use the coefficient of variation (CV) of responses at the spiking level (with 6 or more repeated injections) as a measure
of signal-to-noise. The CV obtained must be less than or equal to a pre-defined acceptable value.
QL: The lowest spiking level with acceptable accuracy and precision.
The range extends from and is inclusive of the QL to the highest spiking level with acceptable accuracy, precision and
response.
Robustness and
other
considerations
(performed as part of
analytical procedure
development as per
ICH Q14)
Deliberate variation of parameters, e.g.,
• LC flow rate,
• LC injection volume,
• MS drying/ desolvation temperature,
• MS gas flow,
• Mass accuracy,
• MS collision energy,
• Stability of test conditions.
Thanks

More Related Content

Similar to VALIDATION OF ANALYTICAL PROCEDURES Q2(R2)

Analytical Method Validation.pdf
Analytical Method Validation.pdfAnalytical Method Validation.pdf
Analytical Method Validation.pdfHiteshGajjar7
 
validation of analytical method used in cleaning
validation of analytical method used in cleaningvalidation of analytical method used in cleaning
validation of analytical method used in cleaningKUNDLAJAYALAKSHMI
 
Analytical Method Validation basics by Dr. A. Amsavel
Analytical Method Validation  basics by Dr. A. AmsavelAnalytical Method Validation  basics by Dr. A. Amsavel
Analytical Method Validation basics by Dr. A. AmsavelDr. Amsavel A
 
Analytical method validation by manoj ingale(best ppts)
Analytical method validation by manoj ingale(best ppts)Analytical method validation by manoj ingale(best ppts)
Analytical method validation by manoj ingale(best ppts)Indus Biotech Pvt.Ltd.
 
Analytical mehod validation explained sadasiva
Analytical mehod validation explained sadasivaAnalytical mehod validation explained sadasiva
Analytical mehod validation explained sadasivaSada Siva Rao Maddiguntla
 
Analytical mehod validation explained sadasiva
Analytical mehod validation explained sadasivaAnalytical mehod validation explained sadasiva
Analytical mehod validation explained sadasivaSada Siva Rao Maddiguntla
 
Analytical Method Validation
Analytical Method ValidationAnalytical Method Validation
Analytical Method ValidationStefan Holt
 
Validation of Analytical method.ppt
Validation of Analytical method.pptValidation of Analytical method.ppt
Validation of Analytical method.pptPriyanka Yadav
 
analytical method validation.pptx
analytical method validation.pptxanalytical method validation.pptx
analytical method validation.pptxLaxmidharSahoo11
 
analytical method validation and validation of hplc
analytical method validation and validation of hplcanalytical method validation and validation of hplc
analytical method validation and validation of hplcvenkatesh thota
 
Assay-Method validation-PPT _slide
Assay-Method validation-PPT _slideAssay-Method validation-PPT _slide
Assay-Method validation-PPT _slideBhanu Prakash N
 
Analytical Method Validation.pptx
Analytical Method Validation.pptxAnalytical Method Validation.pptx
Analytical Method Validation.pptxBholakant raut
 
Ich guidelines for validation final
Ich guidelines for validation finalIch guidelines for validation final
Ich guidelines for validation finalsumel ashique
 
Analytical methods,cleaning validation
Analytical methods,cleaning validationAnalytical methods,cleaning validation
Analytical methods,cleaning validationSai Vivek Kosaraju
 
Analytical Methods Validation| PV M Pharmacy QA
Analytical Methods Validation| PV M Pharmacy QAAnalytical Methods Validation| PV M Pharmacy QA
Analytical Methods Validation| PV M Pharmacy QAGhanshyam Nawale
 
Method Validation - ICH /USP Validation, Linearity and Repeatability
Method Validation - ICH /USP Validation, Linearity and Repeatability Method Validation - ICH /USP Validation, Linearity and Repeatability
Method Validation - ICH /USP Validation, Linearity and Repeatability labgo
 

Similar to VALIDATION OF ANALYTICAL PROCEDURES Q2(R2) (20)

Analytical Method Validation
Analytical Method ValidationAnalytical Method Validation
Analytical Method Validation
 
Analytical Method Validation.pdf
Analytical Method Validation.pdfAnalytical Method Validation.pdf
Analytical Method Validation.pdf
 
validation of analytical method used in cleaning
validation of analytical method used in cleaningvalidation of analytical method used in cleaning
validation of analytical method used in cleaning
 
Analytical Method Validation basics by Dr. A. Amsavel
Analytical Method Validation  basics by Dr. A. AmsavelAnalytical Method Validation  basics by Dr. A. Amsavel
Analytical Method Validation basics by Dr. A. Amsavel
 
Analytical method validation by manoj ingale(best ppts)
Analytical method validation by manoj ingale(best ppts)Analytical method validation by manoj ingale(best ppts)
Analytical method validation by manoj ingale(best ppts)
 
Analytical mehod validation explained sadasiva
Analytical mehod validation explained sadasivaAnalytical mehod validation explained sadasiva
Analytical mehod validation explained sadasiva
 
Analytical mehod validation explained sadasiva
Analytical mehod validation explained sadasivaAnalytical mehod validation explained sadasiva
Analytical mehod validation explained sadasiva
 
Analytical Method Validation
Analytical Method ValidationAnalytical Method Validation
Analytical Method Validation
 
HPLC validation.ppt
HPLC validation.pptHPLC validation.ppt
HPLC validation.ppt
 
Validation of Analytical method.ppt
Validation of Analytical method.pptValidation of Analytical method.ppt
Validation of Analytical method.ppt
 
Validation
Validation Validation
Validation
 
analytical method validation.pptx
analytical method validation.pptxanalytical method validation.pptx
analytical method validation.pptx
 
analytical method validation and validation of hplc
analytical method validation and validation of hplcanalytical method validation and validation of hplc
analytical method validation and validation of hplc
 
Assay-Method validation-PPT _slide
Assay-Method validation-PPT _slideAssay-Method validation-PPT _slide
Assay-Method validation-PPT _slide
 
Analytical Method Validation.pptx
Analytical Method Validation.pptxAnalytical Method Validation.pptx
Analytical Method Validation.pptx
 
Q2 r1 guidelines
Q2 r1 guidelinesQ2 r1 guidelines
Q2 r1 guidelines
 
Ich guidelines for validation final
Ich guidelines for validation finalIch guidelines for validation final
Ich guidelines for validation final
 
Analytical methods,cleaning validation
Analytical methods,cleaning validationAnalytical methods,cleaning validation
Analytical methods,cleaning validation
 
Analytical Methods Validation| PV M Pharmacy QA
Analytical Methods Validation| PV M Pharmacy QAAnalytical Methods Validation| PV M Pharmacy QA
Analytical Methods Validation| PV M Pharmacy QA
 
Method Validation - ICH /USP Validation, Linearity and Repeatability
Method Validation - ICH /USP Validation, Linearity and Repeatability Method Validation - ICH /USP Validation, Linearity and Repeatability
Method Validation - ICH /USP Validation, Linearity and Repeatability
 

More from Chandra Prakash Singh

VALIDATION OF ANALYTICAL PROCEDURES Q2(R2) and Q14 - Terms and Definitions
VALIDATION OF ANALYTICAL PROCEDURES Q2(R2) and Q14 - Terms and DefinitionsVALIDATION OF ANALYTICAL PROCEDURES Q2(R2) and Q14 - Terms and Definitions
VALIDATION OF ANALYTICAL PROCEDURES Q2(R2) and Q14 - Terms and DefinitionsChandra Prakash Singh
 
NDSRIs - Nitrosamine Drug Substance-Related Impurities (NDSRIs)
NDSRIs - Nitrosamine Drug Substance-Related Impurities (NDSRIs)NDSRIs - Nitrosamine Drug Substance-Related Impurities (NDSRIs)
NDSRIs - Nitrosamine Drug Substance-Related Impurities (NDSRIs)Chandra Prakash Singh
 
Currently Identified Risk Factors for Presence of Nitrosamines.pptx
Currently Identified Risk Factors for Presence of Nitrosamines.pptxCurrently Identified Risk Factors for Presence of Nitrosamines.pptx
Currently Identified Risk Factors for Presence of Nitrosamines.pptxChandra Prakash Singh
 
X-Rays The basic understanding of XRD analysis
X-Rays The basic understanding of XRD analysisX-Rays The basic understanding of XRD analysis
X-Rays The basic understanding of XRD analysisChandra Prakash Singh
 
X-RAY POWDER DIFFRACTION (XRPD).pptx
X-RAY POWDER DIFFRACTION (XRPD).pptxX-RAY POWDER DIFFRACTION (XRPD).pptx
X-RAY POWDER DIFFRACTION (XRPD).pptxChandra Prakash Singh
 
LCMS - Ion Optics Path and Parameters.pptx
LCMS - Ion Optics Path and Parameters.pptxLCMS - Ion Optics Path and Parameters.pptx
LCMS - Ion Optics Path and Parameters.pptxChandra Prakash Singh
 
Analytical procedures life cycle management
Analytical procedures life cycle managementAnalytical procedures life cycle management
Analytical procedures life cycle managementChandra Prakash Singh
 

More from Chandra Prakash Singh (20)

VALIDATION OF ANALYTICAL PROCEDURES Q2(R2) and Q14 - Terms and Definitions
VALIDATION OF ANALYTICAL PROCEDURES Q2(R2) and Q14 - Terms and DefinitionsVALIDATION OF ANALYTICAL PROCEDURES Q2(R2) and Q14 - Terms and Definitions
VALIDATION OF ANALYTICAL PROCEDURES Q2(R2) and Q14 - Terms and Definitions
 
NDSRIs - Nitrosamine Drug Substance-Related Impurities (NDSRIs)
NDSRIs - Nitrosamine Drug Substance-Related Impurities (NDSRIs)NDSRIs - Nitrosamine Drug Substance-Related Impurities (NDSRIs)
NDSRIs - Nitrosamine Drug Substance-Related Impurities (NDSRIs)
 
Currently Identified Risk Factors for Presence of Nitrosamines.pptx
Currently Identified Risk Factors for Presence of Nitrosamines.pptxCurrently Identified Risk Factors for Presence of Nitrosamines.pptx
Currently Identified Risk Factors for Presence of Nitrosamines.pptx
 
LCMS_BASIC UNDERSTANDING.pdf
LCMS_BASIC UNDERSTANDING.pdfLCMS_BASIC UNDERSTANDING.pdf
LCMS_BASIC UNDERSTANDING.pdf
 
LCMS Type of Scan.pdf
LCMS Type of Scan.pdfLCMS Type of Scan.pdf
LCMS Type of Scan.pdf
 
X-Rays The basic understanding of XRD analysis
X-Rays The basic understanding of XRD analysisX-Rays The basic understanding of XRD analysis
X-Rays The basic understanding of XRD analysis
 
X-RAY POWDER DIFFRACTION (XRPD).pptx
X-RAY POWDER DIFFRACTION (XRPD).pptxX-RAY POWDER DIFFRACTION (XRPD).pptx
X-RAY POWDER DIFFRACTION (XRPD).pptx
 
Triplus500 HS working.pptx
Triplus500 HS working.pptxTriplus500 HS working.pptx
Triplus500 HS working.pptx
 
LCMS - Ion Optics Path and Parameters.pptx
LCMS - Ion Optics Path and Parameters.pptxLCMS - Ion Optics Path and Parameters.pptx
LCMS - Ion Optics Path and Parameters.pptx
 
Diverter Valve.pptx
Diverter Valve.pptxDiverter Valve.pptx
Diverter Valve.pptx
 
LCMS_interface.pptx
LCMS_interface.pptxLCMS_interface.pptx
LCMS_interface.pptx
 
Fitness for use part 1
Fitness for use part 1Fitness for use part 1
Fitness for use part 1
 
Analytical target profile 1
Analytical target profile 1Analytical target profile 1
Analytical target profile 1
 
Analytical control strategy 4
Analytical control strategy 4Analytical control strategy 4
Analytical control strategy 4
 
Analytical control strategy 3
Analytical control strategy 3Analytical control strategy 3
Analytical control strategy 3
 
Analytical control strategy 2
Analytical control strategy 2Analytical control strategy 2
Analytical control strategy 2
 
Analytical control strategy 1
Analytical control strategy 1Analytical control strategy 1
Analytical control strategy 1
 
Analytical procedures life cycle management
Analytical procedures life cycle managementAnalytical procedures life cycle management
Analytical procedures life cycle management
 
FID detector
FID detectorFID detector
FID detector
 
HPLC Column
HPLC ColumnHPLC Column
HPLC Column
 

Recently uploaded

Presiding Officer Training module 2024 lok sabha elections
Presiding Officer Training module 2024 lok sabha electionsPresiding Officer Training module 2024 lok sabha elections
Presiding Officer Training module 2024 lok sabha electionsanshu789521
 
Organic Name Reactions for the students and aspirants of Chemistry12th.pptx
Organic Name Reactions  for the students and aspirants of Chemistry12th.pptxOrganic Name Reactions  for the students and aspirants of Chemistry12th.pptx
Organic Name Reactions for the students and aspirants of Chemistry12th.pptxVS Mahajan Coaching Centre
 
How to Make a Pirate ship Primary Education.pptx
How to Make a Pirate ship Primary Education.pptxHow to Make a Pirate ship Primary Education.pptx
How to Make a Pirate ship Primary Education.pptxmanuelaromero2013
 
microwave assisted reaction. General introduction
microwave assisted reaction. General introductionmicrowave assisted reaction. General introduction
microwave assisted reaction. General introductionMaksud Ahmed
 
SOCIAL AND HISTORICAL CONTEXT - LFTVD.pptx
SOCIAL AND HISTORICAL CONTEXT - LFTVD.pptxSOCIAL AND HISTORICAL CONTEXT - LFTVD.pptx
SOCIAL AND HISTORICAL CONTEXT - LFTVD.pptxiammrhaywood
 
18-04-UA_REPORT_MEDIALITERAСY_INDEX-DM_23-1-final-eng.pdf
18-04-UA_REPORT_MEDIALITERAСY_INDEX-DM_23-1-final-eng.pdf18-04-UA_REPORT_MEDIALITERAСY_INDEX-DM_23-1-final-eng.pdf
18-04-UA_REPORT_MEDIALITERAСY_INDEX-DM_23-1-final-eng.pdfssuser54595a
 
Introduction to AI in Higher Education_draft.pptx
Introduction to AI in Higher Education_draft.pptxIntroduction to AI in Higher Education_draft.pptx
Introduction to AI in Higher Education_draft.pptxpboyjonauth
 
Contemporary philippine arts from the regions_PPT_Module_12 [Autosaved] (1).pptx
Contemporary philippine arts from the regions_PPT_Module_12 [Autosaved] (1).pptxContemporary philippine arts from the regions_PPT_Module_12 [Autosaved] (1).pptx
Contemporary philippine arts from the regions_PPT_Module_12 [Autosaved] (1).pptxRoyAbrique
 
Kisan Call Centre - To harness potential of ICT in Agriculture by answer farm...
Kisan Call Centre - To harness potential of ICT in Agriculture by answer farm...Kisan Call Centre - To harness potential of ICT in Agriculture by answer farm...
Kisan Call Centre - To harness potential of ICT in Agriculture by answer farm...Krashi Coaching
 
KSHARA STURA .pptx---KSHARA KARMA THERAPY (CAUSTIC THERAPY)————IMP.OF KSHARA ...
KSHARA STURA .pptx---KSHARA KARMA THERAPY (CAUSTIC THERAPY)————IMP.OF KSHARA ...KSHARA STURA .pptx---KSHARA KARMA THERAPY (CAUSTIC THERAPY)————IMP.OF KSHARA ...
KSHARA STURA .pptx---KSHARA KARMA THERAPY (CAUSTIC THERAPY)————IMP.OF KSHARA ...M56BOOKSTORE PRODUCT/SERVICE
 
Paris 2024 Olympic Geographies - an activity
Paris 2024 Olympic Geographies - an activityParis 2024 Olympic Geographies - an activity
Paris 2024 Olympic Geographies - an activityGeoBlogs
 
Separation of Lanthanides/ Lanthanides and Actinides
Separation of Lanthanides/ Lanthanides and ActinidesSeparation of Lanthanides/ Lanthanides and Actinides
Separation of Lanthanides/ Lanthanides and ActinidesFatimaKhan178732
 
ECONOMIC CONTEXT - LONG FORM TV DRAMA - PPT
ECONOMIC CONTEXT - LONG FORM TV DRAMA - PPTECONOMIC CONTEXT - LONG FORM TV DRAMA - PPT
ECONOMIC CONTEXT - LONG FORM TV DRAMA - PPTiammrhaywood
 
Hybridoma Technology ( Production , Purification , and Application )
Hybridoma Technology  ( Production , Purification , and Application  ) Hybridoma Technology  ( Production , Purification , and Application  )
Hybridoma Technology ( Production , Purification , and Application ) Sakshi Ghasle
 
A Critique of the Proposed National Education Policy Reform
A Critique of the Proposed National Education Policy ReformA Critique of the Proposed National Education Policy Reform
A Critique of the Proposed National Education Policy ReformChameera Dedduwage
 
Software Engineering Methodologies (overview)
Software Engineering Methodologies (overview)Software Engineering Methodologies (overview)
Software Engineering Methodologies (overview)eniolaolutunde
 
Science 7 - LAND and SEA BREEZE and its Characteristics
Science 7 - LAND and SEA BREEZE and its CharacteristicsScience 7 - LAND and SEA BREEZE and its Characteristics
Science 7 - LAND and SEA BREEZE and its CharacteristicsKarinaGenton
 

Recently uploaded (20)

Presiding Officer Training module 2024 lok sabha elections
Presiding Officer Training module 2024 lok sabha electionsPresiding Officer Training module 2024 lok sabha elections
Presiding Officer Training module 2024 lok sabha elections
 
Organic Name Reactions for the students and aspirants of Chemistry12th.pptx
Organic Name Reactions  for the students and aspirants of Chemistry12th.pptxOrganic Name Reactions  for the students and aspirants of Chemistry12th.pptx
Organic Name Reactions for the students and aspirants of Chemistry12th.pptx
 
How to Make a Pirate ship Primary Education.pptx
How to Make a Pirate ship Primary Education.pptxHow to Make a Pirate ship Primary Education.pptx
How to Make a Pirate ship Primary Education.pptx
 
Código Creativo y Arte de Software | Unidad 1
Código Creativo y Arte de Software | Unidad 1Código Creativo y Arte de Software | Unidad 1
Código Creativo y Arte de Software | Unidad 1
 
microwave assisted reaction. General introduction
microwave assisted reaction. General introductionmicrowave assisted reaction. General introduction
microwave assisted reaction. General introduction
 
SOCIAL AND HISTORICAL CONTEXT - LFTVD.pptx
SOCIAL AND HISTORICAL CONTEXT - LFTVD.pptxSOCIAL AND HISTORICAL CONTEXT - LFTVD.pptx
SOCIAL AND HISTORICAL CONTEXT - LFTVD.pptx
 
18-04-UA_REPORT_MEDIALITERAСY_INDEX-DM_23-1-final-eng.pdf
18-04-UA_REPORT_MEDIALITERAСY_INDEX-DM_23-1-final-eng.pdf18-04-UA_REPORT_MEDIALITERAСY_INDEX-DM_23-1-final-eng.pdf
18-04-UA_REPORT_MEDIALITERAСY_INDEX-DM_23-1-final-eng.pdf
 
Introduction to AI in Higher Education_draft.pptx
Introduction to AI in Higher Education_draft.pptxIntroduction to AI in Higher Education_draft.pptx
Introduction to AI in Higher Education_draft.pptx
 
Contemporary philippine arts from the regions_PPT_Module_12 [Autosaved] (1).pptx
Contemporary philippine arts from the regions_PPT_Module_12 [Autosaved] (1).pptxContemporary philippine arts from the regions_PPT_Module_12 [Autosaved] (1).pptx
Contemporary philippine arts from the regions_PPT_Module_12 [Autosaved] (1).pptx
 
Kisan Call Centre - To harness potential of ICT in Agriculture by answer farm...
Kisan Call Centre - To harness potential of ICT in Agriculture by answer farm...Kisan Call Centre - To harness potential of ICT in Agriculture by answer farm...
Kisan Call Centre - To harness potential of ICT in Agriculture by answer farm...
 
KSHARA STURA .pptx---KSHARA KARMA THERAPY (CAUSTIC THERAPY)————IMP.OF KSHARA ...
KSHARA STURA .pptx---KSHARA KARMA THERAPY (CAUSTIC THERAPY)————IMP.OF KSHARA ...KSHARA STURA .pptx---KSHARA KARMA THERAPY (CAUSTIC THERAPY)————IMP.OF KSHARA ...
KSHARA STURA .pptx---KSHARA KARMA THERAPY (CAUSTIC THERAPY)————IMP.OF KSHARA ...
 
Model Call Girl in Bikash Puri Delhi reach out to us at 🔝9953056974🔝
Model Call Girl in Bikash Puri  Delhi reach out to us at 🔝9953056974🔝Model Call Girl in Bikash Puri  Delhi reach out to us at 🔝9953056974🔝
Model Call Girl in Bikash Puri Delhi reach out to us at 🔝9953056974🔝
 
9953330565 Low Rate Call Girls In Rohini Delhi NCR
9953330565 Low Rate Call Girls In Rohini  Delhi NCR9953330565 Low Rate Call Girls In Rohini  Delhi NCR
9953330565 Low Rate Call Girls In Rohini Delhi NCR
 
Paris 2024 Olympic Geographies - an activity
Paris 2024 Olympic Geographies - an activityParis 2024 Olympic Geographies - an activity
Paris 2024 Olympic Geographies - an activity
 
Separation of Lanthanides/ Lanthanides and Actinides
Separation of Lanthanides/ Lanthanides and ActinidesSeparation of Lanthanides/ Lanthanides and Actinides
Separation of Lanthanides/ Lanthanides and Actinides
 
ECONOMIC CONTEXT - LONG FORM TV DRAMA - PPT
ECONOMIC CONTEXT - LONG FORM TV DRAMA - PPTECONOMIC CONTEXT - LONG FORM TV DRAMA - PPT
ECONOMIC CONTEXT - LONG FORM TV DRAMA - PPT
 
Hybridoma Technology ( Production , Purification , and Application )
Hybridoma Technology  ( Production , Purification , and Application  ) Hybridoma Technology  ( Production , Purification , and Application  )
Hybridoma Technology ( Production , Purification , and Application )
 
A Critique of the Proposed National Education Policy Reform
A Critique of the Proposed National Education Policy ReformA Critique of the Proposed National Education Policy Reform
A Critique of the Proposed National Education Policy Reform
 
Software Engineering Methodologies (overview)
Software Engineering Methodologies (overview)Software Engineering Methodologies (overview)
Software Engineering Methodologies (overview)
 
Science 7 - LAND and SEA BREEZE and its Characteristics
Science 7 - LAND and SEA BREEZE and its CharacteristicsScience 7 - LAND and SEA BREEZE and its Characteristics
Science 7 - LAND and SEA BREEZE and its Characteristics
 

VALIDATION OF ANALYTICAL PROCEDURES Q2(R2)

  • 1. INTERNATIONAL COUNCIL FOR HARMONISATION OF TECHNICAL REQUIREMENTS FOR PHARMACEUTICALS FOR HUMAN USE ICH HARMONISED GUIDELINE Chandra Prakash Singh VALIDATION OF ANALYTICAL PROCEDURES Q2(R2)
  • 2. Validation Study Design and Evaluation  Objectives / performance characteristics  Analytical Procedure  Appropriate development data  Prior Knowledge  Analytical Procedure lifecycle management. ICH Q14 ICH Q2 Validation Strategy: Evaluation of prior Knowledge, including available development or validation data with justification. Additional experiment and evaluation according to ICH Q2 methodology or alternate with Justification. Document validation result and data: Evaluation against acceptance of analytical ranges. Conclusion and acceptance of analytical procedure performance. Validation Protocol Validation Report Validation Test and/or evaluation of data
  • 3. Is the procedure utilized to demonstrate identity of product? Dose the procedure confirm impurities are below a given limit? Selection of Validation Tests Does the procedure quantitate levels of an impurity? Is the procedure utilized to quantitate content of potency? Analytical Procedure Objective Determination Performance Characteristics Validation Tests** *May not be needed for limit tests. ** Teat may be chosen from present options. May not require all tests. Specificity Range Accuracy Precision Absence of Interference Orthogonal Procedure Comparison Or, Technology Inherent Justification Validation of Calibration Model* Validation of Range Limit Reference Material Comparison Spiking Study Orthogonal Procedure Comparison Repeatability Intermediate Precision Reproducibility (if>1 laboratory)
  • 4. Table 01: Typical performance characteristics and related validation tests for measured quality attributes. Analytical Procedure Performance Characteristics to be Demonstrated* Measured Quality Attribute Identity Impurity (Purity) Other quantitative measurements# Assay Content or potency Other quantitative measurements (1) Quantitative Test Limit Test Specificity$ Specificity Test + + + + Range Response (Calibration Model) - + - + Lower Range Limit - QL† DL - Accuracy$$ Accuracy Test - + - + Precision$$ Repeatability Test - + - + Intermediate Precision Test - +$$$ - +$$$ - signifies that this test is not normally conducted. + signifies that this test is normally conducted. † in some complex cases DL may also be evaluated QL, DL: quantitation limit, detection limit. * Some performance characteristics can be substituted with technology-inherent justification in the case of certain analytical procedures for physicochemical properties. # Other quantitative measurements can follow the scheme for impurity, if the range limit is close to the DL/QL; other quantitative measurements can follow the scheme for assay (content or potency), if the range limit is not close to the DL/QL. $ Lack of specificity of one analytical procedure should be compensated by one or more other supporting analytical procedures, unless appropriately justified. $$ alternatively, a combined approach can be used to evaluate accuracy and precision. $$$ where reproducibility has been performed and intermediate precision can be derived from the reproducibility data set, an independent study for intermediate precision is not required.
  • 5. Table 2: Examples of Reportable Ranges for Common Uses of Analytical Procedures Use of analytical procedure Low end of reportable range High end of reportable range Assay of a product# 80% of declared content or 80% of lower specification acceptance criterion 120% of declared content or 120% of the upper specification acceptance criterion Potency Lowest specification acceptance criterion -20% Highest specification acceptance criterion +20% Content uniformity 70% of declared content 130% of declared content Dissolution: Immediate release • One point specification Q - 45% of the lowest strength 130% of declared content of the highest strength • Multiple point specification Lower limit of reportable range (as justified by the specification) or QL, as appropriate. 130% of declared content of the highest strength Modified release Lower limit of reportable range (as justified by the specification) or QL, as appropriate. 130% of declared content of the highest strength Impurity# Reporting threshold 120% of specification acceptance criterion Purity (as area %) 80% of lower specification acceptance criterion Upper specification acceptance criterion or 100% #Where assay and impurity are performed as a single test and only one standard is used, linearity should be demonstrated for both the reporting level of the impurities and up to 120% of the specification acceptance criterion for assay.
  • 6. Performance characteristic Validation study methodology Specificity/ Selectivity Absence of relevant interference: With product, buffer, or appropriate matrix, and between individual peaks of interest Spiking with known impurities/ excipients. or By comparison of impurity profiles by an orthogonal analytical procedure. Demonstration of stability indicating properties through appropriate forced degradation samples, if necessary. Absence of relevant interference: With product, buffer, or appropriate matrix, and between individual peaks of interest Demonstration of stability-indicating properties through appropriate forced degradation samples if necessary Precision Repeatability: Replicate measurements with 3 times 3 levels across the reportable range or 6 times at 100% level, considering peak(s) of interest. Intermediate precision: e.g., different days, environmental conditions, analysts, equipment Technique Separation techniques (e.g., HPLC, GC, CE) for impurities or assay Separation techniques with relative area quantitation (e.g., product related substances such as charge variants) Table 03: Examples for quantitative separation techniques
  • 7. Performance characteristic Validation study methodology Accuracy For Assay: Comparison with suitably characterized material (e.g., reference material). or Comparison with an orthogonal procedure for impurities. or Related substances: Spiking studies with impurities or comparison of impurity profiles with an orthogonal procedure Comparison with an orthogonal procedure and/or suitably characterized material (e.g., reference material) or Accuracy can be inferred once precision, linearity and specificity have been established. or Spiking studies with forced degradation samples and/or suitably characterized material. Reportable Range Validation of calibration model across the range: Linearity: Dilution of the analytes of interest over the expected procedure range, at least 5 points. Validation of lower range limits (for purity only): QL, DL through a selected methodology (e.g., signal-to-noise determination) Validation of calibration model across the range: Linearity: Between measured (observed) relative result versus theoretically expected relative result across specification range(s), e.g., by spiking or degrading material. Validation of lower range limits: QL (and DL) through a selected methodology (e.g., signal-to-noise determination) Technique Separation techniques (e.g., HPLC, GC, CE) for impurities or assay Separation techniques with relative area quantitation (e.g., product related substances such as charge variants)
  • 8. Performance characteristic Validation study methodology Robustness and other considerations (performed as part of analytical procedure development as per ICH Q14) Deliberate variation of relevant parameters, e.g., Sample preparation: • Extraction volume, • Extraction time, • Temperature, • Dilution Separation parameters: • Column/capillary lot, • Mobile phase/buffer composition and pH, • Column/capillary temperature, • Flow rate, • Detection wavelength • Stability of sample and reference material preparations Relative Response Factors: If the analyte has a different response from the reference material (e.g., a different specific UV absorbance), relative response factors should be calculated using the appropriate ratio of responses. This evaluation may be performed during validation or development, and should use the finalized analytical procedure conditions and be appropriately documented. If the relative response factor is outside the range 0.8-1.2, then a correction factor should be applied. If an impurity/degradation product is overestimated, it may be acceptable not to use a correction factor. Technique Separation techniques (e.g., HPLC, GC, CE) for impurities or assay Separation techniques with relative area quantitation (e.g., product related substances such as charge variants)
  • 9. Performance characteristic Validation study methodology Specificity/ Selectivity Spiking of elements into matrix and demonstration of sufficient noninterference and confirmation of accuracy with the presence of components (e.g., carrier gas, impurities, matrix). or Justification through technology/prior knowledge (e.g., specificity of technology for certain isotopes). Precision Repeatability: Replicate measurements with 3 times 3 levels across the reportable range or 6 times at 100% level, considering signals of Interest. Intermediate precision: e.g., different days, environmental conditions, analysts, equipment Accuracy Spiking studies with impurities or Comparison of impurity profiles with an orthogonal procedure Reportable Range Validation of working range: Linearity: Dilution of the analytes of interest over the expected working range, at least 5 points, can be combined with multi- level accuracy experiment Validation of lower range: QL, DL through a selected methodology Robustness and other considerations Deliberate variation of parameters and stability of test conditions, e.g., Sample digestion technique and preparation, nebulizer and sheath flow settings, plasma settings. (performed as part of analytical procedure development as per ICH Q14) Technique Elemental Impurities by ICP-OES or ICP-MS Table 04: Example for elemental impurities by ICP-OES or ICP-MS
  • 10. Performance characteristic Demonstration of performance of dissolution step Typically demonstrated with development data Validation testing methodology Typically demonstrated with final procedure Specificity/ Selectivity Discriminatory power: Demonstration of the discriminatory power to differentiate between batches manufactured with different critical process parameters and/or critical material attributes which may have an impact on the bioavailability (performed as part of development of dissolution step). Absence of interference: Demonstration of non-interference with excipients and dissolution media likely to impact the quantitation of the main analyte. Precision Repeatability and intermediate precision: Understanding of variability by performing, e.g., vessel-to- vessel repeatability studies or intermediate precision studies (operators, equipment). Note: The study provides a combined assessment of variability of product quality and product dissolution performance in addition to the variability of the quantitative procedure. Repeatability and intermediate precision: Demonstration with a homogeneous sample from one dissolved tablet, e.g., several samples drawn from the same vessel, after analyte in sample has been fully dissolved. Accuracy (Not applicable for dissolution step) Spiking study: Add known amounts of the reference material to the dissolution vessel containing excipient mixture in dissolution media and calculate recovery within defined working range. Technique Dissolution with HPLC as product performance test for an immediate release dosage form Table 05: Example for dissolution with HPLC as product performance test for an immediate release dosage form
  • 11. Performance characteristic Demonstration of performance of dissolution step Typically demonstrated with development data Validation testing methodology Typically demonstrated with final procedure Reportable Range (Not applicable for dissolution step) Validation of calibration model across the range Linearity: Demonstrate linearity from sample concentrations (as presented to quantitative measurement) in the range of Q - 45% of the lowest strength up to 130% of the highest strength, for one point specification, and in the range of QL up to 130% of the highest strength, for multiple point specification. If lower concentration ranges are expected to be close to QL: Validation of lower range limits, see separation techniques Robustness and other considerations (performed as part of analytical procedure development as per ICH Q14) Justification of the selection of the dissolution procedure parameters, e.g., • Medium buffer composition, • Surfactant concentration, • Use of sinkers, • pH, • Deaeration, • Volume, • Agitation rate, • Sampling time Deliberate variation of parameters of the quantitative procedure, see separation technique.
  • 12. Performance characteristic Validation study methodology Specificity/ Selectivity Absence of interference: Select a signal which is representative for the analyte and does not show interference with potential baseline artefacts, residual water or solvent signals, related structure impurities or other impurities, internal standards, non-target major component or potential isomers/forms. Precision Repeatability: Replicate measurements of at least 6 independent preparations at 100% level. Intermediate Precision: Not necessary to be conducted on target analyte (justified by technology principle, as typically verified through instrument calibration with a standard sample) Accuracy Reference material comparison: Confirm with sample of known purity Reportable Range Validation tests are typically not necessary because the integral areas are usually directly proportional to the amount (mole) of reference material and analyte (technology inherent justification) Robustness and other considerations Deliberate variation of parameters, e.g., Temperature, concentration, field (shim), tuning and matching of the NMR probe, solution stability. (performed as part of analytical procedure development as per ICH Q14) Technique Example for quantitative 1H-NMR for the assay of a drug substance Table 06: Example for quantitative 1H-NMR for the assay of a drug substance
  • 13. Performance characteristic Validation study methodology Specificity/ Selectivity Absence of interference: Dose-response curve fulfils the response criteria demonstrating the similarity of the analyte and reference material, as well as non- interfering signal from the matrix (for binding assay), or no dose-response from the cell line alone (for cell-based assay) Demonstration of stability-indicating properties through appropriate forced degradation samples if necessary. Precision Repeatability: Repeated sample analysis on a single day or within a short interval of time covering the reportable range of the analytical procedure (at least 3 replicates over at least 5 levels). Intermediate Precision: Different analysts, multiple independent preparations over multiple days at multiple potency levels through the analytical procedure's reportable range, inclusive of normal laboratory variation. Accuracy Reference material comparison: Assess recovery versus theoretical activity for multiple (at least 3) independent preparations at multiple (at least 5) levels through the analytical procedure's reportable range. Reportable Range Validation of range, including lower and higher range limits: The lowest to highest relative potency levels that meet accuracy, precision, and response criteria, determined over at least 5 potency levels. Robustness and other considerations Deliberate variation of parameters, e.g., Plate type, buffer components, incubation times, incubation conditions, instruments, reaction times, reagent lots including controls For binding assay procedures: coating proteins, capture/detection antibody. For cell-based assay procedures: cell density, effector/target cell ratio, cell generation number. (performed as part of analytical procedure development as per ICH Q14). Technique Binding assay (e.g., ELISA, SPR) or cell-based assay for determination of potency relative to a reference Table 07: Example for biological assays
  • 14. Performance characteristic Validation study methodology Specificity/ Selectivity Orthogonal Procedure Comparison: Test reaction specificity by gel electrophoresis, melting profile or DNA sequencing Absence of interference: Positive template, no-reverse transcription control for RT-qPCR and no template control. Test primer and probe target specificity against gene bank with sequence similarity search program (e.g., nucleotide BLAST). Evaluate the slope of standard curve for efficiency. Precision Repeatability: Independent preparations of 5 positive control levels evenly distributed along the standard curve and assayed in triplicate within a single assay assessment. The results can be compared using coefficient of variation (CV). Intermediate precision: At least three replicates per run at each positive control level in at least 6 runs over two or more days. Accuracy Spiking Study: Test (e.g., n=6) replicates at 3 to 5 template spike levels from the standard curve concentrations Efficiency/consistency of RNA/DNA extraction method should be accounted for. Technique Quantitative PCR (quantitative analysis of impurities in drug substances or products) Table 08: Example for quantitative PCR
  • 15. Performance characteristic Validation study methodology Reportable Range Linearity: Working range should cover at least 5 to 6 log to the base 10 concentration values. Correlation coefficients or standard deviations should be calculated through the entire dynamic range. Validation of lower working range limits based on the calibration curve: DL defined by template spiking in samples or from standard curves. DL is lowest point meeting the response curve parameters. QL demonstrated through showing sufficient recovery and acceptable CVs from the accuracy experiment. Robustness and other considerations (performed as part of analytical procedure development as per ICH Q14) Deliberate variation of parameters, e.g., • Equipment, • Master mix composition (concentrations of salts, dNTPs, adjuvants), • Master mix lots, • Reaction volume, • Probe and primer concentrations, • Thermal cycling parameters.
  • 16. Performance characteristic Validation study methodology Specificity/ Selectivity Absence of interference: Evaluate blank and sample to determine the appropriateness of the equipment settings and sample preparation. Precision Repeatability: Test at least 6 replicates using established analytical procedure parameters at target range Intermediate precision: Analysis performed on different days, environmental conditions, analysts, equipment setup Accuracy Technology inherent justification: Confirmed by an appropriate instrument qualification Or Orthogonal procedure comparison: Qualitative comparison using a different technique, like optical microscopy, to confirm results. Reportable Range Technology specific justification, e.g., particle size range covered Robustness and other considerations (performed as part of analytical procedure development as per ICH Q14) Deliberate variation of parameters, e.g., Evaluation of expected size ranges for the intended use of the analytical procedure. Dispersion stability for liquid dispersions (stability over potential analysis time, stir rate, dispersion energy equilibration or stir time before measurement) Dispersion stability for dry dispersions (sample amount, measurement time, air pressure and feed rate) Obscuration range (establish optimum percentage of laser obscuration) Ultrasound time/percentage for sample, if applicable Technique Particle size measurement (dynamic light scattering; laser diffraction measurement) as a property test Table 09: Example for particle size measurement
  • 17. Performance characteristic Validation study methodology Specificity/ Selectivity Absence of interference: Comparison of drug substance spectrum and the loading plots of the model Rejection of outliers (e.g., excipient, analogues) not covered by the multivariate procedure Precision Repeatability: Repeated analysis with removal of sample from the holder between measurements Accuracy Comparison with an orthogonal procedure: Demonstration across the range through comparison of the predicted and reference values using an appropriate number of determinations and concentration levels (e.g., 5 concentrations, 3 replicates) Accuracy is typically reported as the standard error of prediction (SEP or RMSEP) Reportable Range Response: Demonstration of the relationship between predicted and reference values Error (accuracy) across the range: Information on how the analytical procedure error (accuracy) changes across the calibration range, e.g., by plotting the residuals of the model prediction versus the actual data Robustness and other considerations (performed as part of analytical procedure development as per ICH Q14) Deliberate variation of parameters, e.g., Chemical and physical factors that can impact NIR spectrum and model prediction should be represented in data sets. Examples include various sources of drug substance and excipients, water content, tablet hardness, and orientation in the holder Note: NIR measurements are sensitive to changes in tablet composition and properties outside variation present in the calibration set Technique NIR analytical procedure for core tablet assay Table 10: Example for NIR analytical procedure
  • 18. Performance characteristic Validation study methodology Specificity/ Selectivity Technology inherent justification: Inferred through use of specific and selective MS detection (e.g., MRM transition with specified quantitative to qualitative ion ratio, accurate m/z value) in combination with retention time, consider potential for isotopes or Absence of interference from other components in sample matrix or Comparison of impurity profiles determined by an orthogonal analytical procedure. Precision Repeatability Measurement of a minimum of 3 replicates at each of at least 3 spiking levels or a minimum of 6 replicates at 100% Intermediate precision Comparison of measurements of the same samples performed in the same laboratory but under varying conditions (e.g., different LC/MS systems, different analysts, different days) Accuracy Spiking study: Acceptable recovery of spiked impurity standards in sample matrix at multiple spiking levels Or Comparison of the results to the ‘true’ values obtained from an orthogonal procedure Technique Quantitative LC/MS analysis of trace impurities in product Table 11: Example for quantitative LC/MS
  • 19. Performance characteristic Validation study methodology Reportable Range Validation of calibration model across the range: Linearity: Experimental demonstration of the linear relationship between analyte concentrations and peak responses (or the ratio of peak response if an internal standard was used) with reference materials at 5 or more concentration levels Validation of lower range limits: DL: Use the coefficient of variation (CV) of responses at the spiking level (with 6 or more repeated injections) as a measure of signal-to-noise. The CV obtained must be less than or equal to a pre-defined acceptable value. QL: The lowest spiking level with acceptable accuracy and precision. The range extends from and is inclusive of the QL to the highest spiking level with acceptable accuracy, precision and response. Robustness and other considerations (performed as part of analytical procedure development as per ICH Q14) Deliberate variation of parameters, e.g., • LC flow rate, • LC injection volume, • MS drying/ desolvation temperature, • MS gas flow, • Mass accuracy, • MS collision energy, • Stability of test conditions.