1. 17th
Nov’14 Currency Highlights
USDINR
USDINR Technical View:
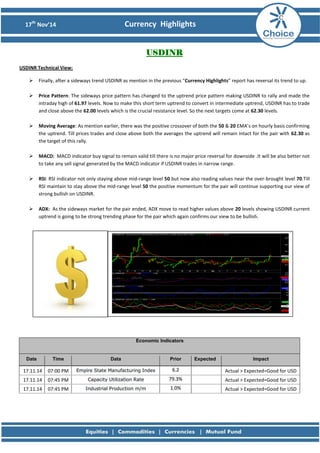
Finally, after a sideways trend USDINR as mention in the previous “Currency Highlights” report has reversal its trend to up.
Price Pattern: The sideways price pattern has changed to the uptrend price pattern making USDINR to rally and made the
intraday high of 61.97 levels. Now to make this short term uptrend to convert in intermediate uptrend, USDINR has to trade
and close above the 62.00 levels which is the crucial resistance level. So the next targets come at 62.30 levels.
Moving Average: As mention earlier, there was the positive crossover of both the 50 & 20 EMA’s on hourly basis confirming
the uptrend. Till prices trades and close above both the averages the uptrend will remain intact for the pair with 62.30 as
the target of this rally.
MACD: MACD indicator buy signal to remain valid till there is no major price reversal for downside .It will be also better not
to take any sell signal generated by the MACD indicator if USDINR trades in narrow range.
RSI: RSI indicator not only staying above mid-range level 50 but now also reading values near the over-brought level 70.Till
RSI maintain to stay above the mid-range level 50 the positive momentum for the pair will continue supporting our view of
strong bullish on USDINR.
ADX: As the sideways market for the pair ended, ADX move to read higher values above 20 levels showing USDINR current
uptrend is going to be strong trending phase for the pair which again confirms our view to be bullish.
Economic Indicators
Date Time Data Prior Expected Impact
17.11.14 07:00 PM Empire State Manufacturing Index 6.2 Actual > Expected=Good for USD
17.11.14 07:45 PM Capacity Utilization Rate 79.3% Actual > Expected=Good for USD
17.11.14 07:45 PM Industrial Production m/m 1.0% Actual > Expected=Good for USD
2. 17th
Nov’14 Currency Highlights
EURINR
EURINR Technical View:
The pair after a major downtrend has finally changed its trend to short term uptrend.
Price Pattern: The price pattern of EURINR is showing how the pair is on the verge to reverse for intermediate uptrend. If
the prices in today’s trading session starts to trade and close above the friday’s high of 77.24 levels then the intermediate
uptrend will be confirm for the pair for the target of 78.00 levels.
Moving Average: In the friday’s trading session prices have just maintain to close above both the 50 & 20 EMA’s on hourly
basis. There is a strong probability of the positive crossover of both the average to give intermediate buy signal for the pair
which will strongly confirm our view to be bullish on EURINR pair.
MACD: The indicator buy signal will also remain valid as the prices are in the short term uptrend and MACD will continue to
read higher values confirming the uptrend.
RSI: Momentum indicator RSI has finally maintained to read and stay above mid-range level 50 confirming the strength in
the pair. The RSI momentum strength will be tested in today’s trading session, if EURINR observes a sideways trend or
decline due to weak USDINR.
ADX: As the pair is changing its sideways markets trend to uptrend, ADX has started reading higher values from its previous
lower levels. If ADX continues to read the values above 20 levels then it will confirm the trending phase has started for the
pair ending its current consolidation phase.
3. 17th
Nov’14 Currency Highlights
Economic Indicators
Date Time Data Prior Expected Impact
17.11.14 02:30 PM Italian Trade Balance 2.06B Actual > Expected=Good for EUR
17.11.14 03:30 PM Trade Balance 15.8B Actual > Expected=Good for EUR
17.11.14 04:30 PM German Buba Monthly Report More Hawkish=Good for EUR
17.11.14 07:30 PM ECB President Draghi Speaks More Hawkish=Good for EUR
4. 17th
Nov’14 Currency Highlights
GBPINR
GBPINR Technical View:
Despite of uptrend in USDINR & EURINR pair, GBPINR continues its downtrend.
Price Pattern: The price pattern of pair is still bearish however in the friday’s trading session the prices got some support
from the rally in USDINR & EURINR pair. If USDINR reverse for intermediate uptrend then only the price pattern for GBPINR
will reverse for a short term uptrend.
Moving Average: Price is facing strong resistance at 20 EMA on hourly basis. Now only if prices in today’s trading session
starts to trade and close above this average then, only the pair will reverse for a uptrend else its current downtrend will
remain intact.
MACD: If you look at the below hourly chart of GBPINR, MACD indicator is on the verge to give a buy signal. So one can
trade only on this for intraday basis, once prices starts to trade above the yesterday high of 97.19 levels.
RSI: The RSI however is reading and staying below the mid-range level 50 still suggesting the momentum is weak for the
pair. If RSI starts to read and stay above this mid-range level then, it will confirm the pair is ready for the upward reversal.
ADX: ADX indicator is suggesting the trending phase to remain intact for the pair as its reading values well above the 25
levels. ADX will starts to read lower values from its current level of 35, if GBPINR trades in a sideways range in today’s
trading session.
Economic Indicators
Date Time Data Prior Expected Impact
17.11.14 05:31 AM Rightmove HPI m/m 2.6% Actual > Expected=Good for GBP
5. 17th
Nov’14 Currency Highlights
JPYINR
JPYINR Technical View:
As the downtrend remains intact for the pair, JPYINR continues to trade in a very narrow range.
Price Pattern: Since the price pattern for the pair is bearish, JPYINR is trading in a very narrow range at the bottom levels of
its major downtrend. Till there is no price pattern reversal developed, JPYIRN will continue to remain range bound in a
downtrend.
Moving Average: Price continues to remain below both the averages suggesting the major downtrend is still intact for the
pair. Till prices do not starts to trade and close above both the 50 & 20 EMA’s on hourly basis, downtrend will exits for the
pair
MACD: The indicator is on the verge to give a buy signal. This signal can be taken on intraday basis if prices start trading
above 20 EMA in today’s trading session.
RSI: RSI continues to read values at near the mid-range level 50. So if JPYINR is ready for reversal, then RSI will gain
strength and starts reading and staying above the mid-range level 50.
ADX: ADX indicator continues to read and stay above 25 levels suggesting trending phase is still valid for the pair, despite
prices trades in a narrow range .This also indicate the pair will observe a large movement in prices on intraday basis if ADX
continues stays above the 25 levels.
Economic Indicators
Date Time Data Prior Expected Impact
17.11.14 05:20 AM Prelim GDP q/q -1.8% Actual > Expected=Good for JPY
17.11.14 05:20 AM Prelim GDP Price Index y/y 2.0% Actual > Expected=Good for JPY
7. 17th
Nov’14 Currency Highlights
Disclaimer
This is solely for information of clients of Choice Broking and does not construe to be an investment advice. It is
also not intended as an offer or solicitation for the purchase and sale of any financial instruments. Any action
taken by you on the basis of the information contained herein is your responsibility alone and Choice Broking its
subsidiaries or its employees or associates will not be liable in any manner for the consequences of such action
taken by you. We have exercised due diligence in checking the correctness and authenticity of the information
contained in this recommendation, but Choice Broking or any of its subsidiaries or associates or employees shall
not be in any way responsible for any loss or damage that may arise to any person from any inadvertent error in
the information contained in this recommendation or any action taken on basis of this information. Technical
analysis studies market psychology, price patterns and volume levels. It is used to forecast future price and market
movements. Technical analysis is complementary to fundamental analysis and news sources. The
recommendations issued here with might be contrary to recommendations issued by Choice Broking in the
company research undertaken as the recommendations stated in this report is derived purely from technical
analysis. Choice Broking has based this document on information obtained from sources it believes to be reliable
but which it has not independently verified; Choice Broking makes no guarantee, representation or warranty and
accepts no responsibility or liability as to its accuracy or completeness. The opinions contained within the report
are based upon publicly available information at the time of publication and are subject to change without notice.
The information and any disclosures provided herein are in summary form and have been prepared for
informational purposes. The recommendations and suggested price levels are intended purely for trading
purposes. The recommendations are valid for the day of the report however trading trends and volumes might
vary substantially on an intraday basis and the recommendations may be subject to change. The information and
any disclosures provided herein may be considered confidential. Any use, distribution, modification, copying,
forwarding or disclosure by any person is strictly prohibited. The information and any disclosures provided herein
do not constitute a solicitation or offer to purchase or sell any security or other financial product or instrument.
The current performance may be unaudited. Past performance does not guarantee future returns. There can be
no assurance that investments will achieve any targeted rates of return, and there is no guarantee against the loss
of your entire investment.
POTENTIAL CONFLICT OF INTEREST DISCLOSURE (as on date of report) Disclosure of interest statement – • Analyst
interest of the stock /Instrument(s): - No. • Firm interest of the stock / Instrument (s): - No.