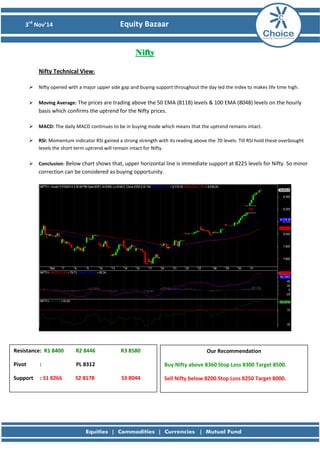
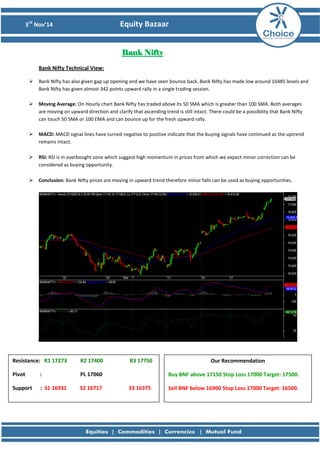
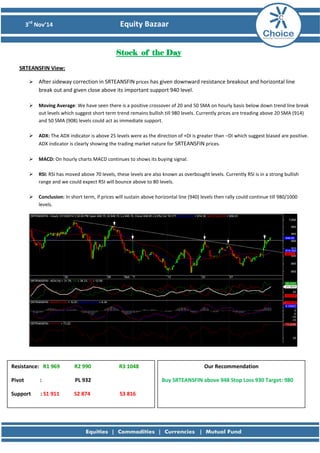
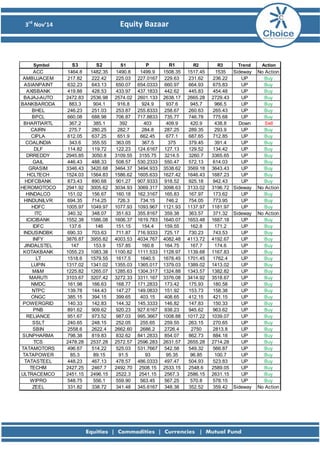
The document provides a technical analysis of the Nifty, Bank Nifty, and stock SRTEANSFIN from November 3rd, 2014. It notes that the indexes opened with gaps and gained throughout the day, with technical indicators like moving averages and MACD signaling continued uptrends. For Nifty, support is seen at 8225 and resistance at 8400. For Bank Nifty, support is at 16931 and resistance at 17273. SRTEANSFIN broke resistance and is recommended as a buy above 948 with a target of 980.
Epic research's daily derivative market report 21st october 2016
Equity bazaar 3.11.14
1. 3rd Nov’14 Equity Bazaar
Nifty
Nifty Technical View:
Nifty opened with a major upper side gap and buying support throughout the day led the index to makes life time high.
Moving Average: The prices are trading above the 50 EMA (8118) levels & 100 EMA (8048) levels on the hourly basis which confirms the uptrend for the Nifty prices.
MACD: The daily MACD continues to be in buying mode which means that the uptrend remains intact.
RSI: Momentum indicator RSI gained a strong strength with its reading above the 70 levels. Till RSI hold these overbought levels the short term uptrend will remain intact for Nifty.
Conclusion: Below chart shows that, upper horizontal line is immediate support at 8225 levels for Nifty. So minor correction can be considered as buying opportunity.
Resistance: R1 8400 R2 8446 R3 8580
Pivot : PL 8312
Support : S1 8266 S2 8178 S3 8044
Our Recommendation
Buy Nifty above 8360 Stop Loss 8300 Target 8500.
Sell Nifty below 8200 Stop Loss 8250 Target 8000.
2. 3rd Nov’14 Equity Bazaar
Bank Nifty
Bank Nifty Technical View:
Bank Nifty has also given gap up opening and we have seen bounce back. Bank Nifty has made low around 16485 levels and Bank Nifty has given almost 342 points upward rally in a single trading session.
Moving Average: On Hourly chart Bank Nifty has traded above its 50 SMA which is greater than 100 SMA. Both averages are moving on upward direction and clarify that ascending trend is still intact. There could be a possibility that Bank Nifty can touch 50 SMA or 100 EMA and can bounce up for the fresh upward rally.
MACD: MACD signal lines have turned negative to positive indicate that the buying signals have continued as the uptrend remains intact.
RSI: RSI is in overbought zone which suggest high momentum in prices from which we expect minor correction can be considered as buying opportunity.
Conclusion: Bank Nifty prices are moving in upward trend therefore minor falls can be used as buying opportunities.
Resistance: R1 17273 R2 17400 R3 17750
Pivot : PL 17060
Support : S1 16931 S2 16717 S3 16375
Our Recommendation
Buy BNF above 17150 Stop Loss 17000 Target: 17500.
Sell BNF below 16900 Stop Loss 17000 Target: 16500.
3. 3rd Nov’14 Equity Bazaar
Stock of the Day
SRTEANSFIN View:
After sideway correction in SRTEANSFIN prices has given downward resistance breakout and horizontal line break out and given close above its important support 940 level.
Moving Average: We have seen there is a positive crossover of 20 and 50 SMA on hourly basis below down trend line break out levels which suggest short term trend remains bullish till 980 levels. Currently prices are treading above 20 SMA (914) and 50 SMA (908) levels could act as immediate support.
ADX: The ADX indicator is above 25 levels were as the direction of +DI is greater than –DI which suggest biased are positive. ADX indicator is clearly showing the trading market nature for SRTEANSFIN prices.
MACD: On hourly charts MACD continues to shows its buying signal.
RSI: RSI has moved above 70 levels, these levels are also known as overbought levels. Currently RSI is in a strong bullish range and we could expect RSI will bounce above to 80 levels.
Conclusion: In short term, if prices will sustain above horizontal line (940) levels then rally could continue till 980/1000 levels.
Resistance: R1 969 R2 990 R3 1048
Pivot : PL 932
Support : S1 911 S2 874 S3 816
Our Recommendation
Buy SRTEANSFIN above 948 Stop Loss 930 Target: 980
4. 3rd Nov’14 Equity Bazaar
Derivative Analysis FIIS Data: FII’s are net Rs 1754.73 Cr Buyers on 31th October 2014 and Dll’s are the net Rs 276.49 Cr Sellers on 31th October 2014. Option Data: 8500 CE has the highest OI with 34 lakhs and 8400 CE has the second highest OI with 33 lakhs and 8000 PE has the highest OI with 54 lakhs and 8200 PE has the second highest OI with 32 lakhs. Open Interest: The above options data shows that nifty has strong support at 8000 and has resistance at 8500. The change in level will take place once when NIFTY prices breaks 8200 mark. Intraday Option Strategy: (A) Buy Nifty 8300 calls and Sell Nifty 8400 puts if buy level is breached. (B) Sell Nifty 8200 calls and Buy Nifty 8300 puts if sell level is breached.
7. 3rd Nov’14 Equity Bazaar
Disclaimer
This is solely for information of clients of Choice Broking and does not construe to be an investment advice. It is also not intended as an offer or solicitation for the purchase and sale of any financial instruments. Any action taken by you on the basis of the information contained herein is your responsibility alone and Choice Broking its subsidiaries or its employees or associates will not be liable in any manner for the consequences of such action taken by you. We have exercised due diligence in checking the correctness and authenticity of the information contained in this recommendation, but Choice Broking or any of its subsidiaries or associates or employees shall not be in any way responsible for any loss or damage that may arise to any person from any inadvertent error in the information contained in this recommendation or any action taken on basis of this information. Technical analysis studies market psychology, price patterns and volume levels. It is used to forecast future price and market movements. Technical analysis is complementary to fundamental analysis and news sources. The recommendations issued herewith might be contrary to recommendations issued by Choice Broking in the company research undertaken as the recommendations stated in this report is derived purely from technical analysis. Choice Broking has based this document on information obtained from sources it believes to be reliable but which it has not independently verified; Choice Broking makes no guarantee, representation or warranty and accepts no responsibility or liability as to its accuracy or completeness. The opinions contained within the report are based upon publicly available information at the time of publication and are subject to change without notice. The information and any disclosures provided herein are in summary form and have been prepared for informational purposes. The recommendations and suggested price levels are intended purely for trading purposes. The recommendations are valid for the day of the report however trading trends and volumes might vary substantially on an intraday basis and the recommendations may be subject to change. The information and any disclosures provided herein may be considered confidential. Any use, distribution, modification, copying, forwarding or disclosure by any person is strictly prohibited. The information and any disclosures provided herein do not constitute a solicitation or offer to purchase or sell any security or other financial product or instrument. The current performance may be unaudited. Past performance does not guarantee future returns. There can be no assurance that investments will achieve any targeted rates of return, and there is no guarantee against the loss of your entire investment. POTENTIAL CONFLICT OF INTEREST DISCLOSURE (as on date of report) Disclosure of interest statement – • Analyst interest of the stock /Instrument(s): - No. • Firm interest of the stock / Instrument (s): - No.