1. 30th Sept’14 Equity Bazaar
Nifty
Nifty Technical View:
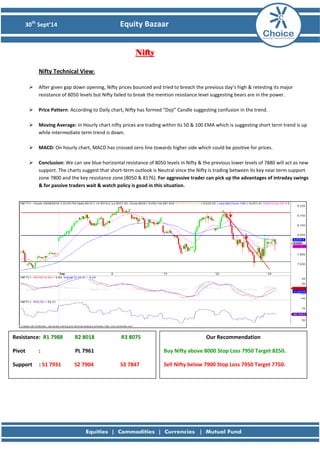
After given gap down opening, Nifty prices bounced and tried to breach the previous day’s high & retesting its major resistance of 8050 levels but Nifty failed to break the mention resistance level suggesting bears are in the power.
Price Pattern: According to Daily chart, Nifty has formed “Doji” Candle suggesting confusion in the trend.
Moving Average: In Hourly chart nifty prices are trading within its 50 & 100 EMA which is suggesting short term trend is up while intermediate term trend is down.
MACD: On hourly chart, MACD has crossed zero line towards higher side which could be positive for prices.
Conclusion: We can see blue horizontal resistance of 8050 levels in Nifty & the previous lower levels of 7880 will act as new support. The charts suggest that short-term outlook is Neutral since the Nifty is trading between its key near term support zone 7800 and the key resistance zone (8050 & 8176). For aggressive trader can pick up the advantages of intraday swings & for passive traders wait & watch policy is good in this situation.
Resistance: R1 7988 R2 8018 R3 8075
Pivot : PL 7961
Support : S1 7931 S2 7904 S3 7847
Our Recommendation
Buy Nifty above 8000 Stop Loss 7950 Target 8250.
Sell Nifty below 7900 Stop Loss 7950 Target 7750.
2. 30th Sept’14 Equity Bazaar
Bank Nifty
Bank Nifty Technical View:
Yesterday, Bank Nifty opened with a minor downside and selling pressure throughout the day led the index to close with a loss of 141 points.
Price Pattern: According to Daily chart, Bank Nifty has made “Harami Candle” which means sellers were ready to dominate the market.
Moving Average: In hourly chart, The Bank Nifty is trading below the 50 EMA & 100 EMA. The 50 EMA has been acting as resistance with the sporadic sanctuary to the 100 EMA.
MACD: The hourly chart, The MACD is gesturing sophisticated than preceding squat.
Stochastic: Oscillator Stochastic has crossover at upside to selling impetus and started moving downside.
Conclusion: Bank Nifty could trade in large range. The strong resistance is at 16288 levels as shown by red horizontal line & lower support of 15200 levels as shown by the green horizontal line. The charts suggest that contemporary movement is not yet indistinct so for belligerent trader elite awake the leads of intraday smacks & for flaccid traders wait & watch policy is good in this situation.
Resistance: R1 15599 R2 15725 R3 15941
Pivot : PL 15509
Support : S1 15383 S2 15293 S3 15077
Our Recommendation
Buy BNF above 15600 Stop Loss 15500 Target: 15900.
Sell BNF below 15400 Stop Loss 15500 Target: 15000.
3. 30th Sept’14 Equity Bazaar
Stock of the Day
Divi’s Lab View:
After sideway correction in Divi’s Lab has given strong resistance breakout and close above its important support 1754 level.
Price Pattern: According to hourly chart Stock has also given breakout from Ascending Triangle. According to Daily chart Divi’s Lab has made “Long Green Candle” which indicates buy signal with limited potential downside.
Moving Average: In Hourly chart, Divi’s Lab 50 EMA trade & 100 EMA both moving averages are tread in upward direction which is strong bullish sign.
RSI: RSI is on bullish mode (69.31 levels) that suggests upside is still left.
Conclusion: The charts suggest that this rise is going to continue till Rs.2000 levels. Divi’s Lab trades in sanguine direction consequently tumble can be used as buying opportunities to test sophisticated levels for the day. For short term target will be Rs.2000.
Resistance : R1 1819 R2 1849 R3 1929
Pivot : PL1770
Support : S1 1739 S2 1689 S3 1609
Our Recommendation
Buy Divi’s Lab at 1800 Stop Loss 1750 Target: 2000
4. 30th Sept’14 Equity Bazaar
Derivative Analysis FIIS Data: FII’s are the net Buyer on 29th September 2014 is Rs 150.1 Cr and Dll’s are the net Buyer on 29th September 2014 is Rs 234.52 Cr. Option Data: 8200 CE has the highest OI with 51 lakhs and 8100 CE has the second highest OI with 43 lakhs and 7800 PE has the highest OI with 50 lakhs and 7900 PE has the second highest OI with 38 lakhs. Open Interest: The above options data shows nifty has now a strong support at 7900 and resistance at 8100 the trend change level as per option data is 8000. Intraday Option Strategy: (A) Buy Nifty 7900 calls and Sell Nifty 8200 puts if buy level is breached. (B) Sell Nifty 8200 calls and Buy Nifty 7800 puts if sell level is breached.
7. 30th Sept’14 Equity Bazaar
Disclaimer
This is solely for information of clients of Choice India and does not construe to be an investment advice. It is also not intended as an offer or solicitation for the purchase and sale of any financial instruments. Any action taken by you on the basis of the information contained herein is your responsibility alone and Choice India its subsidiaries or its employees or associates will not be liable in any manner for the consequences of such action taken by you. We have exercised due diligence in checking the correctness and authenticity of the information contained in this recommendation, but Choice India or any of its subsidiaries or associates or employees shall not be in any way responsible for any loss or damage that may arise to any person from any inadvertent error in the information contained in this recommendation or any action taken on basis of this information. Technical analysis studies market psychology, price patterns and volume levels. It is used to forecast future price and market movements. Technical analysis is complementary to fundamental analysis and news sources. The recommendations issued herewith might be contrary to recommendations issued by Choice India in the company research undertaken as the recommendations stated in this report is derived purely from technical analysis. Choice India has based this document on information obtained from sources it believes to be reliable but which it has not independently verified; Choice India makes no guarantee, representation or warranty and accepts no responsibility or liability as to its accuracy or completeness. The opinions contained within the report are based upon publicly available information at the time of publication and are subject to change without notice. The information and any disclosures provided herein are in summary form and have been prepared for informational purposes. The recommendations and suggested price levels are intended purely for trading purposes. The recommendations are valid for the day of the report however trading trends and volumes might vary substantially on an intraday basis and the recommendations may be subject to change. The information and any disclosures provided herein may be considered confidential. Any use, distribution, modification, copying, forwarding or disclosure by any person is strictly prohibited. The information and any disclosures provided herein do not constitute a solicitation or offer to purchase or sell any security or other financial product or instrument. The current performance may be unaudited. Past performance does not guarantee future returns. There can be no assurance that investments will achieve any targeted rates of return, and there is no guarantee against the loss of your entire investment.
POTENTIAL CONFLICT OF INTEREST DISCLOSURE (as on date of report) Disclosure of interest statement – • Analyst interest of the stock /Instrument(s): - No. • Firm interest of the stock / Instrument (s): - No.