Download to read offline
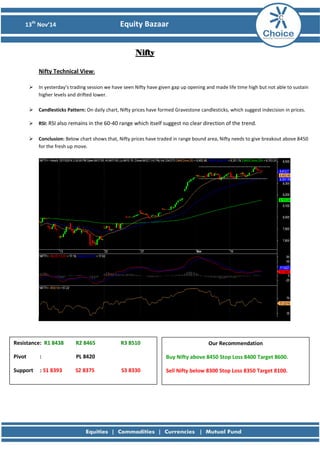
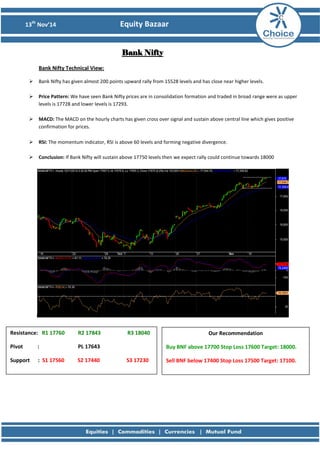
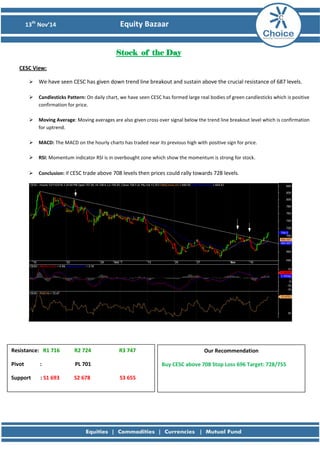
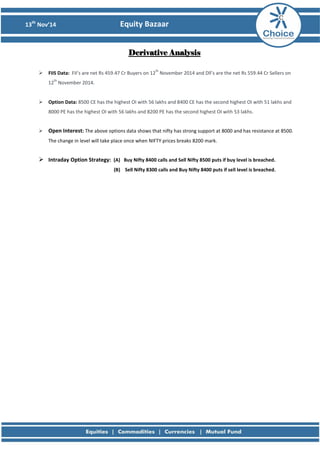
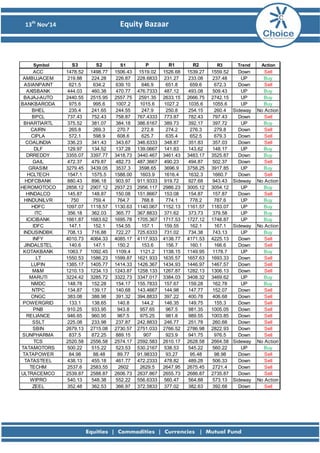

The document provides a technical analysis of the Nifty, Bank Nifty, and CESC stock indexes and recommendations for trading. It finds that Nifty needs a break above 8450 for an up move while support is at 8393. Bank Nifty may continue rallying if it sustains above 17750 toward 18000. CESC is predicted to rally to 728 if it remains above 708 due to breaking a downtrend line and positive momentum indicators.


