Equity Research Report 28 December 2015 Ways2Capital
Equity bazaar
1. 17th Sept 2014 Equity Bazaar
Nifty
Nifty Technical View:
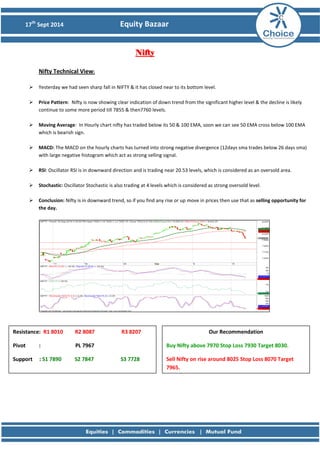
Yesterday we had seen sharp fall in NIFTY & it has closed near to its bottom level.
Price Pattern: Nifty is now showing clear indication of down trend from the significant higher level & the decline is likely continue to some more period till 7855 & then7760 levels.
Moving Average: In Hourly chart nifty has traded below its 50 & 100 EMA, soon we can see 50 EMA cross below 100 EMA which is bearish sign.
MACD: The MACD on the hourly charts has turned into strong negative divergence (12days sma trades below 26 days sma) with large negative histogram which act as strong selling signal.
RSI: Oscillator RSI is in downward direction and is trading near 20.53 levels, which is considered as an oversold area.
Stochastic: Oscillator Stochastic is also trading at 4 levels which is considered as strong oversold level.
Conclusion: Nifty is in downward trend, so if you find any rise or up move in prices then use that as selling opportunity for the day.
Resistance: R1 8010 R2 8087 R3 8207
Pivot : PL 7967
Support : S1 7890 S2 7847 S3 7728
Our Recommendation
Buy Nifty above 7970 Stop Loss 7930 Target 8030.
Sell Nifty on rise around 8025 Stop Loss 8070 Target 7965.
2. 17th Sept 2014 Equity Bazaar
Bank Nifty
Bank Nifty Technical View:
Yesterday we had seen sharp fall in BANK NIFTY & it has closed near to its bottom level. We can also say that there is positive correlation between Nifty & Bank Nifty.
Price Pattern: Bank Nifty is now showing clear indication of down trend from the significant higher level & the decline is likely continue to some more period & till 15670 & next 15503 levels.
Moving Average: In Hourly chart Bank Nifty has traded below its 50 & 100 EMA & very soon we will see 50 EMA cross below 100 EMA & this is bearish sign.
MACD: The MACD on the hourly charts turn to in strong negative divergence (12days sma trades below 26 days sma) with large negative histogram which act as strong selling signal.
RSI: Oscillator RSI is in downward direction and is trading near 25.48 levels, which is considered as an oversold area.
Stochastic: Oscillator Stochastic is also trading at 5.85 levels which is considered as strong oversold level.
Conclusion: Bank Nifty is in downward trend, so if you find any rise or up move in prices then use that as selling opportunity for the day.
Resistance : R1 16070 R2 16297 R3 16652
Pivot : PL 15942
Support : S1 15715 S2 15587 S3 15232
Our Recommendation
Buy BNF Above 16000 Stop Loss 15920 Target 16250
Sell BNF rise around 15900 Stop Loss 15980 Target 15650
3. 17th Sept 2014 Equity Bazaar
Stock of the Day
Tata Motors View:
After flat trend Tata Motors has given strong support breakout & trade below upper horizontal line.
Price Pattern: Now Tata Motors is trading between the range of higher & middle horizontal line.
Moving Average: In Hourly chart Tata Motors has traded equally its 50 & 100 EMA & very soon we will see 50 EMA cross below 100 EMA & this is bearish sign.
MACD: The MACD on the hourly charts turn to in positive divergence (12days sma trades above 26 days sma) with positive histogram which act as selling signal.
RSI: Oscillator RSI is in downward direction and is trading near 27.56 levels, which is considered as an oversold area.
Stochastic: Oscillator Stochastic also traded at 22.16 levels which are also consider as oversold level & momentums of the Tata Motors is cloudy.
Conclusion: Bank Nifty is in downward trend, so if you find any rise or up move in prices then use that as selling opportunity for the day.
Resistance : R1 501 R2 508 R3 516
Pivot : PL 501
Support : S1 493 S2 486 S3 471
Our Recommendation
Sell Tata Motors below 498 Stop Loss 504 Target 488
4. 17th Sept 2014 Equity Bazaar
Derivative Analysis FIIS Data: FII’s are the net seller on 16 September 2014 is Rs 829 Lakhs and Dll’s are the net buyers on 16 September 2014 is Rs 466 Lakhs. Option Data: 8200 CE has the highest OI with 72 lakhs and 8100 CE has the second highest OI with 66 lakhs and 8000 PE has the highest OI with 65 lakhs and 7900 PE has the second highest OI with 59 lakhs. Open Interest: The above options data shows nifty has now a strong support at 7900 and resistance at 8200 the trend change level as per option data is 8000. Intraday Option Strategy: (A) Buy Nifty 8200 calls and Sell Nifty 7900 puts if buy level is breached (B) Sell Nifty 8200 calls and Buy Nifty 7900 puts if sell level is breached
7. 17th Sept 2014 Equity Bazaar
Disclaimer
This is solely for information of clients of Choice India and does not construe to be an investment advice. It is also not intended as an offer or solicitation for the purchase and sale of any financial instruments. Any action taken by you on the basis of the information contained herein is your responsibility alone and Choice India its subsidiaries or its employees or associates will not be liable in any manner for the consequences of such action taken by you. We have exercised due diligence in checking the correctness and authenticity of the information contained in this recommendation, but Choice India or any of its subsidiaries or associates or employees shall not be in any way responsible for any loss or damage that may arise to any person from any inadvertent error in the information contained in this recommendation or any action taken on basis of this information. Technical analysis studies market psychology, price patterns and volume levels. It is used to forecast future price and market movements. Technical analysis is complementary to fundamental analysis and news sources. The recommendations issued herewith might be contrary to recommendations issued by Choice India in the company research undertaken as the recommendations stated in this report is derived purely from technical analysis. Choice India has based this document on information obtained from sources it believes to be reliable but which it has not independently verified; Choice India makes no guarantee, representation or warranty and accepts no responsibility or liability as to its accuracy or completeness. The opinions contained within the report are based upon publicly available information at the time of publication and are subject to change without notice. The information and any disclosures provided herein are in summary form and have been prepared for informational purposes. The recommendations and suggested price levels are intended purely for trading purposes. The recommendations are valid for the day of the report however trading trends and volumes might vary substantially on an intraday basis and the recommendations may be subject to change. The information and any disclosures provided herein may be considered confidential. Any use, distribution, modification, copying, forwarding or disclosure by any person is strictly prohibited. The information and any disclosures provided herein do not constitute a solicitation or offer to purchase or sell any security or other financial product or instrument. The current performance may be unaudited. Past performance does not guarantee future returns. There can be no assurance that investments will achieve any targeted rates of return, and there is no guarantee against the loss of your entire investment.
POTENTIAL CONFLICT OF INTEREST DISCLOSURE (as on date of report) Disclosure of interest statement – • Analyst interest of the stock /Instrument(s): - No. • Firm interest of the stock / Instrument (s): - No.