1. 17th Sept 2014 Currency Highlights
USDINR
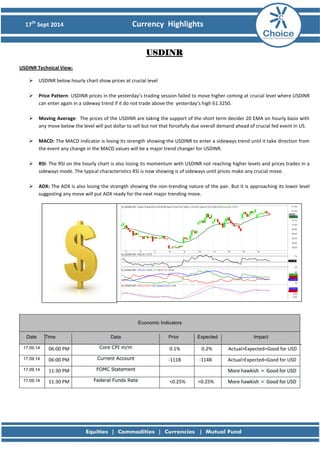
USDINR Technical View:
USDINR below hourly chart show prices at crucial level
Price Pattern: USDINR prices in the yesterday’s trading session failed to move higher coming at crucial level where USDINR can enter again in a sideway trend if it do not trade above the yesterday’s high 61.3250.
Moving Average: The prices of the USDINR are taking the support of the short term decider 20 EMA on hourly basis with any move below the level will put dollar to sell but not that forcefully due overall demand ahead of crucial fed event in US.
MACD: The MACD indicator is losing its strength showing the USDINR to enter a sideways trend until it take direction from the event any change in the MACD values will be a major trend changer for USDINR.
RSI: The RSI on the hourly chart is also losing its momentum with USDINR not reaching higher levels and prices trades in a sideways mode. The typical characteristics RSI is now showing is of sideways until prices make any crucial move.
ADX: The ADX is also losing the strength showing the non-trending nature of the pair. But it is approaching its lower level suggesting any move will put ADX ready for the next major trending move.
Economic Indicators Date Time Data Prior Expected Impact
17.09.14
06:00 PM Core CPI m/m
0.1%
0.2%
Actual>Expected=Good for USD
17.09.14
06:00 PM Current Account
-111B
-114B
Actual>Expected=Good for USD
17.09.14
11:30 PM FOMC Statement
More hawkish = Good for USD
17.09.14
11:30 PM Federal Funds Rate
<0.25%
<0.25% More hawkish = Good for USD
2. 17th Sept 2014 Currency Highlights
EURINR
EURINR Technical View:
The EURINR below hourly chart suggest prices at important level to decide its next short term trend.
Price Pattern: The price pattern of the EURINR showing its facing a resistance at 79.40 levels with prices at crucial level to decide whether it will break for uptrend for the next target 79.80 or break down for target 78.70.
Moving Average: The short term moving average 20 EMA on the below hourly chart acted as good support for the pair but now the prices are near the crucial support any break below the 20 EMA will but selling pressure on EURINR else it will approach for the above mention upward target 79.80
MACD: The MACD indicator is hovering at the over brought level suggesting it will take confirmation only when price either break down or break up. Till then MACD is suggesting the sideways trend.
RSI: RSI is also indicating the sideways trend in the pair but as RSI values are above the mid-range level 50 so any move below that will confirm the downtrend else sideways to continue.
ADX: ADX has reached its lowest level showing the non-trending nature of the pair. But only a definitive move from the prices will put ADX to confirm the trending nature of EURINR.
Economic Indicators Date Time Data Prior Expected Impact
17.09.14
1:30 PM Italian Trade Balance
1.33B
Actual>Expected=Good for EUR
17.09.14
2:30 PM Final CPI y/y
0.3%
0.3%
Actual>Expected=Good for EUR
3. 17th Sept 2014 Currency Highlights
GBPINR
GBPINR Technical View:
The below is the hourly chart of GBPINR with prices are now at make or break level.
Moving Average: The short term trend decider 20 EMA is showing the building weakness in the pound. As seen in the below chart prices are closed below the 20 EMA but to remain on the same basis will confirm the short term down trend in pound else any pullback above the 20 EMA will be a short term uptrend.
MACD: The MACD indicator is also falling in the similar lines with price trend indicating the short term weakness in pound. As MACD now made a negative crossover near the over brought levels confirming the down trend in pound.
RSI: RSI also has started losing the strength near the over brought level 70. This is adding to the confirmation of the weakness in the GBPINR but another important level to watch for RSI is mid-range level 50 whether that breaks or RSI taking support to change the down trend to sideways.
ADX : The ADX has showing the non-trending nature of the but as mentioned above if the prices successively stays below the 20 EMA on hourly basis ADX will start reaching higher level giving the strong trending move in GBPINR.
Economic Indicators Date Time Data Prior Expected Impact
17.09.14
2:00 PM Average Earnings Index 3m/y
-0.2%
0.5%
Actual>Expected=Good for GBP
17.09.14
2:00 PM Claimant Count Change
-33.6K
-29.7K
Actual>Expected=Good for GBP
17.09.14
2:00 PM Unemployment Rate
6.4%
6.3%
Actual>Expected=Good for GBP
4. 17th Sept 2014 Currency Highlights
JPYINR
JPYINR Technical View:
The below is the hourly chart of JPYINR with prices at crucial level.
Moving Average : The prices of the yen has taken exact support at 20 EMA with any move to break the level yen will again go for depreciation against rupee or staying above it will resume its short term uptrend.
MACD: The MACD indicator has not shown any sell signal will be the only to say the continuation of uptrend in yen. But as it is near the over brought will be to remain alert for the buyers of yen.
RSI: RSI is now showing the weakness with failing to cross the over brought level. RSI here also suggest the sideways trend in yen as prices are now at make or break level.
ADX: ADX is almost flat showing the non-trending nature as prices are failing to sustain at higher level. ADX also confirms the continuation of sideways trend in JPYINR till no major move is made in the pair.
Economic Indicators Date Time Data Prior Expected Impact
17.09.14
No Data For JPY Today
6. 17th Sept 2014 Currency Highlights
Disclaimer
This is solely for information of clients of Choice India and does not construe to be an investment advice. It is also not intended as an offer or solicitation for the purchase and sale of any financial instruments. Any action taken by you on the basis of the information contained herein is your responsibility alone and Choice India its subsidiaries or its employees or associates will not be liable in any manner for the consequences of such action taken by you. We have exercised due diligence in checking the correctness and authenticity of the information contained in this recommendation, but Choice India or any of its subsidiaries or associates or employees shall not be in any way responsible for any loss or damage that may arise to any person from any inadvertent error in the information contained in this recommendation or any action taken on basis of this information. Technical analysis studies market psychology, price patterns and volume levels. It is used to forecast future price and market movements. Technical analysis is complementary to fundamental analysis and news sources. The recommendations issued herewith might be contrary to recommendations issued by Choice India in the company research undertaken as the recommendations stated in this report is derived purely from technical analysis. Choice India has based this document on information obtained from sources it believes to be reliable but which it has not independently verified; Choice India makes no guarantee, representation or warranty and accepts no responsibility or liability as to its accuracy or completeness. The opinions contained within the report are based upon publicly available information at the time of publication and are subject to change without notice. The information and any disclosures provided herein are in summary form and have been prepared for informational purposes. The recommendations and suggested price levels are intended purely for trading purposes. The recommendations are valid for the day of the report however trading trends and volumes might vary substantially on an intraday basis and the recommendations may be subject to change. The information and any disclosures provided herein may be considered confidential. Any use, distribution, modification, copying, forwarding or disclosure by any person is strictly prohibited. The information and any disclosures provided herein do not constitute a solicitation or offer to purchase or sell any security or other financial product or instrument. The current performance may be unaudited. Past performance does not guarantee future returns. There can be no assurance that investments will achieve any targeted rates of return, and there is no guarantee against the loss of your entire investment.
POTENTIAL CONFLICT OF INTEREST DISCLOSURE (as on date of report) Disclosure of interest statement – • Analyst interest of the stock /Instrument(s): - No. • Firm interest of the stock / Instrument (s): - No.