
Recommended
More Related Content
What's hot
What's hot (20)
Viewers also liked
Similar to Aaj ka trend 02.01.17
Similar to Aaj ka trend 02.01.17 (15)
Recently uploaded
Recently uploaded (20)
Aaj ka trend 02.01.17
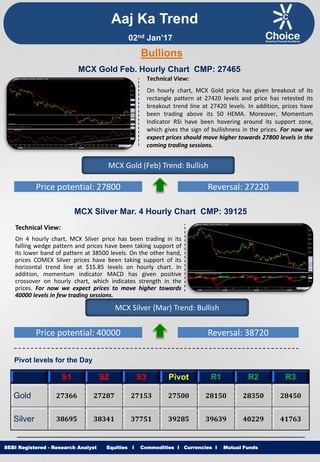
- 1. Equities I Commodities I Currencies I Mutual Funds Aaj Ka Trend Technical View: On hourly chart, MCX Gold price has given breakout of its rectangle pattern at 27420 levels and price has retested its breakout trend line at 27420 levels. In addition, prices have been trading above its 50 HEMA. Moreover, Momentum Indicator RSI have been hovering around its support zone, which gives the sign of bullishness in the prices. For now we expect prices should move higher towards 27800 levels in the coming trading sessions. SEBI Registered - Research Analyst Equities I Commodities I Currencies I Mutual Funds Bullions MCX Gold Feb. Hourly Chart CMP: 27465 MCX Gold (Feb) Trend: Bullish Price potential: 27800 Reversal: 27220 MCX Silver Mar. 4 Hourly Chart CMP: 39125 Technical View: On 4 hourly chart, MCX Silver price has been trading in its falling wedge pattern and prices have been taking support of its lower band of pattern at 38500 levels. On the other hand, prices COMEX Silver prices have been taking support of its horizontal trend line at $15.85 levels on hourly chart. In addition, momentum indicator MACD has given positive crossover on hourly chart, which indicates strength in the prices. For now we expect prices to move higher towards 40000 levels in few trading sessions. MCX Silver (Mar) Trend: Bullish Price potential: 40000 Reversal: 38720 Pivot levels for the Day S1 S2 S3 Pivot R1 R2 R3 Gold 27366 27287 27153 27500 28150 28350 28450 Silver 38695 38341 37751 39285 39639 40229 41763 02nd Jan’17
- 2. Equities I Commodities I Currencies I Mutual Funds Technical View: MCX Copper price has been trading in falling channel pattern and prices have been hovering around its resistance of its upper band of channel pattern at 382 levels on 4 hourly chart. In addition MCX Copper prices are trading below its 100 HEMA. Furthermore, momentum indicator CCI has faced resistance of its falling trend line at +157 levels on 4 hourly time frame, which suggest further down side momentum can be seen. For now we expect prices to move lower towards 367 levels in coming trading sessions. SEBI Registered - Research Analyst Equities I Commodities I Currencies I Mutual Funds MCX Copper Feb. 4 hourly Chart CMP: 376.85 MCX Copper (Feb) Trend: Bearish Price potential: 367 Reversal: 382 MCX Crude Oil Jan. Hourly Chart CMP: 3648 Technical View: MCX Crude Oil prices has given breakdown of its rising trend line at 3665 levels on hourly chart. MCX Crude Oil is trading below its 21 HEMA on hourly chart. On the other hand, NYMEX WTI Crude oil price has shown breakdown of its rising trend line at $54.10 levels. Moreover, Momentum indicator MACD is trading moving below its signal line levels on hourly chart which suggest the negative movement in the prices. For now we expect prices to move lower towards 3550 levels in coming trading sessions. MCX Crude Oil (Jan) Trend: Bearish Price potential: 3550 Reversal: 3710 Pivot levels for the Day S1 S2 S3 Pivot R1 R2 R3 Copper 375.1 373.5 371.7 376.9 378.5 380.3 385.4 Crude 3632 3613 3589 3656 3675 3699 3767 Base Metal Energy Aaj Ka Trend 02nd Jan’17
- 3. Equities I Commodities I Currencies I Mutual FundsSEBI Registered - Research Analyst Equities I Commodities I Currencies I Mutual Funds Other Base Metals & Energy S1 S2 S3 Pivot R1 R2 R3 Trend Copper 375.1 373.5 371.7 376.9 378.5 380.3 385.4 Aluminum 114.4 113.7 112.9 115.1 115.8 116.6 118.8 Lead 133.2 131.7 130.0 134.9 136.5 138.2 143.1 Nickel 676.9 673.8 668.1 682.6 685.7 691.4 705.8 Zinc 172.3 170.4 169.5 173.1 175.0 175.9 179.5 Natural Gas 248.6 245.2 239.3 254.5 257.9 263.8 279.0 Fundamental News: Gold prices eased on Friday as gains from a weak dollar was offset by profit-taking at the end of a year in which bullion gained about more than 8 percent, snapping three years of declines. In the first half of 2016, investors increased gold exposure as the Federal Reserve showed caution on raising interest rates due to concerns about global growth, while Britain's vote to leave the European Union curbed appetite for risk and pushed the metal to a two-year high in July. Gold prices fell more than 8 percent in November, on higher U.S. Treasury yields after Donald Trump's presidential election win led to speculation his commitment to infrastructure spending would spur growth. The dollar, oil and U.S. stocks slipped on Friday in thin pre-holiday trading on the last trading day of 2016, but were well on track to notch up sizable gains for the year. U.S. stocks slipped following weak economic data and a decline in technology stocks. a spate of robust economic reports, the Chicago Purchasing Manager Index fell more than expected to 54.6 in December. market is ending 2016 with a whimper. Oil prices were down for the day, but still on track for their biggest annual gain in seven years after OPEC and other major producers agreed to cut output to reduce a global supply overhang that has depressed prices for two years. crude LCOc1 was down 0.47 percent at $56.58 a barrel, while U.S. crude CLc1 was down 0.33 percent at $53.59. In bond markets, U.S. Treasuries were little changed across the curve in thin pre-holiday trading. Treasuries ended the fourth quarter with their poorest performance in the history of the Merrill Lynch Treasury index, with a -4.175 percent return, through Thursday. Aaj Ka Trend 02nd Jan’17
- 4. Equities I Commodities I Currencies I Mutual FundsSEBI Registered - Research Analyst Equities I Commodities I Currencies I Mutual Funds International Market Commodity Closing Price Gold 1152 Silver 15.96 Crude Oil 53.90 Brent Crude Oil 56.74 Natural Gas 3.74 COMEX/NYMEX/ICE ( Precious Metals & Energy) Currency & Commodity Index Currency (Spot) Current Price USD / INR 67.95 Dollar Index 102.37 EUR / USD 1.05 CRB Index* 192.51 Closing as on 30.12.16 *Closing as on 30.12.16 LME (Base Metals) ( $ per tones) Commodity Closing Price Copper 5513 Aluminum 1707 Zinc 2565 Lead 2007 Nickel 9980 SHFE (Base Metals) (Yuan per tones) Commodity Closing Price Copper 44520 Aluminum 12580 Zinc 21000 Lead 18000 Closing as on 30.12.16 Closing as on 30.12.16 LME INVENTORY DATA Aaj Ka Trend 26-Dec-16 27-Dec-16 28-Dec-16 29-Dec-16 30-Dec-16 Aluminium 0 0 26775 6875 22251 Copper 0 0 -3475 -2751 -6125 Lead 0 0 -200 -51 -799 Nickel 0 0 -162 -125 -125 Zinc 0 0 -350 -475 -475 02nd Jan’17
- 5. Equities I Commodities I Currencies I Mutual Funds This is solely for information of clients of Choice Broking and does not construe to be an investment advice. It is also not intended as an offer or solicitation for the purchase and sale of any financial instruments. Any action taken by you on the basis of the information contained herein is your responsibility alone and Choice Broking its subsidiaries or its employees or associates will not be liable in any manner for the consequences of such action taken by you. We have exercised due diligence in checking the correctness and authenticity of the information contained in this recommendation, but Choice Broking or any of its subsidiaries or associates or employees shall not be in any way responsible for any loss or damage that may arise to any person from any inadvertent error in the information contained in this recommendation or any action taken on basis of this information. Technical analysis studies market psychology, price patterns and volume levels. It is used to forecast future price and market movements. Technical analysis is complementary to fundamental analysis and news sources. The recommendations issued herewith might be contrary to recommendations issued by Choice Broking in the company research undertaken as the recommendations stated in this report is derived purely from technical analysis. Choice Broking has based this document on information obtained from sources it believes to be reliable but which it has not independently verified; Choice Broking makes no guarantee, representation or warranty and accepts no responsibility or liability as to its accuracy or completeness. The opinions contained within the report are based upon publicly available information at the time of publication and are subject to change without notice. The information and any disclosures provided herein are in summary form and have been prepared for informational purposes. The recommendations and suggested price levels are intended purely for trading purposes. The recommendations are valid for the day of the report however trading trends and volumes might vary substantially on an intraday basis and the recommendations may be subject to change. The information and any disclosures provided herein may be considered confidential. Any use, distribution, modification, copying, forwarding or disclosure by any person is strictly prohibited. The information and any disclosures provided herein do not constitute a solicitation or offer to purchase or sell any security or other financial product or instrument. The current performance may be unaudited. Past performance does not guarantee future returns. There can be no assurance that investments will achieve any targeted rates of return, and there is no guarantee against the loss of your entire investment. POTENTIAL CONFLICT OF INTEREST DISCLOSURE (as on date of report) Disclosure of interest statement – • Analyst interest of the stock /Instrument(s): - No. • Firm interest of the stock / Instrument (s): - No. Disclaimer Contact Us Amit Pathania Research Associate amit.pathania@choiceindia.com www.choicebroking.incustomercare@choiceindia.com SEBI Registered - Research Analyst Equities I Commodities I Currencies I Mutual Funds Aaj Ka Trend 02nd Jan’17 Neeraj Yadav Research Advisor neeraj.yadav@choiceindia.com Anish Vyas Senior Research Associate anish.vyas@choiceindia.com Amit Pathania Digitally signed by Amit Pathania DN: cn=Amit Pathania, o=Choice Equity Broking Pvt. ltd, ou=Research Department, email=amit.pathania@choiceindia.com, c=IN Date: 2016.12.31 12:51:05 +05'30'