1. 25th Sept’ 14 Currency Highlights
USDINR
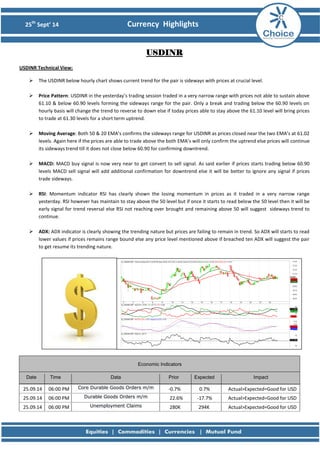
USDINR Technical View:
The USDINR below hourly chart shows current trend for the pair is sideways with prices at crucial level.
Price Pattern: USDINR in the yesterday’s trading session traded in a very narrow range with prices not able to sustain above 61.10 & below 60.90 levels forming the sideways range for the pair. Only a break and trading below the 60.90 levels on hourly basis will change the trend to reverse to down else if today prices able to stay above the 61.10 level will bring prices to trade at 61.30 levels for a short term uptrend.
Moving Average: Both 50 & 20 EMA’s confirms the sideways range for USDINR as prices closed near the two EMA’s at 61.02 levels. Again here if the prices are able to trade above the both EMA’s will only confirm the uptrend else prices will continue its sideways trend till it does not close below 60.90 for confirming downtrend.
MACD: MACD buy signal is now very near to get convert to sell signal. As said earlier if prices starts trading below 60.90 levels MACD sell signal will add additional confirmation for downtrend else it will be better to ignore any signal if prices trade sideways.
RSI: Momentum indicator RSI has clearly shown the losing momentum in prices as it traded in a very narrow range yesterday. RSI however has maintain to stay above the 50 level but if once it starts to read below the 50 level then it will be early signal for trend reversal else RSI not reaching over brought and remaining above 50 will suggest sideways trend to continue.
ADX: ADX indicator is clearly showing the trending nature but prices are failing to remain in trend. So ADX will starts to read lower values if prices remains range bound else any price level mentioned above if breached ten ADX will suggest the pair to get resume its trending nature.
Economic Indicators Date Time Data Prior Expected Impact
25.09.14
06:00 PM Core Durable Goods Orders m/m
-0.7%
0.7%
Actual>Expected=Good for USD
25.09.14
06:00 PM Durable Goods Orders m/m
22.6%
-17.7%
Actual>Expected=Good for USD
25.09.14
06:00 PM Unemployment Claims
280K
294K
Actual>Expected=Good for USD
2. 25th Sept’ 14 Currency Highlights
EURINR
EURINR Technical View:
Trend for the EURINR has reversed to bearish as prices fails to sustain above the previous high of 78.75 levels.
Price Pattern: EURINR prices failed to sustain above yesterday’s high 78.75 with a gap down opening as the gap remains unfilled which change the price pattern to bearish. In the yesterday’s trading session prices also made lower lows and lower high formation confirming the downtrend.
Moving Average: As prices fails to sustain above the both 20 & 50 EMA’s changing the trend to down. Till the prices do not close with a positive crossover of the both EMA’s the downtrend will continue in EURINR.
MACD: With prices confirming the downtrend MACD indicator is also near to give a sell signal which will add confirmation for the downtrend. As prices will starts to trade at lower levels MACD will approach to oversold region giving strong confirmation for downtrend.
RSI: Momentum indicator RSI has clearly shown the loss of strength in prices to stay at higher level. RSI in yesterday’s trading session not only break the mid-range level 50 but also made the pair to look extremely weak compare to other currencies.
ADX: ADX has reached the lower values showing the trendless nature. But it is very important to see that prices to trade at lower levels. ADX values will start reading above the 25 levels confirming the strong bearishness in the pair.
Economic Indicators Date Time Data Prior Expected Impact
25.09.14
01:30 PM M3 Money Supply y/y
1.8%
1.9%
Actual>Expected=Good for EUR
25.09.14
01:30 PM Private Loans y/y
-1.6%
-1.5%
Actual>Expected=Good for EUR
25.09.14
01:30 PM Italian Retail Sales m/m
0.0%
0.2%
Actual>Expected=Good for EUR
3. 25th Sept’ 14 Currency Highlights
GBPINR
GBPINR Technical View:
Pound prices are now showing a sideways range as prices are neither sustaining at low or neither at high.
Moving Average: In the yesterday’s trading session with a very volatile movement prices have maintain to stay above the both 20 &50 EMA’s on hourly basis. This will be the last hope for the bulls in pound as once if prices start trading below the both EMA’s changing the trend in pound to down. Till then sideways trend will continues till prices do not trade above 100.25 levels.
MACD: MACD indicator yesterday’s buy signal is very close to give a sell signal. Confirmation will come from prices once GBPINR starts trading below 99.80 levels. Till then price movement will be watchful before taking any clue from MACD.
RSI: RSI indicator is showing the losing strength in the pound as prices traded in a very sideways fashion. RSI is maintaining to stay above the mid-range level 50 will be the last signal for the bulls to stay long. Once RSI starts reading below the mid- range level 50 giving an early signal for change of trend in pound.
ADX: ADX is going with the prices movement as sideways range continues in GBPINR with ADX values reading below the 20 levels. Here also ADX will show the strong trending nature in the pair once prices starts trading either above 100.25 or below 99.80 levels.
Economic Indicators Date Time Data Prior Expected Impact
25.09.14
03:30 PM CBI Realized Sales
37
34
Actual>Expected=Good for GBP
25.09.14
06:10 PM BOE Gov Carney Speaks
More Hawkish=Good for GBP
4. 25th Sept’ 14 Currency Highlights
JPYINR
JPYINR Technical View:
Yen below hourly chart shows the failure of uptrend and continuation its downtrend.
Moving Average: Yen prices in the yesterday’s trading session failed to stay above the both EMA’s with its earlier downtrend.
MACD: MACD indicator buy signal has now turned to sell signal which adds to the confirmation of downtrend in the pair.
If today prices remains to stay below the yesterday high of 56.32 levels then sell signal will remain valid.
RSI: RSI indicator not only showed the loss of momentum but also breaks and stays below the mid-range level 50 suggesting the downtrend continuation in yen.
ADX: Despite of the prices entering downtrend ADX is still showing its trendless nature. Once prices starts trading at lower levels then ADX will turn from trendless to trending nature for JPYINR.
Economic Indicators Date Time Data Prior Expected Impact
25.09.14
05:20 AM SPPI y/y
3.7%
3.7%
Actual>Expected=Good for JPY
6. 25th Sept’ 14 Currency Highlights
Disclaimer
This is solely for information of clients of Choice India and does not construe to be an investment advice. It is also not intended as an offer or solicitation for the purchase and sale of any financial instruments. Any action taken by you on the basis of the information contained herein is your responsibility alone and Choice India its subsidiaries or its employees or associates will not be liable in any manner for the consequences of such action taken by you. We have exercised due diligence in checking the correctness and authenticity of the information contained in this recommendation, but Choice India or any of its subsidiaries or associates or employees shall not be in any way responsible for any loss or damage that may arise to any person from any inadvertent error in the information contained in this recommendation or any action taken on basis of this information. Technical analysis studies market psychology, price patterns and volume levels. It is used to forecast future price and market movements. Technical analysis is complementary to fundamental analysis and news sources. The recommendations issued herewith might be contrary to recommendations issued by Choice India in the company research undertaken as the recommendations stated in this report is derived purely from technical analysis. Choice India has based this document on information obtained from sources it believes to be reliable but which it has not independently verified; Choice India makes no guarantee, representation or warranty and accepts no responsibility or liability as to its accuracy or completeness. The opinions contained within the report are based upon publicly available information at the time of publication and are subject to change without notice. The information and any disclosures provided herein are in summary form and have been prepared for informational purposes. The recommendations and suggested price levels are intended purely for trading purposes. The recommendations are valid for the day of the report however trading trends and volumes might vary substantially on an intraday basis and the recommendations may be subject to change. The information and any disclosures provided herein may be considered confidential. Any use, distribution, modification, copying, forwarding or disclosure by any person is strictly prohibited. The information and any disclosures provided herein do not constitute a solicitation or offer to purchase or sell any security or other financial product or instrument. The current performance may be unaudited. Past performance does not guarantee future returns. There can be no assurance that investments will achieve any targeted rates of return, and there is no guarantee against the loss of your entire investment.
POTENTIAL CONFLICT OF INTEREST DISCLOSURE (as on date of report) Disclosure of interest statement – • Analyst interest of the stock /Instrument(s): - No. • Firm interest of the stock / Instrument (s): - No.