
Recommended
More Related Content
What's hot
What's hot (20)
Similar to Currency high lights 27.06.16
Similar to Currency high lights 27.06.16 (20)
Recently uploaded
Recently uploaded (20)
Currency high lights 27.06.16
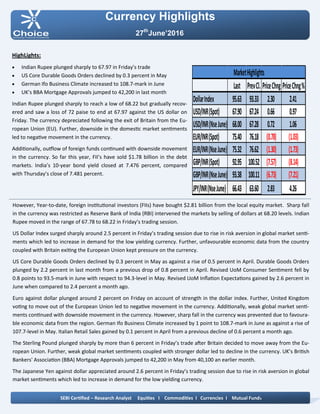
- 1. Currency Highlights 27th June’2016 HighLights: Indian Rupee plunged sharply to 67.97 in Friday’s trade US Core Durable Goods Orders declined by 0.3 percent in May German Ifo Business Climate increased to 108.7-mark in June UK’s BBA Mortgage Approvals jumped to 42,200 in last month Indian Rupee plunged sharply to reach a low of 68.22 but gradually recov- ered and saw a loss of 72 paise to end at 67.97 against the US dollar on Friday. The currency depreciated following the exit of Britain from the Eu- ropean Union (EU). Further, downside in the domestic market sentiments led to negative movement in the currency. Additionally, outflow of foreign funds continued with downside movement in the currency. So far this year, FII’s have sold $1.78 billion in the debt markets. India’s 10-year bond yield closed at 7.476 percent, compared with Thursday’s close of 7.481 percent. However, Year-to-date, foreign institutional investors (FIIs) have bought $2.81 billion from the local equity market. Sharp fall in the currency was restricted as Reserve Bank of India (RBI) intervened the markets by selling of dollars at 68.20 levels. Indian Rupee moved in the range of 67.78 to 68.22 in Friday’s trading session. US Dollar Index surged sharply around 2.5 percent in Friday’s trading session due to rise in risk aversion in global market senti- ments which led to increase in demand for the low yielding currency. Further, unfavourable economic data from the country coupled with Britain exiting the European Union kept pressure on the currency. US Core Durable Goods Orders declined by 0.3 percent in May as against a rise of 0.5 percent in April. Durable Goods Orders plunged by 2.2 percent in last month from a previous drop of 0.8 percent in April. Revised UoM Consumer Sentiment fell by 0.8 points to 93.5-mark in June with respect to 94.3-level in May. Revised UoM Inflation Expectations gained by 2.6 percent in June when compared to 2.4 percent a month ago. Euro against dollar plunged around 2 percent on Friday on account of strength in the dollar index. Further, United Kingdom voting to move out of the European Union led to negative movement in the currency. Additionally, weak global market senti- ments continued with downside movement in the currency. However, sharp fall in the currency was prevented due to favoura- ble economic data from the region. German Ifo Business Climate increased by 1 point to 108.7-mark in June as against a rise of 107.7-level in May. Italian Retail Sales gained by 0.1 percent in April from a previous decline of 0.6 percent a month ago. The Sterling Pound plunged sharply by more than 6 percent in Friday’s trade after Britain decided to move away from the Eu- ropean Union. Further, weak global market sentiments coupled with stronger dollar led to decline in the currency. UK’s British Bankers' Association (BBA) Mortgage Approvals jumped to 42,200 in May from 40,100 an earlier month. The Japanese Yen against dollar appreciated around 2.6 percent in Friday’s trading session due to rise in risk aversion in global market sentiments which led to increase in demand for the low yielding currency. SEBI Certified – Research Analyst Equities I Commodities I Currencies I Mutual Funds Last PrevCl. PriceChng PriceChng% DollarIndex 95.63 93.33 2.30 2.41 USD/INR(Spot) 67.90 67.24 0.66 0.97 USD/INR(NseJune) 68.00 67.28 0.72 1.06 EUR/INR(Spot) 75.40 76.18 (0.78) (1.03) EUR/INR(NseJune) 75.32 76.62 (1.30) (1.73) GBP/INR(Spot) 92.95 100.52 (7.57) (8.14) GBP/INR(NseJune) 93.38 100.11 (6.73) (7.21) JPY/INR(NseJune) 66.43 63.60 2.83 4.26 MarketHighlights
- 2. Technical View: The pair has shown breakout of its rising wedge pattern at 65.50 levels on daily chart. The price has given breakout of its consolidation range of 62.50 to 65 levels on daily chart, which indicates further upside momentum in the prices. In addition, on daily chart prices have been trading above its 21 daily exponential moving average which gives the positive confirmation to the prices. On daily chart, momentum oscillator RSI has remained above 60 levels, which gives positive confirmation to the prices. A momentum indicator MACD has shown positive crossover on daily chart, which indicates short term trend remains bull- ish. For now we expect prices to move higher towards 67 levels in few trading sessions. Pivot levels for the Day Technical View: The price has been trading in its rising channel formation from past few months and price has face strong resistance of its upper band at 68.50 levels on daily chart. Moreover, price have been trading below its 21 hourly expo- nential moving average which suggest near term remains down. So any rally in the prices towards 68.10 level, used as selling opportunity. A momentum indicator RSI has faced resistance of its hori- zontal trend line at 65 levels on daily chart, which suggest bearishness in the prices. A momentum indictor MACD has given negative crossover on hourly chart, which gives negative confirmation to the prices. For now we expect prices to move lower towards 67.50 lev- els in few trading sessions. Currency Highlights 27th June’2016 USDINR JPYINR SEBI Certified – Research Analyst Equities I Commodities I Currencies I Mutual Funds S3 S2 S1 Pivot R1 R2 R3 USDINR 67.09 67.55 67.78 68.01 68.24 68.47 68.93 JPYINR 59.74 63.34 64.89 66.94 68.49 70.54 74.14
- 3. Pivot levels for the Day Currency Highlights 27th June’2016 GBPINR EURINR Technical View: The price has shown breakdown of its rising channel pattern at 75.50 levels on daily chart. The pair has given breakdown of its symmetrical triangle pattern at 76.45 levels on daily chart with bolstering volumes. On the other hand, Pair has been trading below its 21 daily exponential moving average which indicates that trend is remains down. A momentum oscillator RSI have been trading below 45 lev- els on daily chart which gives the signs of bearishness to the prices. Moreover, momentum indicator MACD has shown negative crossover on daily chart which support our bearish view on the pair. For now we expect prices should move lower towards 74 levels in the coming trading sessions. Technical View: The price has shown breakdown of its horizontal channel pattern at 94 levels on daily chart. On the other hand, Pair has been trading below its 21 daily exponential moving average which indicates that short term trend is remains bearish. A momentum indicator RSI has moved below 45 levels on daily chart, which suggest bearishness in the prices. Moreover, momentum indicator MACD has shown negative crossover on daily chart which support our bearish view on the pair. For now we expect prices should move lower towards 92 levels in the coming trading sessions. SEBI Certified – Research Analyst Equities I Commodities I Currencies I Mutual Funds S3 S2 S1 Pivot R1 R2 R3 GBPINR 83.91 88.44 90.91 92.97 95.44 97.50 102.03 EURINR 71.92 73.57 74.45 75.22 76.10 76.87 78.52
- 4. Currency Highlights SEBI Certified – Research Analyst Equities I Commodities I Currencies I Mutual Funds Economic Indicators Date Time Data Prior Expected Impact 26.06.16 All Day Spanish Parliamentary Election 27.06.16 1:30pm M3 Money Supply y/y 4.6% 4.8% Actual > Forecast = Good for currency; EURINR 27th June’2016
- 5. Currency Highlights 27th June’2016 SEBI Certified – Research Analyst Equities I Commodities I Currencies I Mutual Funds Amit Pathania Digitally signed by Amit Pathania DN: cn=Amit Pathania, o=Choice Equity Broking Pvt. ltd, ou=Research Department, email=amit.pathania@choiceindia.com, c=IN Date: 2016.06.27 08:41:26 +05'30'