
Recommended
More Related Content
What's hot
What's hot (20)
Viewers also liked
Viewers also liked (19)
Similar to Currency high lights 09.02.17
Similar to Currency high lights 09.02.17 (20)
Recently uploaded
Recently uploaded (20)
Currency high lights 09.02.17
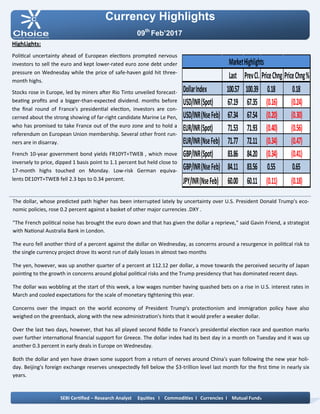
- 1. Currency Highlights 09th Feb’2017 HighLights: Political uncertainty ahead of European elections prompted nervous investors to sell the euro and kept lower-rated euro zone debt under pressure on Wednesday while the price of safe-haven gold hit three- month highs. Stocks rose in Europe, led by miners after Rio Tinto unveiled forecast- beating profits and a bigger-than-expected dividend. months before the final round of France's presidential election, investors are con- cerned about the strong showing of far-right candidate Marine Le Pen, who has promised to take France out of the euro zone and to hold a referendum on European Union membership. Several other front run- ners are in disarray. French 10-year government bond yields FR10YT=TWEB , which move inversely to price, dipped 1 basis point to 1.1 percent but held close to 17-month highs touched on Monday. Low-risk German equiva- lents DE10YT=TWEB fell 2.3 bps to 0.34 percent. The dollar, whose predicted path higher has been interrupted lately by uncertainty over U.S. President Donald Trump's eco- nomic policies, rose 0.2 percent against a basket of other major currencies .DXY . "The French political noise has brought the euro down and that has given the dollar a reprieve," said Gavin Friend, a strategist with National Australia Bank in London. The euro fell another third of a percent against the dollar on Wednesday, as concerns around a resurgence in political risk to the single currency project drove its worst run of daily losses in almost two months The yen, however, was up another quarter of a percent at 112.12 per dollar, a move towards the perceived security of Japan pointing to the growth in concerns around global political risks and the Trump presidency that has dominated recent days. The dollar was wobbling at the start of this week, a low wages number having quashed bets on a rise in U.S. interest rates in March and cooled expectations for the scale of monetary tightening this year. Concerns over the impact on the world economy of President Trump's protectionism and immigration policy have also weighed on the greenback, along with the new administration's hints that it would prefer a weaker dollar. Over the last two days, however, that has all played second fiddle to France's presidential election race and question marks over further international financial support for Greece. The dollar index had its best day in a month on Tuesday and it was up another 0.3 percent in early deals in Europe on Wednesday. Both the dollar and yen have drawn some support from a return of nerves around China's yuan following the new year holi- day. Beijing's foreign exchange reserves unexpectedly fell below the $3-trillion level last month for the first time in nearly six years. SEBI Certified – Research Analyst Equities I Commodities I Currencies I Mutual Funds Last PrevCl. PriceChng PriceChng% DollarIndex 100.57 100.39 0.18 0.18 USD/INR(Spot) 67.19 67.35 (0.16) (0.24) USD/INR(NseFeb) 67.34 67.54 (0.20) (0.30) EUR/INR(Spot) 71.53 71.93 (0.40) (0.56) EUR/INR(NseFeb) 71.77 72.11 (0.34) (0.47) GBP/INR(Spot) 83.86 84.20 (0.34) (0.41) GBP/INR(NseFeb) 84.11 83.56 0.55 0.65 JPY/INR(NseFeb) 60.00 60.11 (0.11) (0.18) MarketHighlights
- 2. Technical View: On the hourly chart, the pair has given the breakdown of its rising trend line at 60 levels. The pair has been trading in horizontal channel pattern from past few weeks and price has faced the resistance of its upper band at 60.50 levels on the hourly chart. Moreover, prices have been trading below its 21 DSMA which gives the sign of bearishness in the prices. On daily chart momentum indicator, RSI is trading below 60 levels which indicate downside momentum can be seen in the prices. In addition, momentum indicator MACD has shown neg- ative crossover which suggests lack of strength in the prices on the hourly chart. So for trading perspective, one can JPYINR sell in the range of 60.20 with SL of 60.50 for the target of 59.60 levels. Pivot levels for the Day Technical View: The pair has given the breakdown of its horizontal chan- nel pattern and prices have been retested its breakdown trend line channel pattern at 68 levels on 4 hourly charts. On the hourly chart, the pair has given the breakdown of its rising trend line at 68.20 levels. Moreover, prices have been trading below its 21 HSMA which gives the sign of bearishness in the prices. A momentum indicator RSI has shown bearish range shift at 45 levels, which suggest further negative mo- mentum can be seen in the prices. In addition, momentum indicator MACD has shown neg- ative crossover and moving above its signal line on 4 hourly chart. So for trading perspective, one can sell USDINR in range 67.45 with SL of 67.65 for the target of 67. Currency Highlights 09th Feb’2017 USDINR JPYINR SEBI Certified – Research Analyst Equities I Commodities I Currencies I Mutual Funds S3 S2 S1 Pivot R1 R2 R3 USDINR 67.02 67.21 67.27 67.40 67.46 67.59 67.78 JPYINR 59.60 59.84 59.92 60.08 60.16 60.32 60.56
- 3. Pivot levels for the Day Currency Highlights 09th Feb’2017 GBPINR EURINR Technical View: The pair has given the breakdown of its rising channel pattern and price have been almost retested its break- down channel pattern at 85.50 levels on the daily chart. The pair has been trading below its 21 HSMA on the hourly chart, which suggests further weakness can be seen in the prices. On daily chart momentum oscillator, RSI has been mov- ing below 50 levels on the hourly chart, which suggest bearishness in the prices. A momentum indicator MACD has shown negative crossover on the hourly chart, which supports our bear- ish view to the prices. For now, we can expect prices should move lower to- wards 71.10 levels in the coming trading session. Technical View: The pair has given the breakdown of its rising channel pattern and price have been almost retested its break- down channel pattern at 85.50 levels on the daily chart. The prices have given the breakdown of its horizontal trend line at 86 levels on the daily chart. Moreover, prices have been trading below 21 DSMA, which suggest short term trend looks down. Moreover, momentum indicator MACD has given nega- tive crossover on a daily chart, which gives the sign of bearishness in the prices. The momentum indicator RSI has been trading below 60 levels on the daily chart, which suggest the possibili- ties of further downside momentum in the prices. For now, we expect prices should move lower to- wards 83.30 levels coming trading sessions. SEBI Certified – Research Analyst Equities I Commodities I Currencies I Mutual Funds S3 S2 S1 Pivot R1 R2 R3 GBPINR 83.51 83.87 83.99 84.23 84.35 84.59 84.95 EURINR 71.03 71.47 71.62 71.91 72.06 72.35 72.79
- 4. Currency Highlights SEBI Certified – Research Analyst Equities I Commodities I Currencies I Mutual Funds 09th Feb’2017 Economic Indicators Date Time Data Prior Expected Impact 09.02.17 07:00 PM Unemployment Claims 246K 249K Actual < Forecast = Good for currency; USDINR 09.02.17 08:30 PM Final Wholesale Inventories m/ m 1.0% 1.0% Actual < Forecast = Good for currency; USDINR
- 5. Currency Highlights 09th Feb’2017 SEBI Certified – Research Analyst Equities I Commodities I Currencies I Mutual Funds Amit Pathania Digitally signed by Amit Pathania DN: cn=Amit Pathania, o=Choice Equity Broking Pvt. ltd, ou=Research Department, email=amit.pathania@choiceindia.com, c=IN Date: 2017.02.08 22:29:27 +05'30'