Booking open Available Pune Call Girls Shivane 6297143586 Call Hot Indian Gi...
Currency high lights 08.12.16
1. Currency Highlights
08th
Dec’2016
HighLights:
The Indian rupee on Wednesday strengthened for the seventh consecutive
sessions to closed at nearly one month high against the US dollar while 10
year bond yield jumped 20 basis points its biggest gains in over three years
after the Reserve Bank of India kept interest rates unchanged.
The decision to leave the repo rate unchanged—which had the unanimous
consent of all six members of the monetary policy committee—comes as a
surprise. Eleven of 14 economists and bankers surveyed by Mint expected
the monetary policy committee to reduce the benchmark rate by 25 bps at
the monetary policy review. One expected a sharper 50 bps rate cut.
Rupee closed at 67.64 a dollar—a level last seen on 11 November, from its
previous close of 67.90. The rupee opened at 67.82 and touched a high of
67.63 a dollar. So far this year it fell 2.2%.
Most Asian emerging market currencies weakened as dollar strengthened,
while shares rose on optimism that the European Central Bank (ECB) will con-
tinue its bond-buying program.
The U.S. dollar weakened slightly against major rivals on Wednesday, following a dip in Treasury yields, though moves were muted ahead
of policy-setting meetings of the European Central Bank on Thursday and the Federal Reserve next week. The euro held firm near a three-
week high versus the dollar on Thursday, as investors turned their attention to the European Central Bank's policy meeting later in the day,
and as the greenback was dragged down by a drop in U.S. bond yields.
Fed funds futures, a popular tool for traders to bet on U.S. interest-rate policy, indicate an above-90% probability for such a move. But in-
vestors are keen to watch the “dot plot” of policy makers’ predictions for the future level of the fed funds rate. They indicate that policy
makers expect to raise rates twice in 2017.
The euro has been the main focus for traders this week after Italian Prime Minister Matteo Renzi said he will resign after suffering a sting-
ing defeat in a referendum on constitutional reform.
The ECB is expected to announce a six-month extension to its quantitative easing programme on Thursday, while keeping the size of asset
purchases unchanged at 80 billion euros, according to a majority of economists polled by Reuters. abundant risk, including from forthcom-
ing elections in Europe, ECB President Mario Draghi is expected to argue that premature tapering - or slowly ending - bond-buying could
abort a still timid recovery, unravelling the impact of the buys. euro edged up 0.2 percent to $1.0769 after gaining 0.3 percent on Wednes-
day. It was trading within sight of Monday's peak of $1.0797, its highest level since Nov. 15.
The dollar index which measures the greenback against a basket of six major currencies, stood at 100.09 .DXY =USD , down from Wednes-
day's intraday high of 100.60.
There was limited reaction to a downward revision to Japan's July-September gross domestic product (GDP) data, which showed lower
than expected growth of 0.3 percent quarter-on-quarter, compared to market expectations for 0.6 percent growth. late November, the
dollar index had set a 13-1/2 year high of 102.05, having rallied as U.S. bond yields surged on expectations of higher fiscal spending and a
faster pace of Federal Reserve monetary tightening under President-elect Donald Trump.
SEBI Certified – Research Analyst Equities I Commodities I Currencies I Mutual Funds
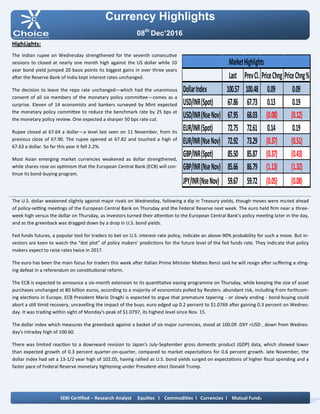
Last PrevCl. PriceChng PriceChng%
DollarIndex 100.57 100.48 0.09 0.09
USD/INR(Spot) 67.86 67.73 0.13 0.19
USD/INR(NseNov) 67.95 68.03 (0.08) (0.12)
EUR/INR(Spot) 72.75 72.61 0.14 0.19
EUR/INR(NseNov) 72.92 73.29 (0.37) (0.51)
GBP/INR(Spot) 85.50 85.87 (0.37) (0.43)
GBP/INR(NseNov) 85.66 86.79 (1.13) (1.32)
JPY/INR(NseNov) 59.67 59.72 (0.05) (0.08)
MarketHighlights
2. Technical View:
On daily chart JPYINR price has shown breakdown of its
falling channel pattern at 61.60 levels. The price has giv-
en breakdown of its descending triangle pattern at 61
levels on daily chart.
Moreover, prices have been trading below its 21 DEMA
which gives the sign of bearishness in the prices.
On daily chart momentum indicator RSI is trading below
50 levels which suggest further weakness can be seen in
the prices.
In addition, momentum indicator MACD has shown neg-
ative crossover and trading below signal line on daily
chart.
So for trading perspective, one could JPYINR sell in the
range of 60 with SL of 60.40 for target of 59.30 levels.
Pivot levels for the Day
Technical View:
The pair has been facing resistance of its rising trend
line at 68.85 levels on daily chart. On daily chart USDINR
price has faced resistance of its horizontal trend line at
68.90 levels.
Moreover, prices have been trading below its 21 HEMA
which gives the sign of bearishness in the prices.
A momentum indicator RSI has been trading below 65
levels, which suggest further positive momentum can be
seen in the prices.
In addition, momentum indicator MACD has shown
negative crossover on 4 hourly chart.
So for trading perspective, one could sell USDINR in
range 68.10 with SL of 68.40 for target of 67.30.
Currency Highlights
08th
Dec’2016
USDINR JPYINR
SEBI Certified – Research Analyst Equities I Commodities I Currencies I Mutual Funds
S3 S2 S1 Pivot R1 R2 R3
USDINR 67.53 67.75 67.86 67.97 68.08 68.19 68.41
JPYINR 59.27 59.48 59.49 59.69 59.70 59.90 60.11
3. Pivot levels for the Day
Currency Highlights
08th
Dec’2016
GBPINR EURINR
Technical View:
The price has shown breakdown of its descending trian-
gle a pattern at 72.70 levels on daily chart. The EURINR
pair has shown horizontal trend line at 72.80 levels on
daily chart.
The pair has been trading below its 50 DEMA on daily
chart, which suggest further weakness can be seen in
the prices.
On daily chart momentum oscillator RSI have been trad-
ing below 60 which suggest bearishness in the prices.
A momentum indicator MACD has shown negative
crossover on daily chart, which add more bearishness
in the prices.
For now we can expect prices should move lower to-
wards 72.30 levels in the coming trading session.
Technical View:
The pair has shown breakout of its rising channel
pattern at 85 levels on daily chart. The price has been
hovering around its falling trend line at 87.10 levels.
Moreover, prices have been trading above 21 DEMA,
which suggest short term trend looks positive.
Moreover, price has shown breakout of its horizontal
trend line at 84.60 levels on daily chart.
A momentum indicator MADC has given positive Cross
over on hourly chart, which gives the sign of bullishness
in the prices.
The momentum indictor RSI has been trading above 60
levels on daily chart, which suggest the possibilities of
bounce back in the in the prices.
For now we expect prices should move higher towards
86.40 levels coming trading sessions.
SEBI Certified – Research Analyst Equities I Commodities I Currencies I Mutual Funds
S3 S2 S1 Pivot R1 R2 R3
GBPINR 84.65 85.21 85.41 85.77 85.97 86.33 86.89
EURINR 72.34 72.64 72.78 72.94 73.08 73.24 73.54
4. Currency Highlights
SEBI Certified – Research Analyst Equities I Commodities I Currencies I Mutual Funds
08th
Dec’2016
Economic Indicators
Date Time Data Prior Expected Impact
08.12.16 Tentative Trade Balance 325B 327B Actual > Forecast = Good
for currency; CNY
08.12.16 07:00 PM ECB Press Conference 5.49M 5.53M More hawkish than expected
= Good for currency;
GBPINR
08.12.16 07:00 PM Unemployment Claims 268K 272K Actual < Forecast = Good
for currency; USDINR
5. Currency Highlights
08th
Dec’2016
SEBI Certified – Research Analyst Equities I Commodities I Currencies I Mutual Funds
Amit Pathania
Digitally signed by Amit Pathania
DN: cn=Amit Pathania, o=Choice Equity Broking Pvt. ltd, ou=Research
Department, email=amit.pathania@choiceindia.com, c=IN
Date: 2016.12.08 08:42:00 +05'30'