The US dollar climbed against other major currencies due to concerns over political uncertainty in the eurozone. The euro fell after the ECB president downplayed calls to scale back stimulus. The dollar index rose 0.78% and the dollar held gains as the euro remained weak. The Australian and Canadian dollars also declined while the yen strengthened as uncertainty over Trump's policies weighed on markets. Most analysts expect the Fed to take a cautious approach to rate hikes in 2017 with less than a 10% chance of a rise in March.
Cybersecurity Threats in Financial Services Protection.pptx
Currency high lights 08.02.17
1. Currency Highlights
08th
Feb’2017
HighLights:
The dollar climbed against a currency basket on Tuesday, boosted by
the weaker euro as concerns over political uncertainty pressured the
single currency lower.
The single currency came under additional selling pressure after Euro-
pean Central Bank President Mario Draghi on Monday downplayed
calls for the bank to scale back its stimulus program.
The U.S. dollar index, which measures the greenback’s strength
against a trade-weighted basket of six major currencies, climbed
0.78% to 100.62.
The Reserve Bank of Australia held interest rates steady at its first pol-
icy meeting of 2017on Tuesday and said a recent soft patch in growth
was temporary and would not prevent a healthy pickup over time.
The dollar Tuesday held on to overnight gains as the euro remained
under pressure. Trump has not advanced on plans for fiscal stimulus
and tax cuts which are perceived as dollar positive.
The dollar steadied after falling on Friday when the latest U.S. employment report showed that while jobs growth beat expec-
tations last month wage growth remained tepid.
The slowdown in wage growth looked likely prompt the Federal Reserve to adopt a more cautious approach on raising interest
rates this year.
According to Investing.com's Fed Rate Monitor Tool less than 10% of traders expect the Fed to raise interest rates at its next
meeting in March. The chance of a June increase is seen at just below 50%.
The dollar was lower against the safe haven yen as uncertainty over President Donald Trump's policies continued to weigh,
with USD/JPY down 0.27% at 112.36, not far from last Thursday’s lows of 112.04, the weakest since November 30.
Sterling was near one-week lows, with GBP/USD down 0.27% at 1.2450 as a parliamentary debate on a law giving Prime Minis-
ter Theresa May the right to trigger Brexit proceedings continued.
The Dollar-Yen pair clocked a high of 113.50 on Friday before ending the week at 112.55 levels. The volatile Japanese Govern-
ment bond (JGB) yields saw the Yen move both ways in Asia. By early Europe, the pair had regained the bullish tone as the BOJ
offered to buy unlimited amount of 5 year and 10-year government bonds.
The 10-year treasury yield has failed repeatedly sustain gains above 2.5% over the last two months. The yield hit a high of 2.5%
following the Dec Fed rate hike and since mid-January has been restricted to a narrow range of 2.5% to 2.3%.
SEBI Certified – Research Analyst Equities I Commodities I Currencies I Mutual Funds
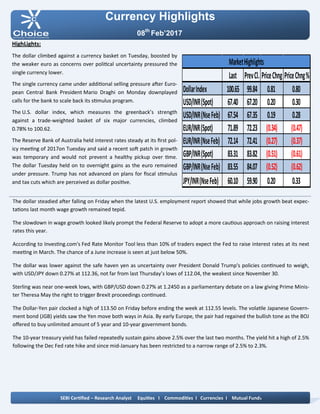
Last PrevCl. PriceChng PriceChng%
DollarIndex 100.65 99.84 0.81 0.80
USD/INR(Spot) 67.40 67.20 0.20 0.30
USD/INR(NseFeb) 67.54 67.35 0.19 0.28
EUR/INR(Spot) 71.89 72.23 (0.34) (0.47)
EUR/INR(NseFeb) 72.14 72.41 (0.27) (0.37)
GBP/INR(Spot) 83.31 83.82 (0.51) (0.61)
GBP/INR(NseFeb) 83.55 84.07 (0.52) (0.62)
JPY/INR(NseFeb) 60.10 59.90 0.20 0.33
MarketHighlights
2. Technical View:
On the hourly chart, the pair has given the breakdown of
its rising trend line at 60 levels.
The pair has been trading in horizontal channel pattern
from past few weeks and price has faced the resistance
of its upper band at 60.50 levels on the hourly chart.
Moreover, prices have been trading below its 21 DSMA
which gives the sign of bearishness in the prices.
On daily chart momentum indicator, RSI is trading below
60 levels which indicate downside momentum can be
seen in the prices.
In addition, momentum indicator MACD has shown neg-
ative crossover which suggests lack of strength in the
prices on the hourly chart.
So for trading perspective, one can JPYINR sell in the
range of 60.20 with SL of 60.50 for the target of 59.60
levels.
Pivot levels for the Day
Technical View:
The pair has given the breakdown of its horizontal chan-
nel pattern and prices have been retested its breakdown
trend line channel pattern at 68 levels on 4 hourly
charts.
On the hourly chart, the pair has given the breakdown
of its rising trend line at 68.20 levels.
Moreover, prices have been trading below its 21 HSMA
which gives the sign of bearishness in the prices.
A momentum indicator RSI has shown bearish range
shift at 45 levels, which suggest further negative mo-
mentum can be seen in the prices.
In addition, momentum indicator MACD has shown neg-
ative crossover and moving above its signal line on 4
hourly chart.
So for trading perspective, one can sell USDINR in range
67.65 with SL of 67.90 for the target of 67.10.
Currency Highlights
08th
Feb’2017
USDINR JPYINR
SEBI Certified – Research Analyst Equities I Commodities I Currencies I Mutual Funds
S3 S2 S1 Pivot R1 R2 R3
USDINR 67.15 67.33 67.43 67.51 67.61 67.69 67.87
JPYINR 59.54 59.87 59.99 60.20 60.32 60.53 60.86
3. Pivot levels for the Day
Currency Highlights
08th
Feb’2017
GBPINR EURINR
Technical View:
The pair has given the breakdown of its rising channel
pattern and price have been almost retested its break-
down channel pattern at 85.50 levels on the daily chart.
The pair has been trading below its 21 HSMA on the
hourly chart, which suggests further weakness can be
seen in the prices.
On daily chart momentum oscillator, RSI has been mov-
ing below 50 levels on the hourly chart, which suggest
bearishness in the prices.
A momentum indicator MACD has shown negative
crossover on the hourly chart, which supports our bear-
ish view to the prices.
For now, we can expect prices should move lower to-
wards 71.70 levels in the coming trading session.
Technical View:
The pair has given the breakdown of its rising channel
pattern and price have been almost retested its break-
down channel pattern at 85.50 levels on the daily chart.
The prices have given the breakdown of its horizontal
trend line at 86 levels on the daily chart.
Moreover, prices have been trading below 21 DSMA,
which suggest short term trend looks down.
Moreover, momentum indicator MACD has given nega-
tive crossover on a daily chart, which gives the sign of
bearishness in the prices.
The momentum indicator RSI has been trading below
60 levels on the daily chart, which suggest the possibili-
ties of further downside momentum in the prices.
For now, we expect prices should move lower to-
wards 83 levels coming trading sessions.
SEBI Certified – Research Analyst Equities I Commodities I Currencies I Mutual Funds
S3 S2 S1 Pivot R1 R2 R3
GBPINR 82.28 83.02 83.29 83.76 84.03 84.50 85.24
EURINR 71.54 71.87 72.00 72.20 72.33 72.53 72.86
4. Currency Highlights
SEBI Certified – Research Analyst Equities I Commodities I Currencies I Mutual Funds
08th
Feb’2017
Economic Indicators
Date Time Data Prior Expected Impact
07.02.17 05:20 AM Current Account 1.80T 1.71T Actual > Forecast = Good for
currency; JPYINR
07.02.17 09:00 PM Crude Oil Inventories 6.5M
5. Currency Highlights
08th
Feb’2017
SEBI Certified – Research Analyst Equities I Commodities I Currencies I Mutual Funds
Amit Pathania
Digitally signed by Amit Pathania
DN: cn=Amit Pathania, o=Choice Equity Broking Pvt. ltd, ou=Research
Department, email=amit.pathania@choiceindia.com, c=IN
Date: 2017.02.07 20:53:29 +05'30'