Download to read offline
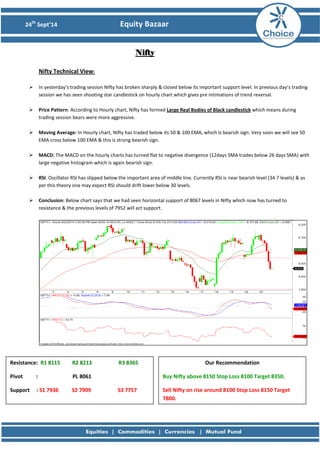
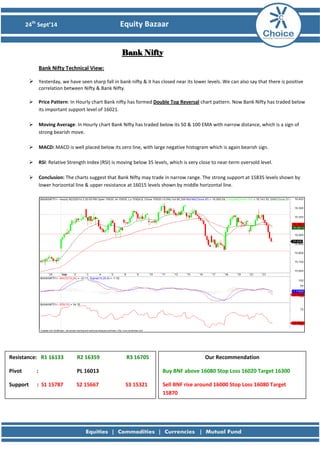
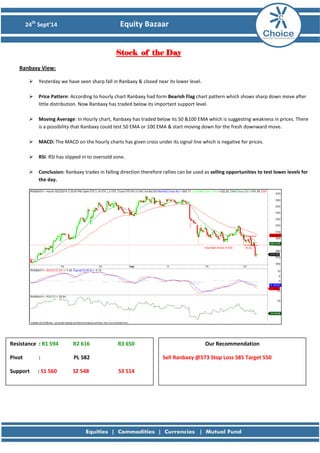
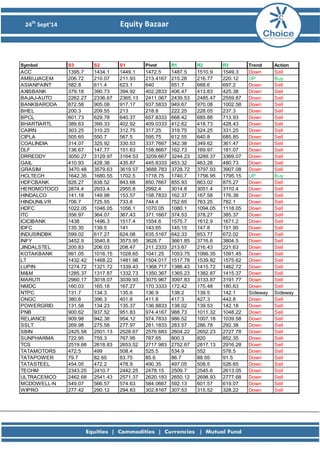

The document provides a technical analysis of the Nifty, Bank Nifty, and Ranbaxy stock from September 24th, 2014. It notes that Nifty broke below an important support level and is showing bearish technical indicators on hourly charts such as closing below moving averages. Bank Nifty also showed a sharp fall and bearish patterns. Ranbaxy is expected to continue its falling direction. Overall, the technical analysis indicates bearish trends for the indices and stock.


