
Recommended
More Related Content
What's hot
What's hot (20)
Similar to Aaj ka trend 09.01.17
Similar to Aaj ka trend 09.01.17 (19)
Recently uploaded
Recently uploaded (20)
Aaj ka trend 09.01.17
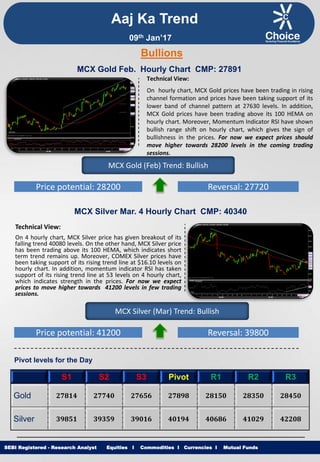
- 1. Equities I Commodities I Currencies I Mutual Funds Aaj Ka Trend Technical View: On hourly chart, MCX Gold prices have been trading in rising channel formation and prices have been taking support of its lower band of channel pattern at 27630 levels. In addition, MCX Gold prices have been trading above its 100 HEMA on hourly chart. Moreover, Momentum Indicator RSI have shown bullish range shift on hourly chart, which gives the sign of bullishness in the prices. For now we expect prices should move higher towards 28200 levels in the coming trading sessions. SEBI Registered - Research Analyst Equities I Commodities I Currencies I Mutual Funds Bullions MCX Gold Feb. Hourly Chart CMP: 27891 MCX Gold (Feb) Trend: Bullish Price potential: 28200 Reversal: 27720 MCX Silver Mar. 4 Hourly Chart CMP: 40340 Technical View: On 4 hourly chart, MCX Silver price has given breakout of its falling trend 40080 levels. On the other hand, MCX Silver price has been trading above its 100 HEMA, which indicates short term trend remains up. Moreover, COMEX Silver prices have been taking support of its rising trend line at $16.10 levels on hourly chart. In addition, momentum indicator RSI has taken support of its rising trend line at 53 levels on 4 hourly chart, which indicates strength in the prices. For now we expect prices to move higher towards 41200 levels in few trading sessions. MCX Silver (Mar) Trend: Bullish Price potential: 41200 Reversal: 39800 Pivot levels for the Day S1 S2 S3 Pivot R1 R2 R3 Gold 27814 27740 27656 27898 28150 28350 28450 Silver 39851 39359 39016 40194 40686 41029 42208 09th Jan’17
- 2. Equities I Commodities I Currencies I Mutual Funds Technical View: MCX Copper price has been trading in falling channel pattern and prices have been hovering around its resistance of its upper band of channel pattern at 386 levels on daily chart. In addition MCX Copper prices are trading below its 21 HEMA. Furthermore, momentum indicator MACD has remained below signal line on daily time frame, which suggest further down side momentum can be seen. For now we expect prices to move lower towards 374 levels in coming trading sessions. SEBI Registered - Research Analyst Equities I Commodities I Currencies I Mutual Funds MCX Copper Feb. Daily Chart CMP: 383.55 MCX Copper (Feb) Trend: Bearish Price potential: 374 Reversal: 389 MCX Crude Oil Jan. Hourly Chart CMP: 3676 Technical View: MCX Crude Oil prices has given breakdown of its rising trend line at 3610 levels on hourly chart. MCX Crude Oil is trading below its 50 HEMA on hourly chart. On the other hand, NYMEX WTI Crude oil price has shown breakdown of its rising trend line at $54 levels. Moreover, Momentum indicator MACD has shown negative crossover and moving below its signal line on hourly chart which suggest negative movement in the prices. For now we expect prices to move lower towards 3580 levels in coming trading sessions. MCX Crude Oil (Jan) Trend: Bearish Price potential: 3580 Reversal: 3735 Pivot levels for the Day S1 S2 S3 Pivot R1 R2 R3 Copper 380.0 376.4 374.4 382.0 385.6 387.6 395.2 Crude 3645 3607 3580 3672 3710 3737 3830 Base Metal Energy Aaj Ka Trend 09th Jan’17
- 3. Equities I Commodities I Currencies I Mutual FundsSEBI Registered - Research Analyst Equities I Commodities I Currencies I Mutual Funds Other Base Metals & Energy S1 S2 S3 Pivot R1 R2 R3 Trend Copper 380.0 376.4 374.4 382.0 385.6 387.6 395.2 Aluminum 115.7 114.7 114.0 116.3 117.3 118.0 120.3 Lead 138.6 136.6 135.5 139.7 141.7 142.8 147.1 Nickel 694.1 687.6 683.3 698.4 704.9 709.2 724.4 Zinc 175.7 173.3 172.0 177.0 179.4 180.7 185.7 Natural Gas 219.7 215.0 211.0 223.7 228.4 232.4 245.2 Fundamental News: The dollar gained significant ground today, surging on positive job creation figures from a U.S. government report, but gold and silver suffered price setbacks. The dollar was rising based on data that showed the addition of about 150,000 new jobs last month in the U.S. Hourly wages increased nearly 3%. Job creation was weaker than expected by analysts, including overseas observers of the U.S. market. The U.S labor market showed that the economy fewer jobs than expected in December while the jobless rate ticked up as expected from what had been its lowest level in more than nine years, according to official data released on Friday. Non-farm payrolls rose only by 156,000 jobs in December, compared to the rise of 204,000 the prior month that was revised from the initial reading of 178,000. The data beat the consensus estimate for the creation of 178,000 jobs. Investors purchased futures ahead of the weekend, but the strong U.S. dollar limited price gains, as did overhanging doubts about whether all OPEC producers would cut output in line with an agreement reached Nov. 30. Top crude producer Saudi Arabia and neighbors Abu Dhabi and Kuwait showed signs they were indeed cutting production in performance with an agreement by OPEC and other producers. Russia is not yet complying the OPEC cut, which it agreed to in December, even though it is not an OPEC member, experts said. The Iranians are said to have millions of barrels of oil stored on ocean tankers which it is expected to start selling in order to regain market share lost during recent years, according to experts. Aaj Ka Trend 09th Jan’17
- 4. Equities I Commodities I Currencies I Mutual FundsSEBI Registered - Research Analyst Equities I Commodities I Currencies I Mutual Funds International Market Commodity Closing Price Gold 1172 Silver 15.52 Crude Oil 53.71 Brent Crude Oil 56.83 Natural Gas 2.54 COMEX/NYMEX/ICE ( Precious Metals & Energy) Currency & Commodity Index Currency (Spot) Current Price USD / INR 68.16 Dollar Index 102.17 EUR / USD 1.05 CRB Index* 193.54 Closing as on 06.01.17 *Closing as on 06.01.17 LME (Base Metals) ( $ per tones) Commodity Closing Price Copper 5590 Aluminum 1713 Zinc 2619 Lead 2056 Nickel 10245 SHFE (Base Metals) (Yuan per tones) Commodity Closing Price Copper 45450 Aluminum 12665 Zinc 21455 Lead 18155 Closing as on 06.01.17 Closing as on 06.01.17 LME INVENTORY DATA Aaj Ka Trend 02-Jan-17 03-Jan-17 04-Jan-17 05-Jan-17 06-Jan-17 Aluminium 0 -3750 -5701 25975 5425 Copper 0 -10401 -5949 -4100 -6650 Lead 0 -51 -1000 -25 -175 Nickel 0 787 -343 -804 -805 Zinc 0 -475 54 -175 -75 09th Jan’17
- 5. Equities I Commodities I Currencies I Mutual Funds This is solely for information of clients of Choice Broking and does not construe to be an investment advice. It is also not intended as an offer or solicitation for the purchase and sale of any financial instruments. Any action taken by you on the basis of the information contained herein is your responsibility alone and Choice Broking its subsidiaries or its employees or associates will not be liable in any manner for the consequences of such action taken by you. We have exercised due diligence in checking the correctness and authenticity of the information contained in this recommendation, but Choice Broking or any of its subsidiaries or associates or employees shall not be in any way responsible for any loss or damage that may arise to any person from any inadvertent error in the information contained in this recommendation or any action taken on basis of this information. Technical analysis studies market psychology, price patterns and volume levels. It is used to forecast future price and market movements. Technical analysis is complementary to fundamental analysis and news sources. The recommendations issued herewith might be contrary to recommendations issued by Choice Broking in the company research undertaken as the recommendations stated in this report is derived purely from technical analysis. Choice Broking has based this document on information obtained from sources it believes to be reliable but which it has not independently verified; Choice Broking makes no guarantee, representation or warranty and accepts no responsibility or liability as to its accuracy or completeness. The opinions contained within the report are based upon publicly available information at the time of publication and are subject to change without notice. The information and any disclosures provided herein are in summary form and have been prepared for informational purposes. The recommendations and suggested price levels are intended purely for trading purposes. The recommendations are valid for the day of the report however trading trends and volumes might vary substantially on an intraday basis and the recommendations may be subject to change. The information and any disclosures provided herein may be considered confidential. Any use, distribution, modification, copying, forwarding or disclosure by any person is strictly prohibited. The information and any disclosures provided herein do not constitute a solicitation or offer to purchase or sell any security or other financial product or instrument. The current performance may be unaudited. Past performance does not guarantee future returns. There can be no assurance that investments will achieve any targeted rates of return, and there is no guarantee against the loss of your entire investment. POTENTIAL CONFLICT OF INTEREST DISCLOSURE (as on date of report) Disclosure of interest statement – • Analyst interest of the stock /Instrument(s): - No. • Firm interest of the stock / Instrument (s): - No. Disclaimer Contact Us Amit Pathania Research Associate amit.pathania@choiceindia.com www.choicebroking.incustomercare@choiceindia.com SEBI Registered - Research Analyst Equities I Commodities I Currencies I Mutual Funds Aaj Ka Trend 09th Jan’17 Neeraj Yadav Research Advisor neeraj.yadav@choiceindia.com Anish Vyas Senior Research Associate anish.vyas@choiceindia.com Amit Pathania Digitally signed by Amit Pathania DN: cn=Amit Pathania, o=Choice Equity Broking Pvt. ltd, ou=Research Department, email=amit.pathania@choiceindia.com, c=IN Date: 2017.01.07 14:52:52 +05'30'